
Originally published: 21/06/2022 14:50
Last version published: 22/08/2022 09:38
Publication number: ELQ-46504-2
View all versions & Certificate
Last version published: 22/08/2022 09:38
Publication number: ELQ-46504-2
View all versions & Certificate

Financial Ratio Analysis & Comparison Excel Dashboard
Excel model/dashboard to compute and compare financial metrics and financial ratios across up to 5 companies and 4 years presented in table and chart format
financial ratiosdashboardexceldownloadcomparisonfinancial metricsprofitabilityefficiencyvaluationleverage
Description
PURPOSE OF TOOL
User-friendly financial model to compute and compare the financial ratios of up to 5 companies and across 4 years in an intuitive dashboard containing output tables and charts.
The model calculates 25 financial ratios spit across profitability, liquidity, efficiency, leverage/risk and valuation ratios using income statement, balance sheet and cash flow statement inputs for each of the timeline years and comparison companies.
The model follows good practice financial modelling principles and includes instructions, checks and input validations.
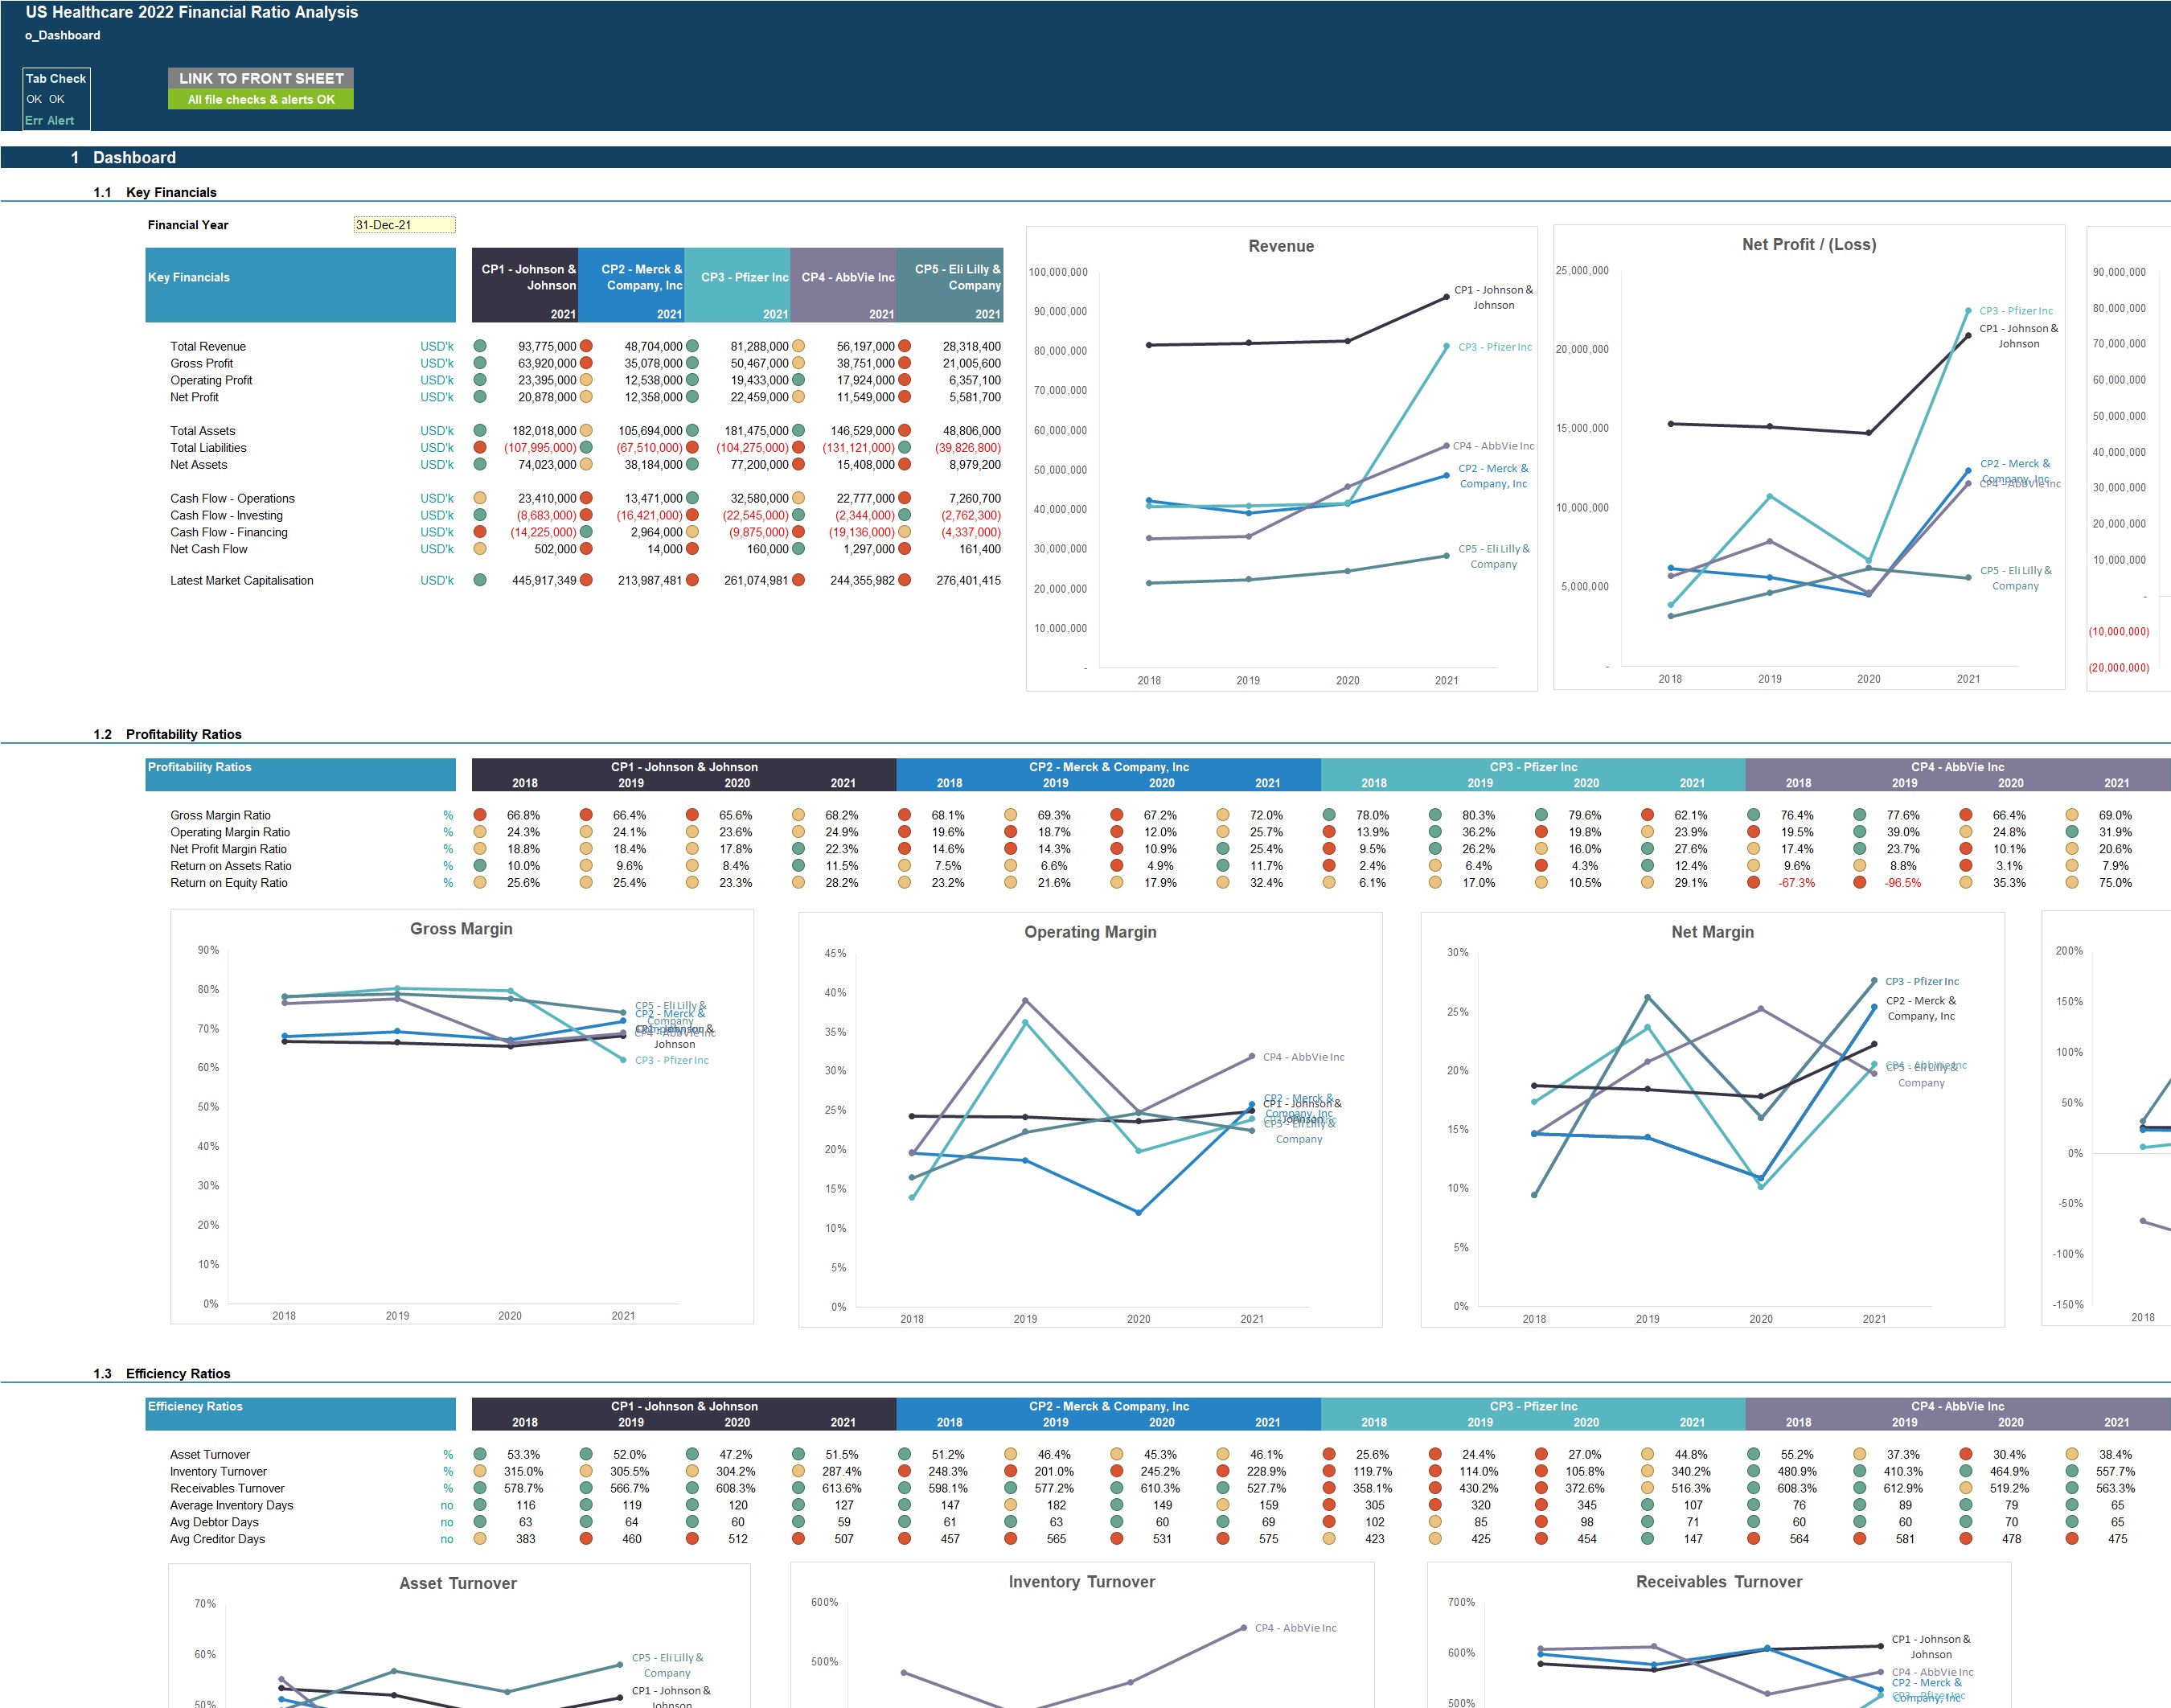
KEY OUTPUTS
The key outputs include:
- Key financial metrics for each comparison company
- 25 Financial ratios by year and by company split into profitability ratios, efficiency ratios, liquidity ratios, leverage/risk ratios and valuation ratios.
- Charts presenting the financial ratios
KEY INPUTS
Inputs are split into Setup inputs, and financials inputs:
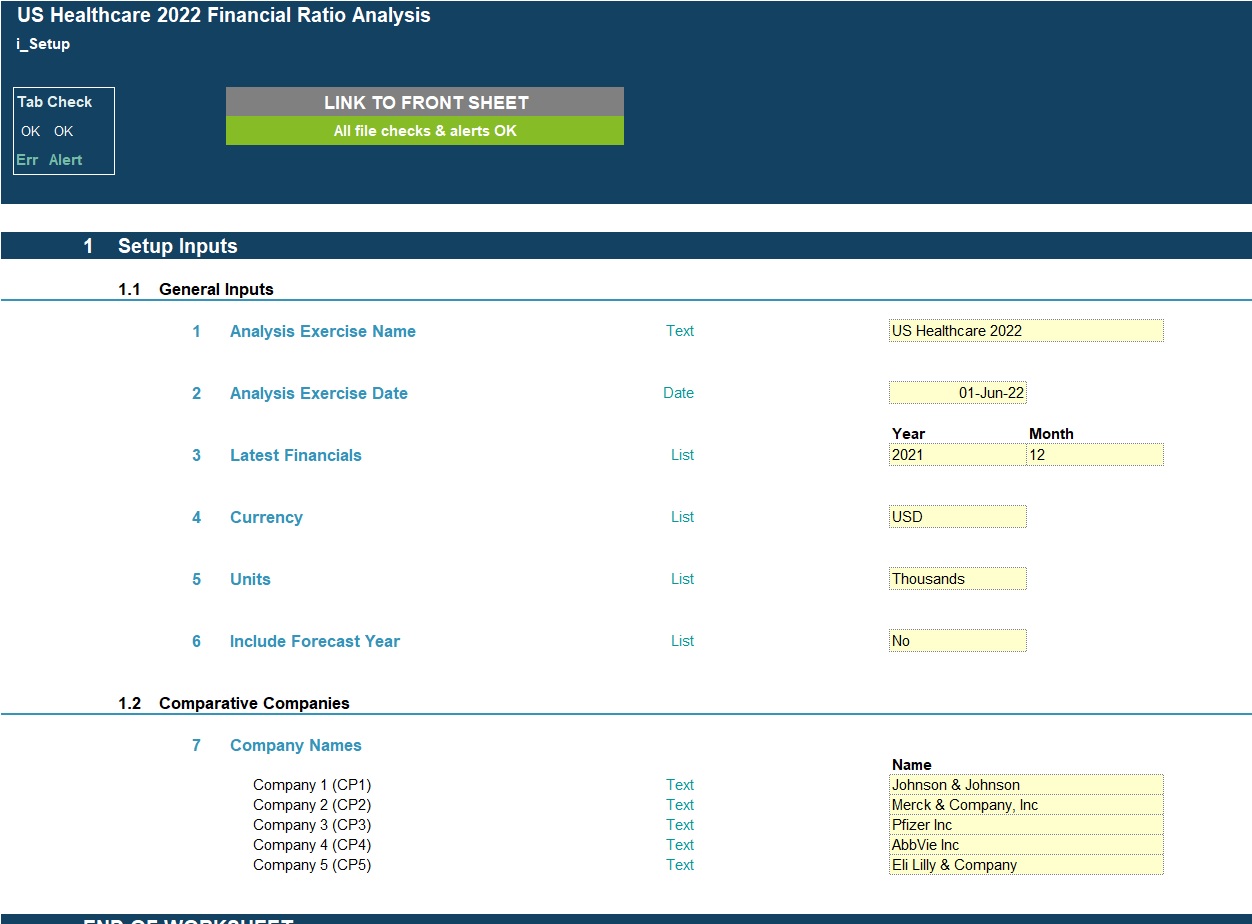
Setup Inputs:
- Name of financial ratio exercise;
- Date of financial ratio exercise;
- Currency;
- Latest financial period and whether timeline includes a forecast year;
- Units for financial inputs (eg thousands or millions or nil)
- Name of comparative companies
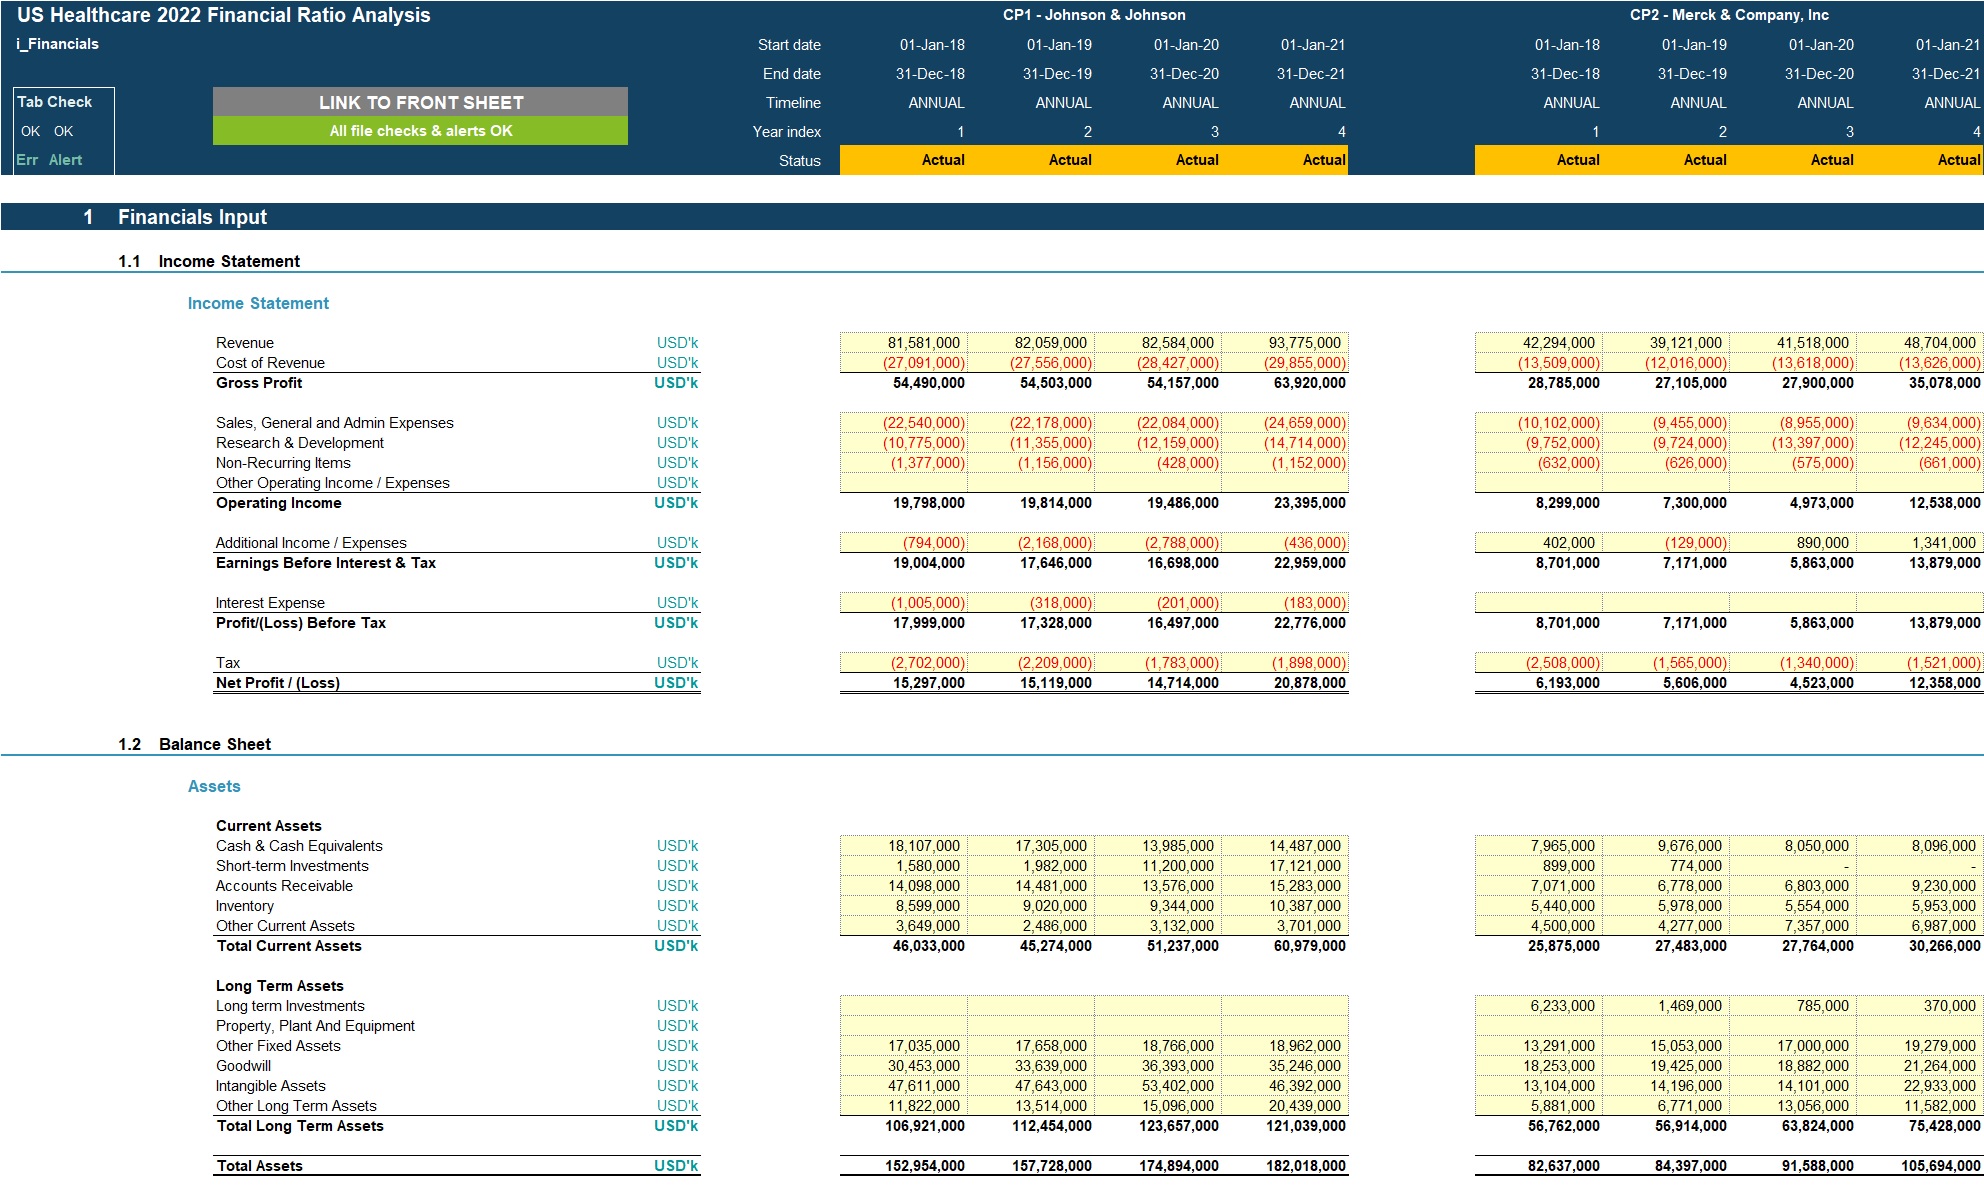
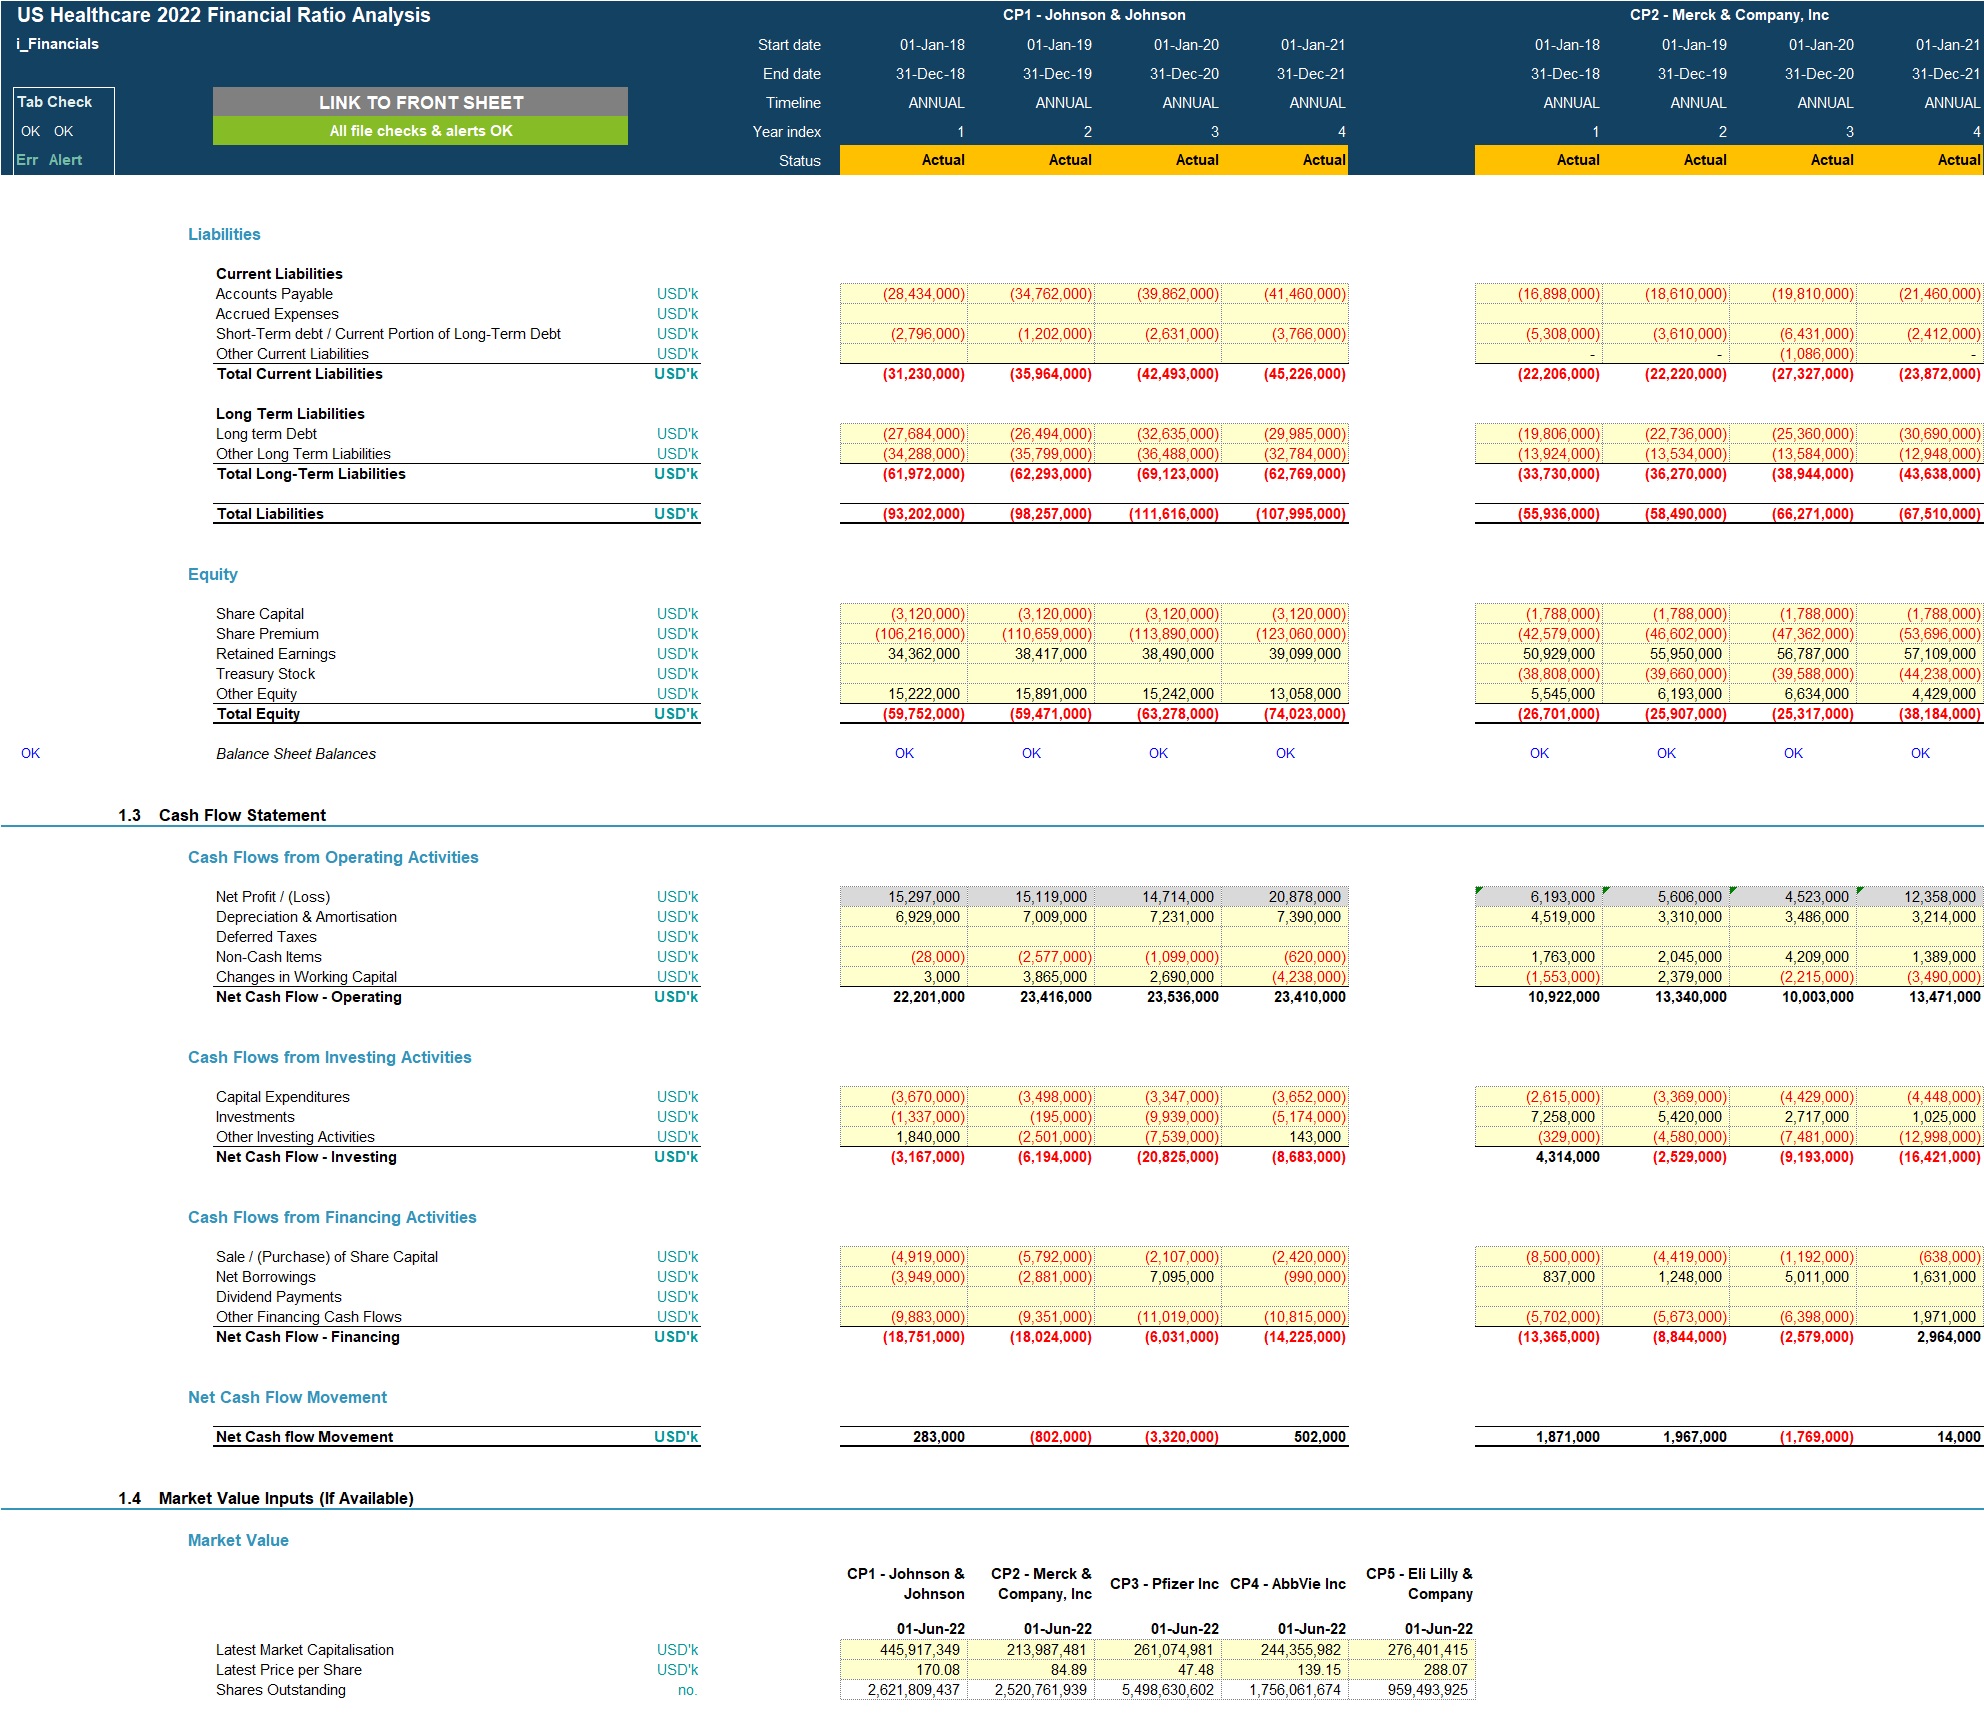
Financials Inputs:
- Income statement, balance sheet and cash flow inputs for past 3 or 4 years and forecast year if applicable;
- Latest market capitalisation if available;
- Latest price per share if available.
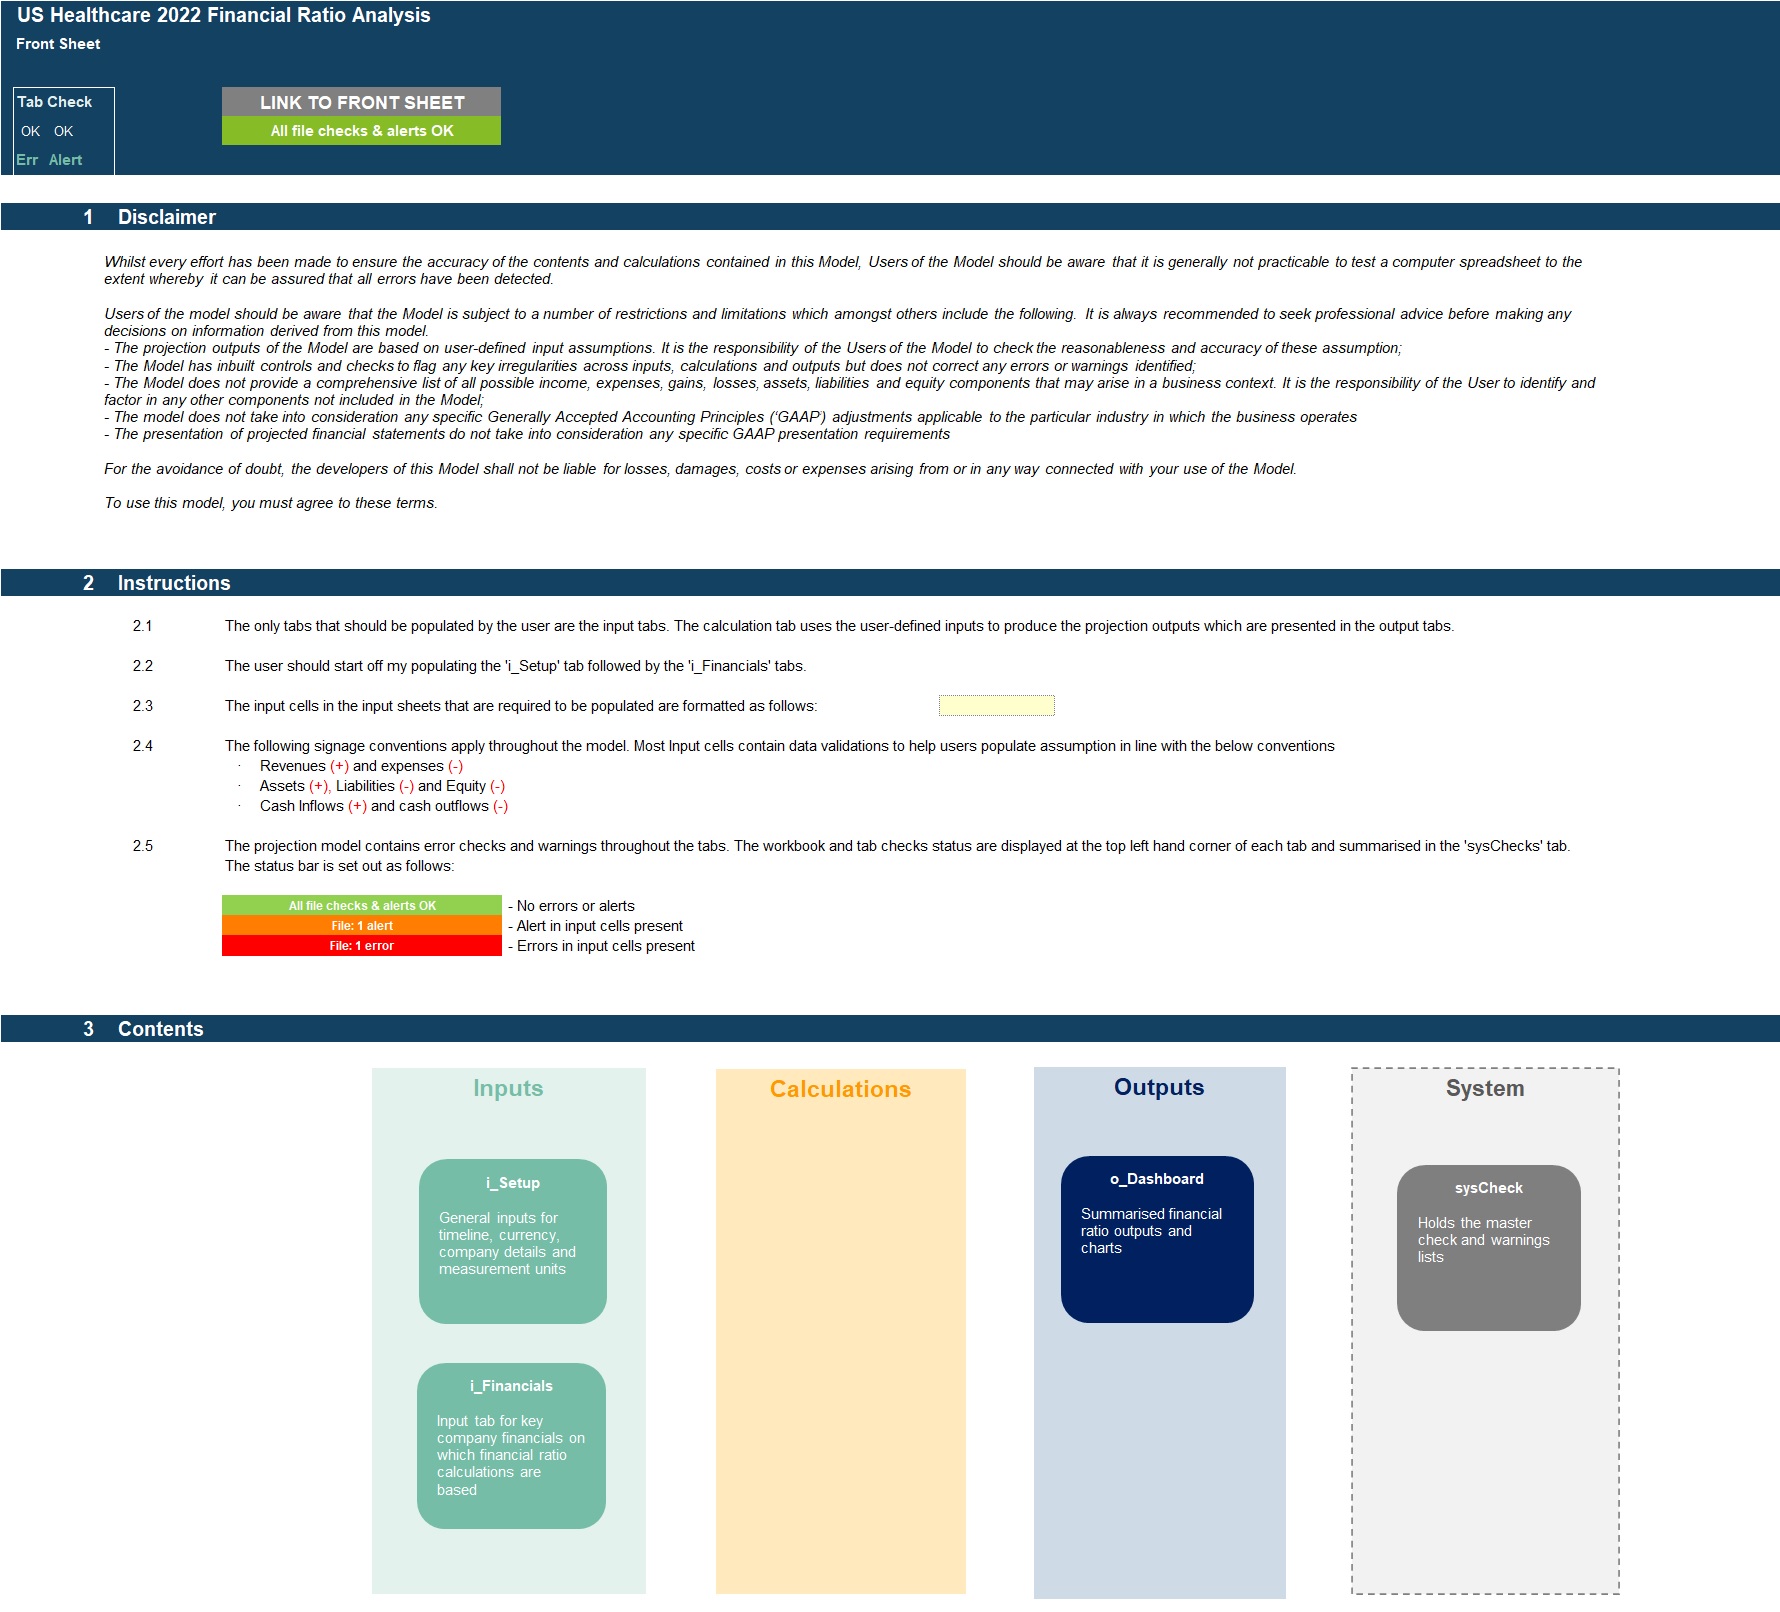
MODEL STRUCTURE
The model comprises of 5 tabs split into input ('i_'), output ('o_’) and system tabs. The tabs to be populated by the user are the input tabs which include ‘i_Setup’ for dashboard setup inputs including companies and timeline and ‘i_financials’, for income statement, balance sheet and cash flow statement inputs for each comparison company. The resulting financial ratio and key metrics outputs are presented in the ‘o_Dashboard’ tab.
System tabs include:
- A 'Front Sheet' containing a disclaimer, instructions and contents;
- A checks dashboard containing a summary of checks by tab.
KEY FEATURES
Other key features of this model include the following:
- The model follows good practice financial modelling guidelines and includes instructions, checks and input validations to help ensure input fields are populated accurately;
- The model includes a 4 year timeline which can be either 4 years of actuals or 3 years actuals and 1 year forecast- The model includes explanations for each financial ratio and description of formula applied
- The list of financial ratios calculated by the model include:
(a) Profitability Ratios - Gross Margin; Operating Margin; Net Profit Margin; Return on Assets; Return on Equity;
(b) Efficiency Ratios - Asset Turnover; Inventory Turnover; Receivables Turnover; Average Inventory Days; Average Debtor Days; Average Creditor Days;
(c) Liquidity Ratios - Current Ratio; Acid-Test Ratio; Cash Ratio; Operating Cash Flow Ratio;
(d) Leverage & Risk Ratios - Debt Ratio; Debt to Equity Ratio; Interest Coverage Ratio; Beaver's Failure Ratio; Altman's Z-Score;
(e) Valuation Ratios - Market Value per Share; Book Value per Share; Market to Book Raio; Earnings Per Share; Price Earnings Ratio.
MODIFICATIONS
If you require any be-spoke modifications to the tool, we are more than happy to assist with this. Please send us a message through the Eloquens site
ABOUT PROJECTIFY
We are a team of financial modelling professionals with experience working in big 4 business modelling teams and strong experience supporting businesses with their financial planning and decision support needs. Our aim is to provide robust and easy-to-use models that follow good practice financial modelling guidelines and assist individuals and businesses with key financial planning and analysis processes.
We are keen to make sure our customers are satisfied with the tools / models they purchase and will be more than happy to assist with any questions or support required following or in advance of purchase.
We are also always keen to receive feedback so please do let us know any feedback you have on our models by sending us a message or submitting a review.
PURPOSE OF TOOL
User-friendly financial model to compute and compare the financial ratios of up to 5 companies and across 4 years in an intuitive dashboard containing output tables and charts.
The model calculates 25 financial ratios spit across profitability, liquidity, efficiency, leverage/risk and valuation ratios using income statement, balance sheet and cash flow statement inputs for each of the timeline years and comparison companies.
The model follows good practice financial modelling principles and includes instructions, checks and input validations.
KEY OUTPUTS
The key outputs include:
- Key financial metrics for each comparison company
- 25 Financial ratios by year and by company split into profitability ratios, efficiency ratios, liquidity ratios, leverage/risk ratios and valuation ratios.
- Charts presenting the financial ratios
KEY INPUTS
Inputs are split into Setup inputs, and financials inputs:
Setup Inputs:
- Name of financial ratio exercise;
- Date of financial ratio exercise;
- Currency;
- Latest financial period and whether timeline includes a forecast year;
- Units for financial inputs (eg thousands or millions or nil)
- Name of comparative companies
Financials Inputs:
- Income statement, balance sheet and cash flow inputs for past 3 or 4 years and forecast year if applicable;
- Latest market capitalisation if available;
- Latest price per share if available.
MODEL STRUCTURE
The model comprises of 5 tabs split into input ('i_'), output ('o_’) and system tabs. The tabs to be populated by the user are the input tabs which include ‘i_Setup’ for dashboard setup inputs including companies and timeline and ‘i_financials’, for income statement, balance sheet and cash flow statement inputs for each comparison company. The resulting financial ratio and key metrics outputs are presented in the ‘o_Dashboard’ tab.
System tabs include:
- A 'Front Sheet' containing a disclaimer, instructions and contents;
- A checks dashboard containing a summary of checks by tab.
KEY FEATURES
Other key features of this model include the following:
- The model follows good practice financial modelling guidelines and includes instructions, checks and input validations to help ensure input fields are populated accurately;
- The model includes a 4 year timeline which can be either 4 years of actuals or 3 years actuals and 1 year forecast- The model includes explanations for each financial ratio and description of formula applied
- The list of financial ratios calculated by the model include:
(a) Profitability Ratios - Gross Margin; Operating Margin; Net Profit Margin; Return on Assets; Return on Equity;
(b) Efficiency Ratios - Asset Turnover; Inventory Turnover; Receivables Turnover; Average Inventory Days; Average Debtor Days; Average Creditor Days;
(c) Liquidity Ratios - Current Ratio; Acid-Test Ratio; Cash Ratio; Operating Cash Flow Ratio;
(d) Leverage & Risk Ratios - Debt Ratio; Debt to Equity Ratio; Interest Coverage Ratio; Beaver's Failure Ratio; Altman's Z-Score;
(e) Valuation Ratios - Market Value per Share; Book Value per Share; Market to Book Raio; Earnings Per Share; Price Earnings Ratio.
MODIFICATIONS
If you require any be-spoke modifications to the tool, we are more than happy to assist with this. Please send us a message through the Eloquens site
ABOUT PROJECTIFY
We are a team of financial modelling professionals with experience working in big 4 business modelling teams and strong experience supporting businesses with their financial planning and decision support needs. Our aim is to provide robust and easy-to-use models that follow good practice financial modelling guidelines and assist individuals and businesses with key financial planning and analysis processes.
We are keen to make sure our customers are satisfied with the tools / models they purchase and will be more than happy to assist with any questions or support required following or in advance of purchase.
We are also always keen to receive feedback so please do let us know any feedback you have on our models by sending us a message or submitting a review.
This Best Practice includes
2 Excel Models (populated and not populated)
Further information
Compute and compare financial ratios (profitability, efficiency, liquidity, leverage and valuation) across 4 years and up to 5 companies
