
Last version published: 05/05/2020 12:21
Publication number: ELQ-51464-4
View all versions & Certificate

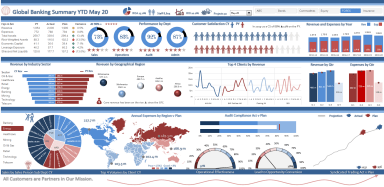
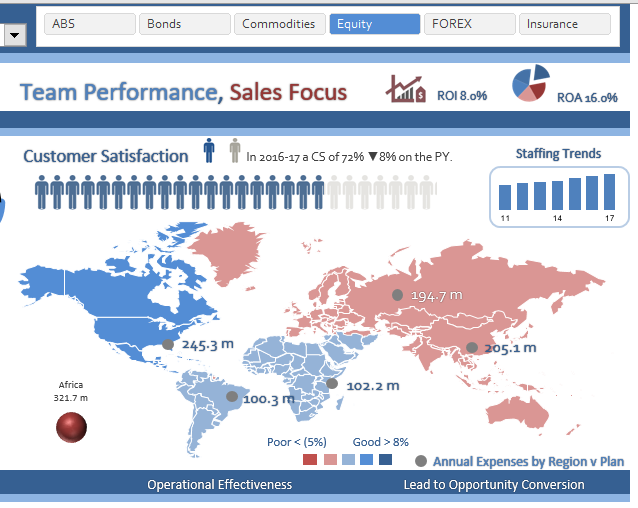
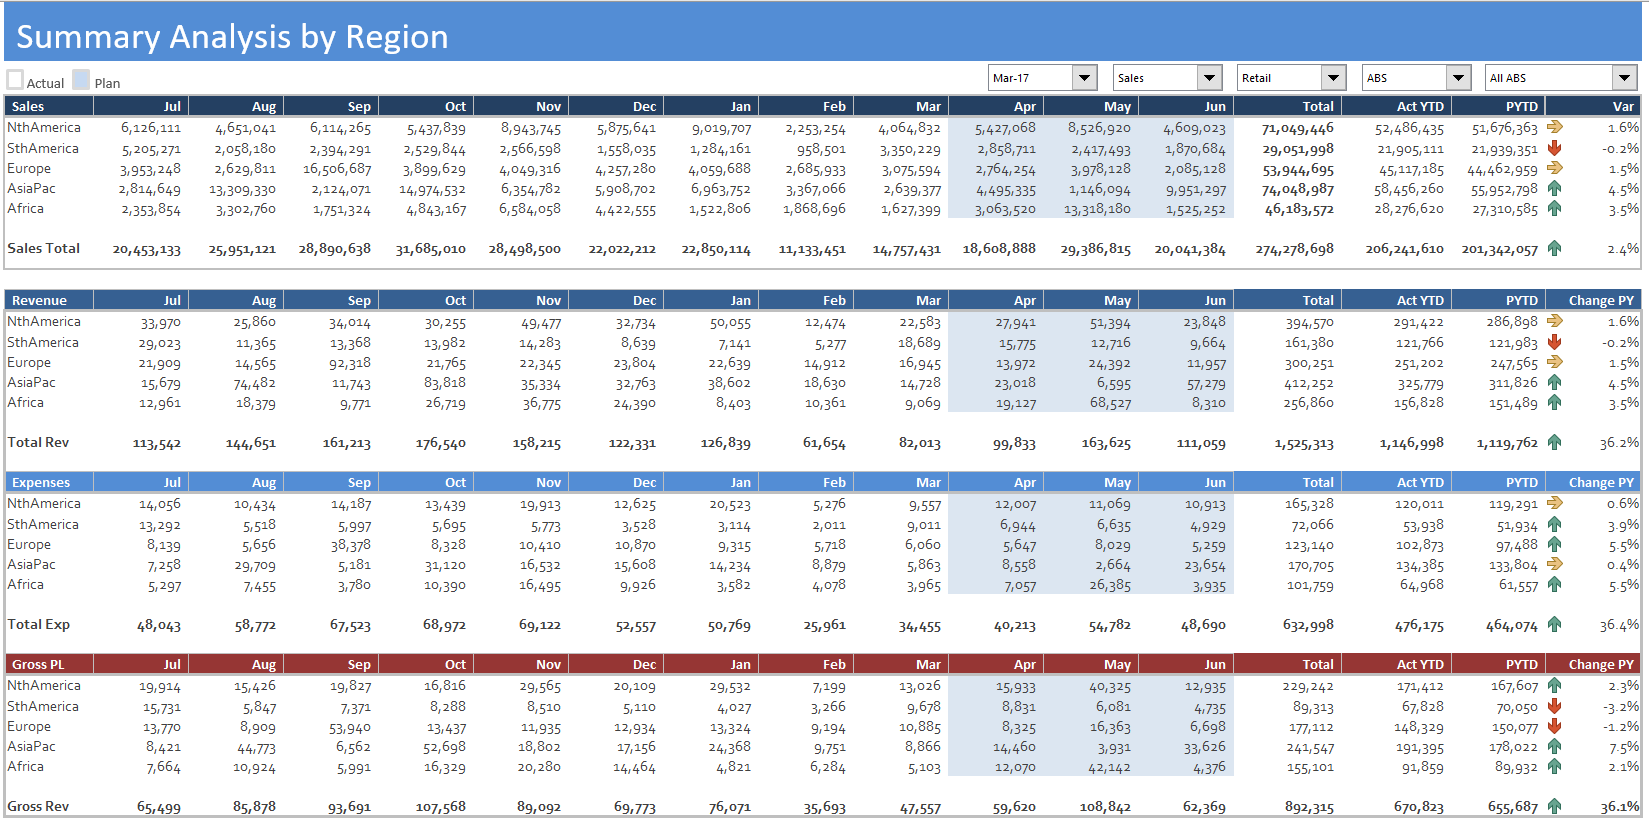
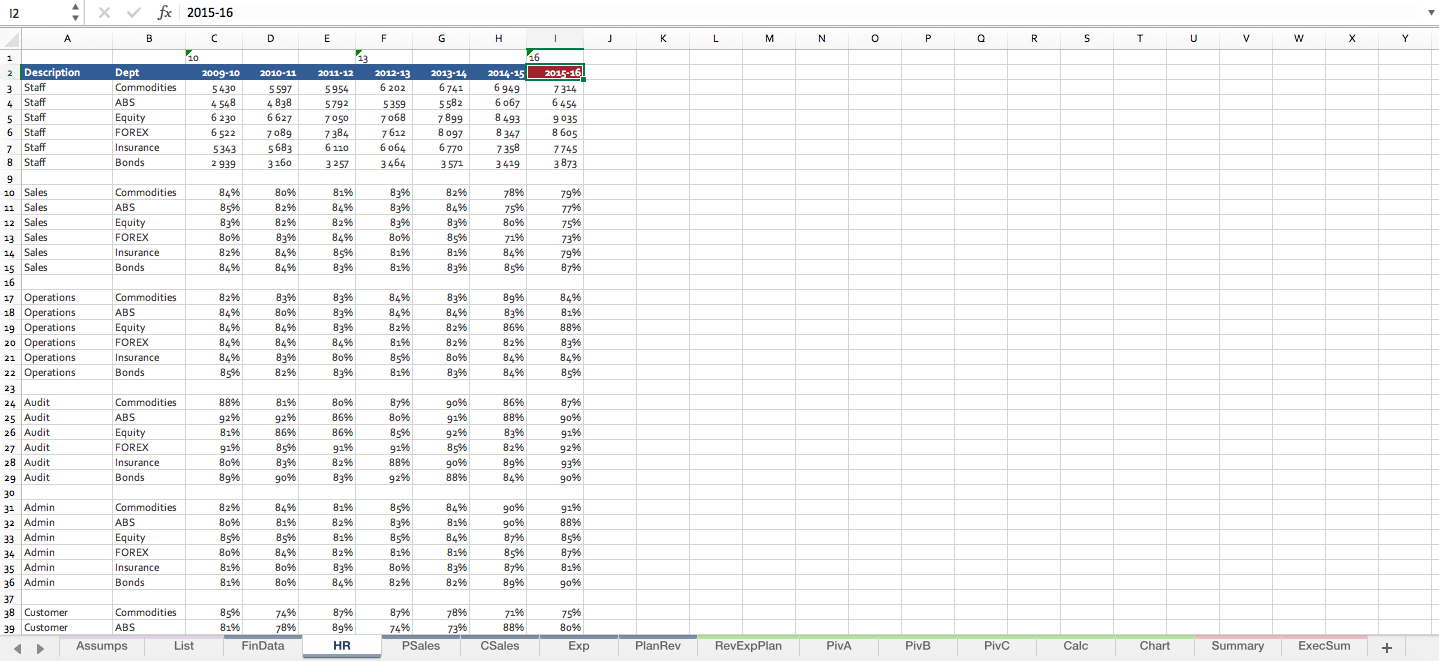
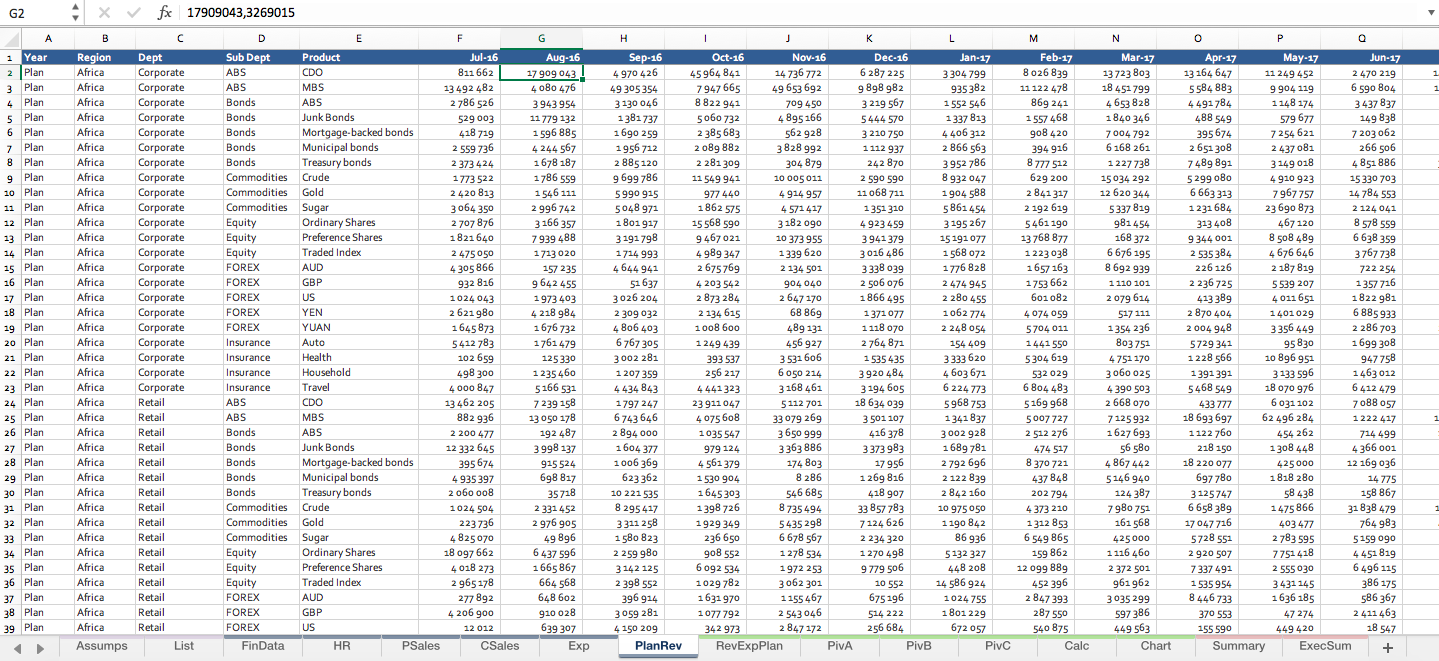
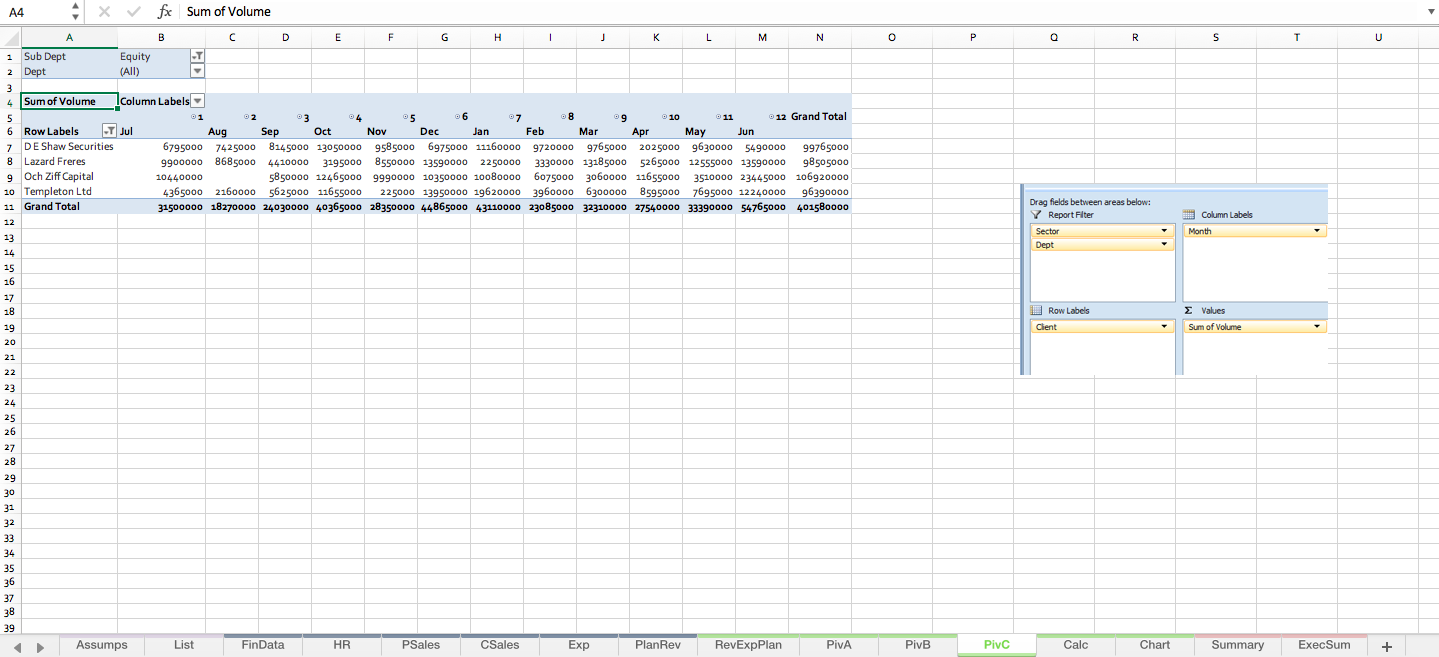
Company KPI Dashboard Model - by Department
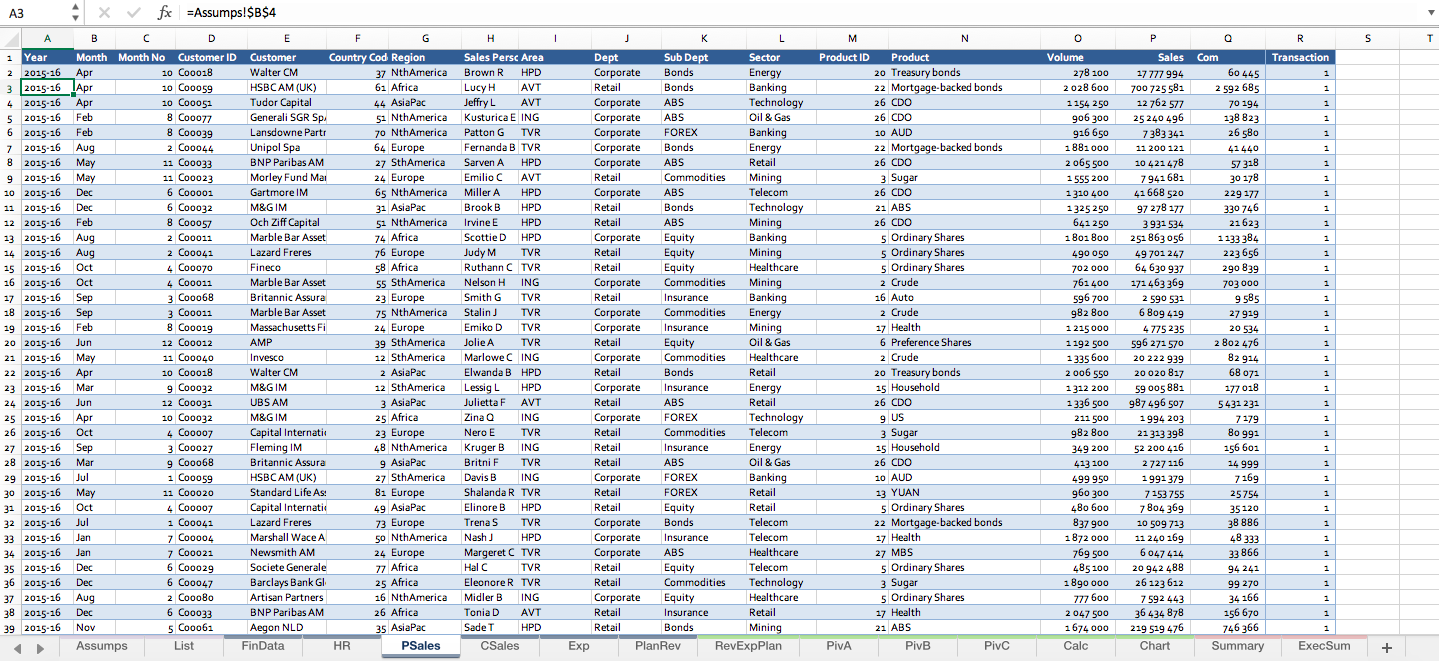
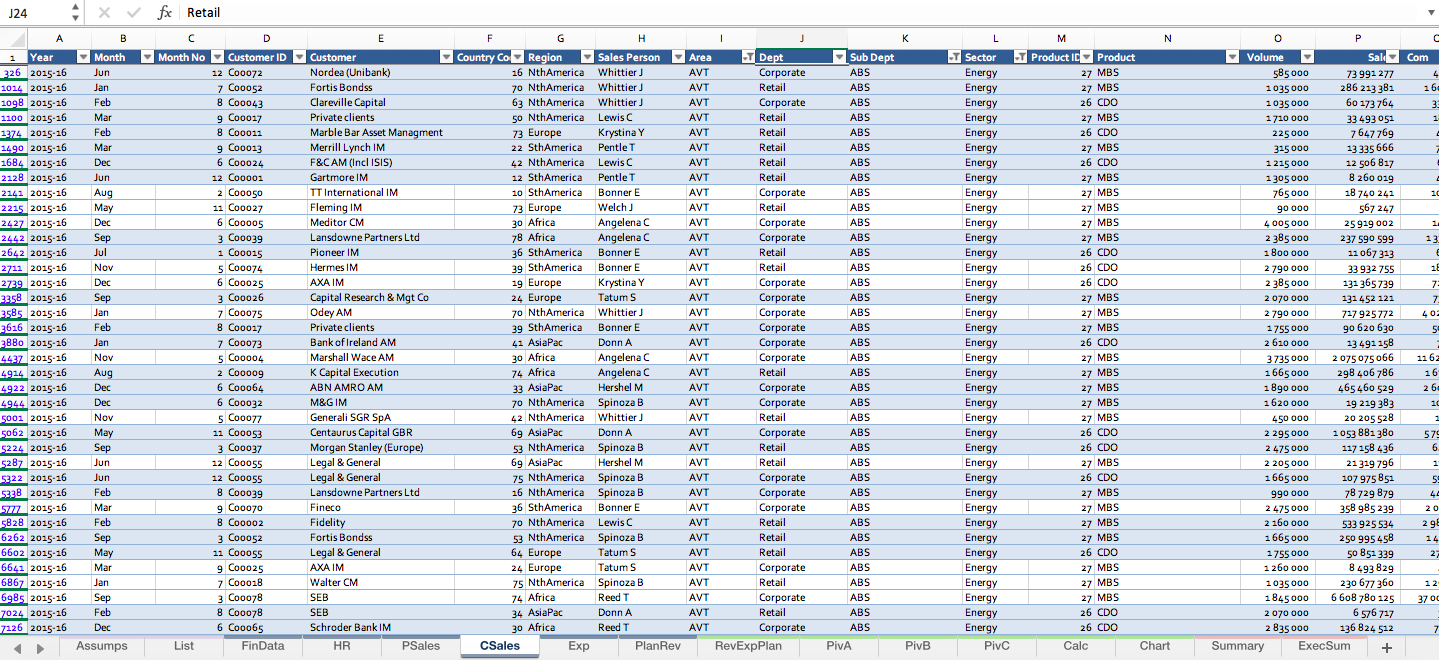
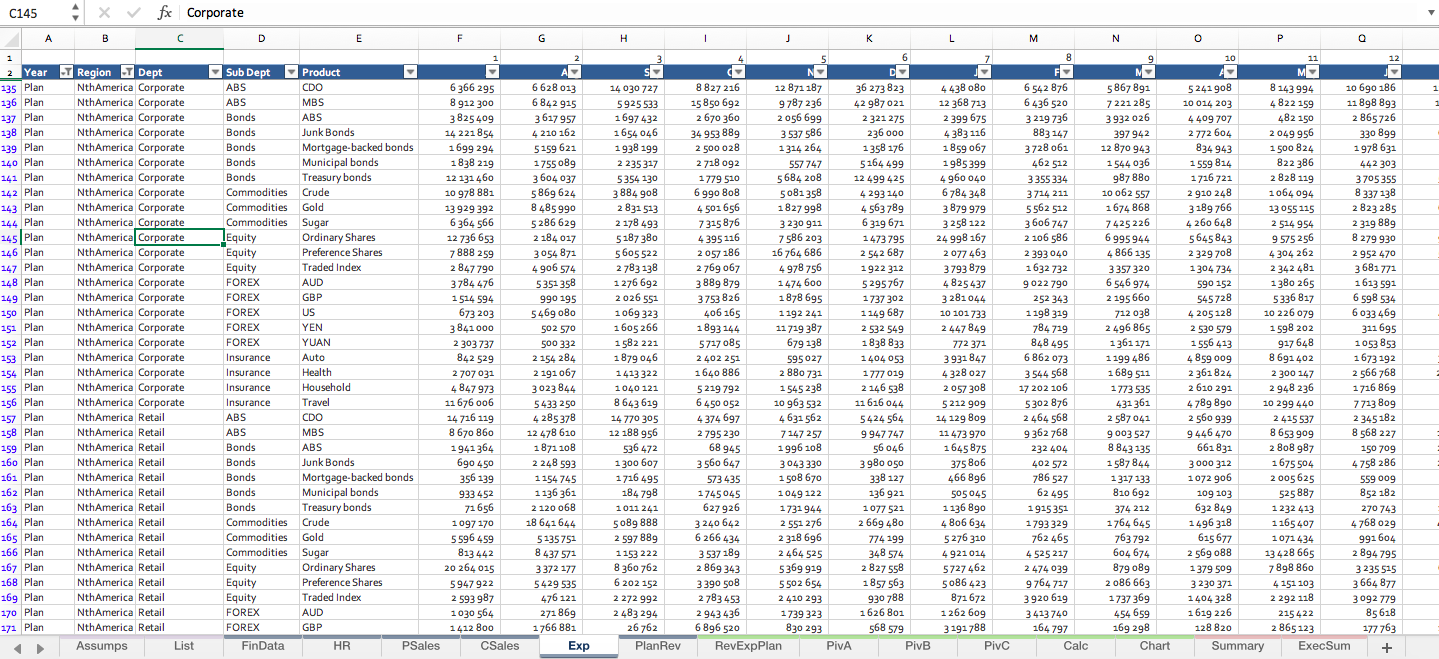
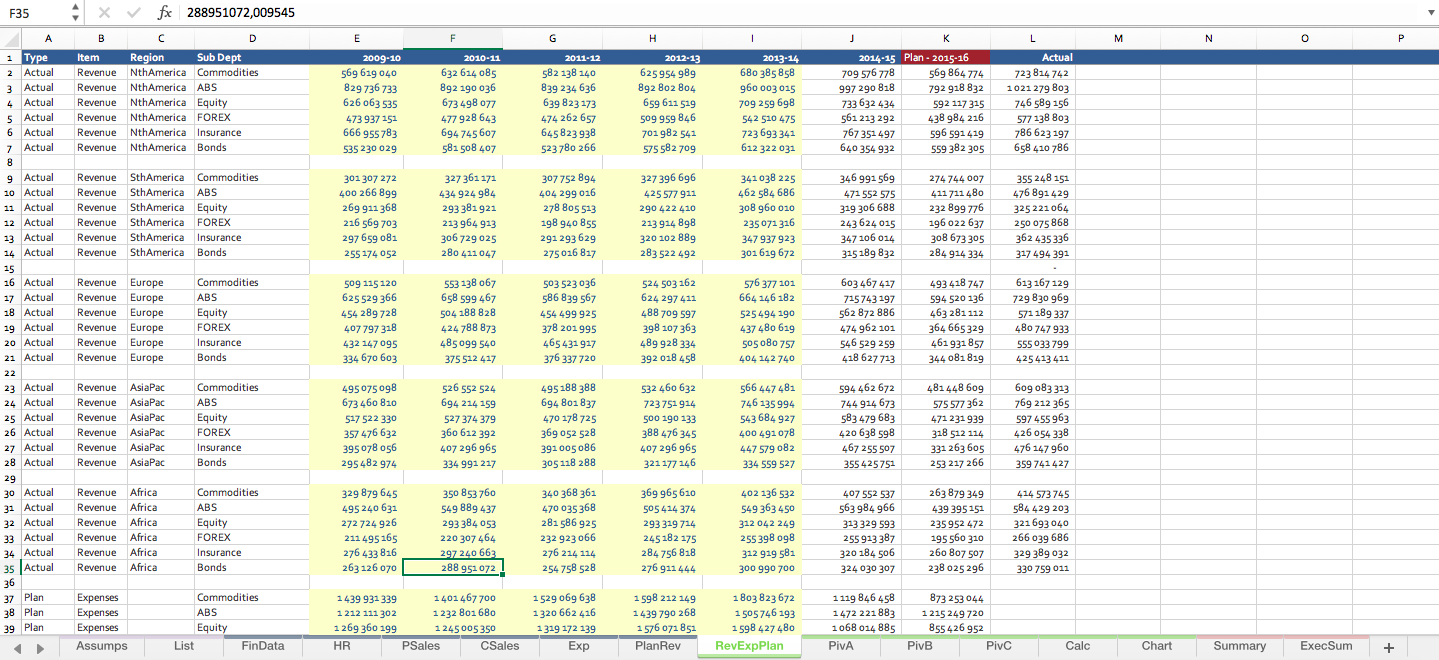
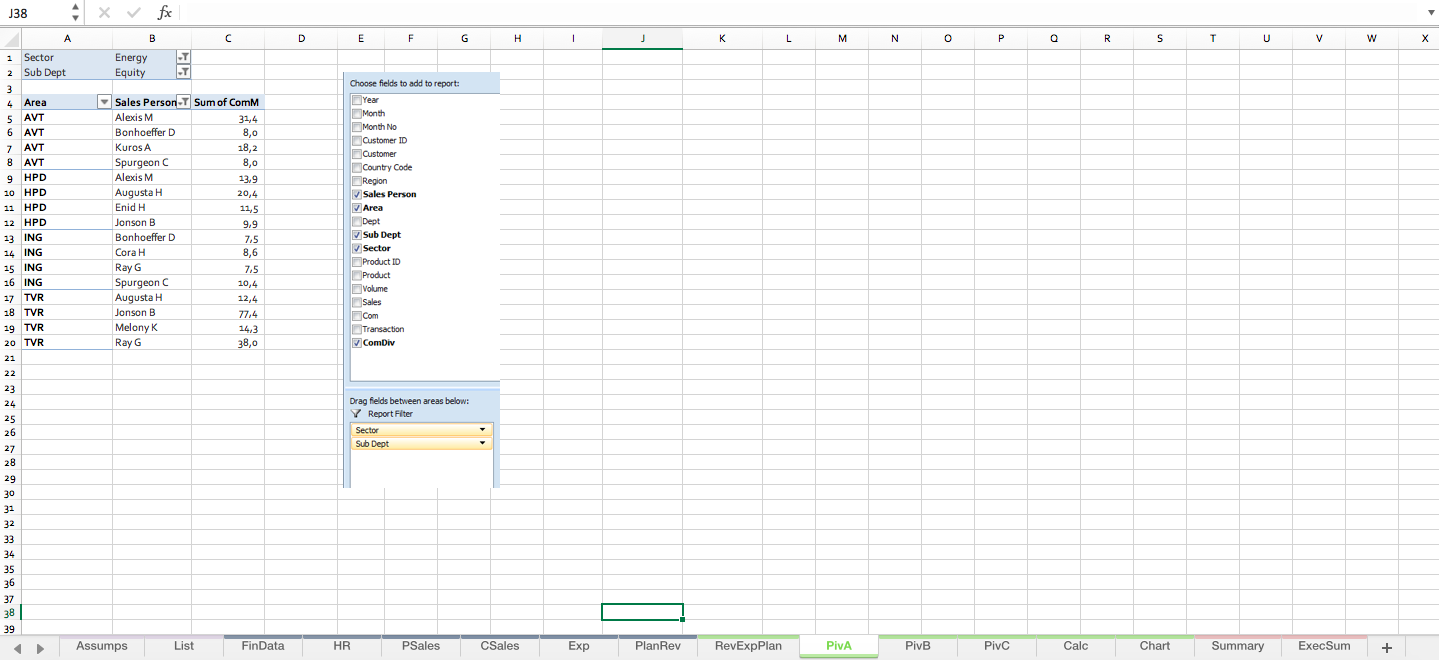
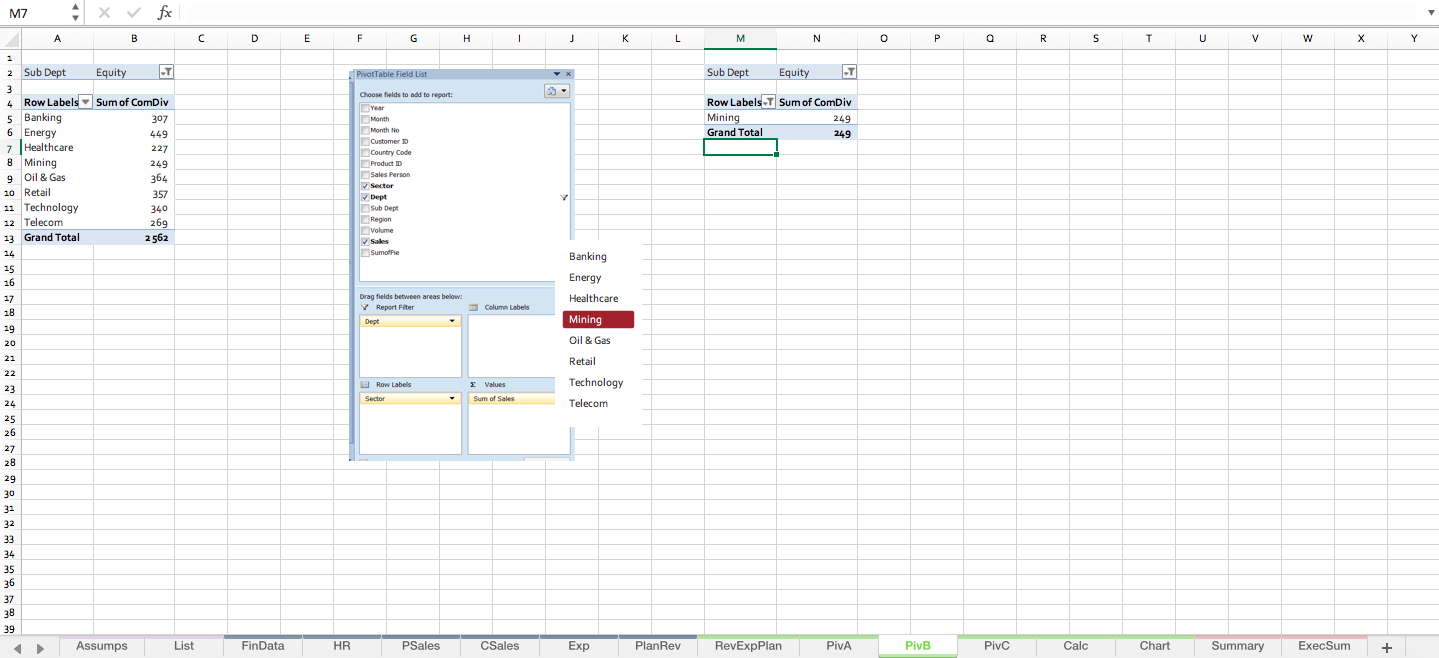
This KPI dashboard summarises financial data by department and allows drill through on multiple levels.
Further information
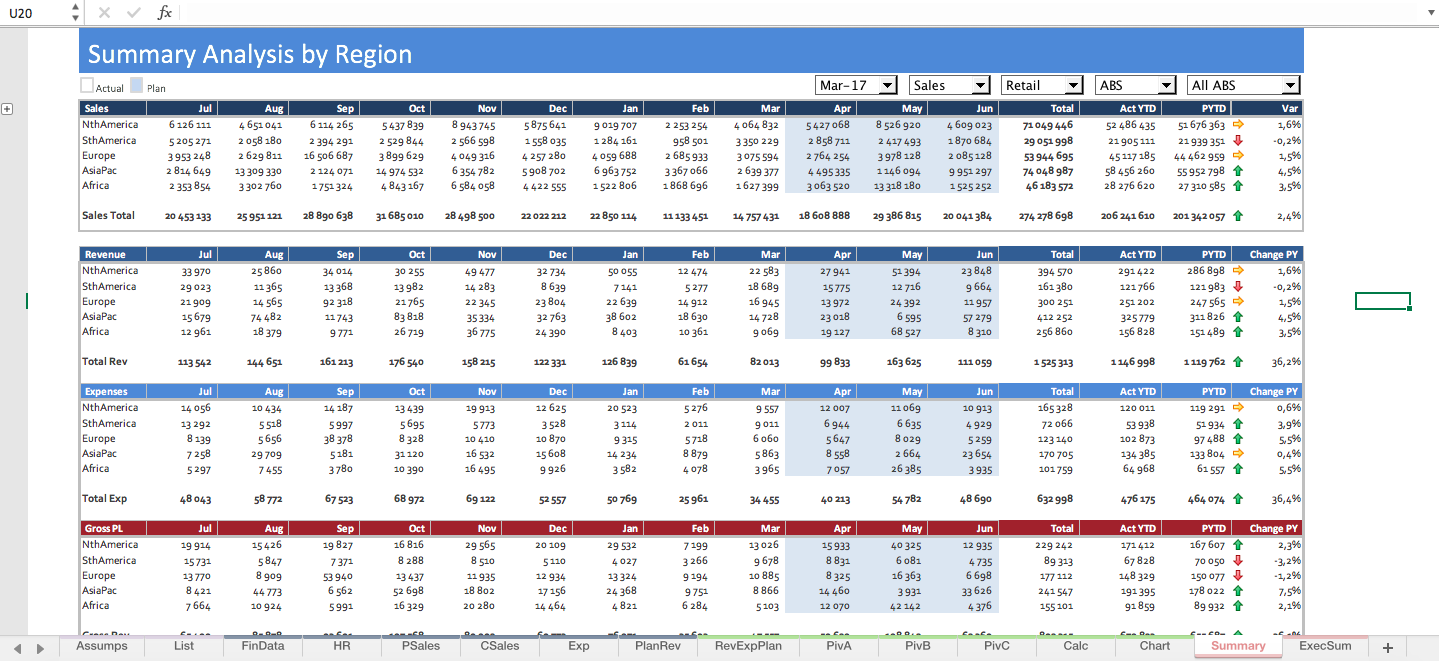
The tool is designed to provide as succinct summary for actual v plan v prior year data in a single page KPI dashboard.
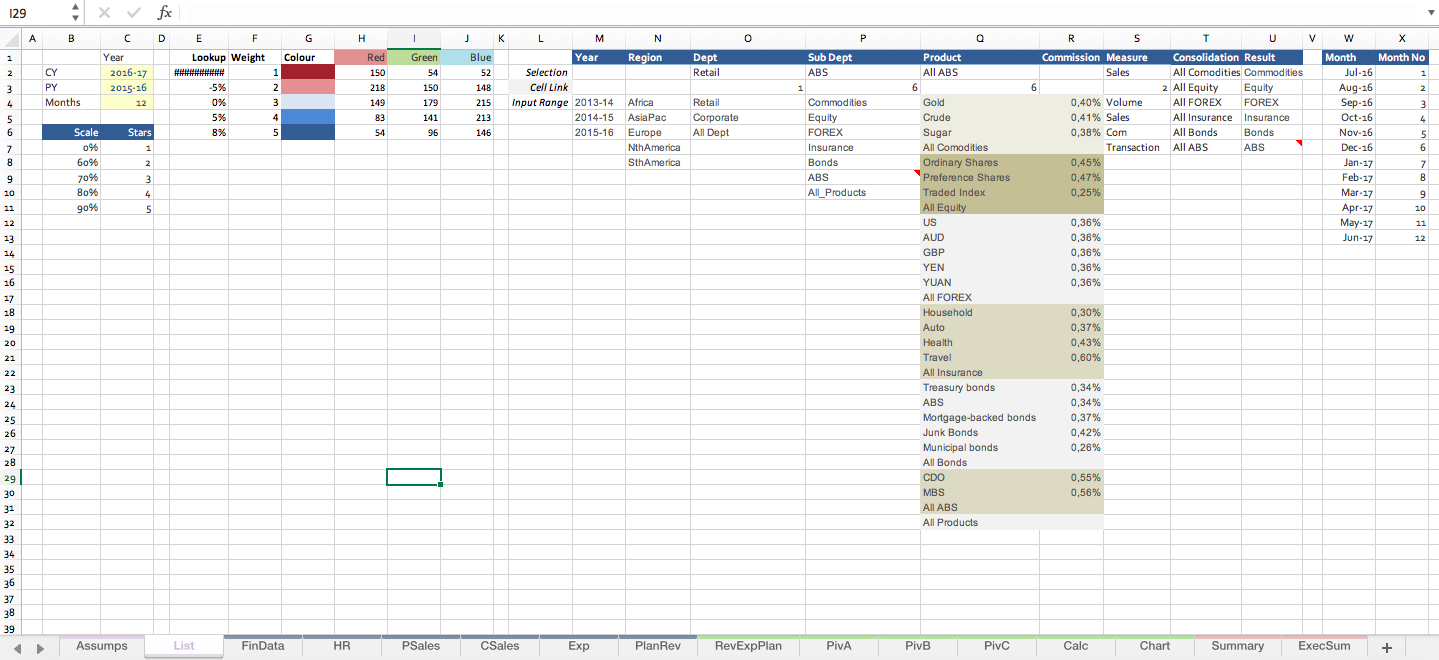
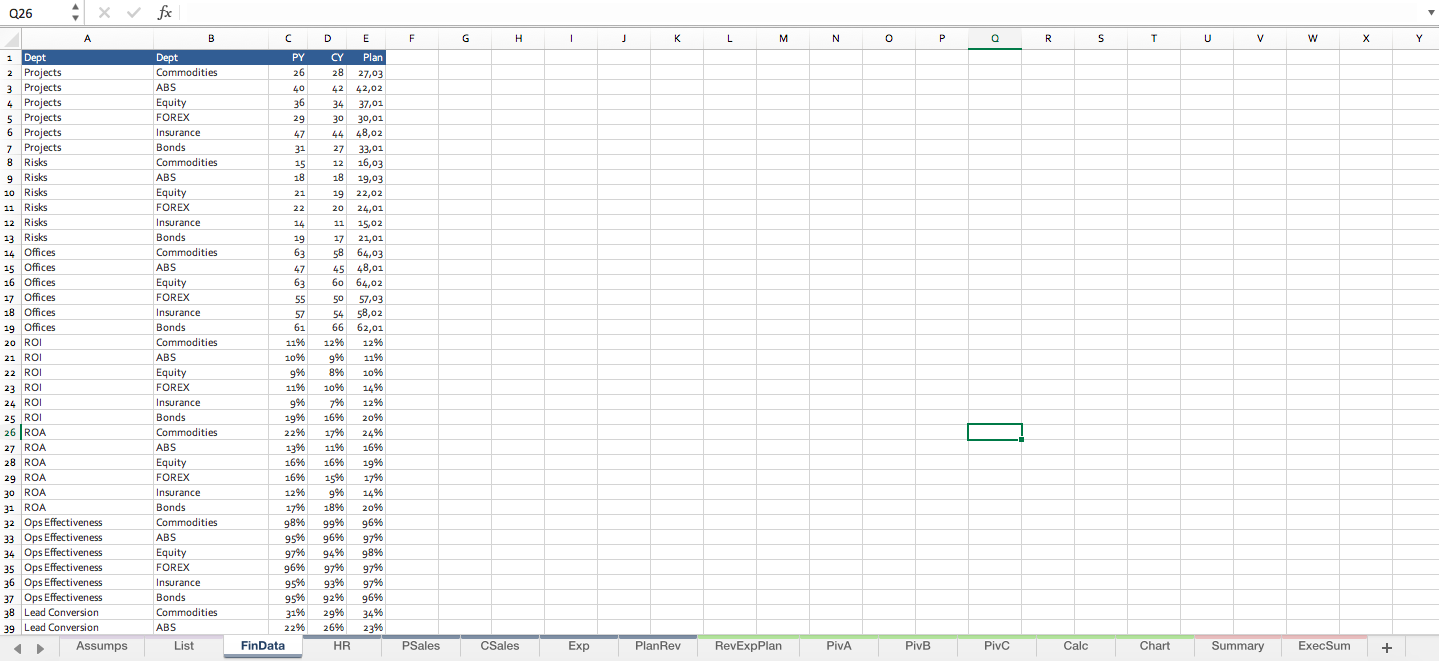
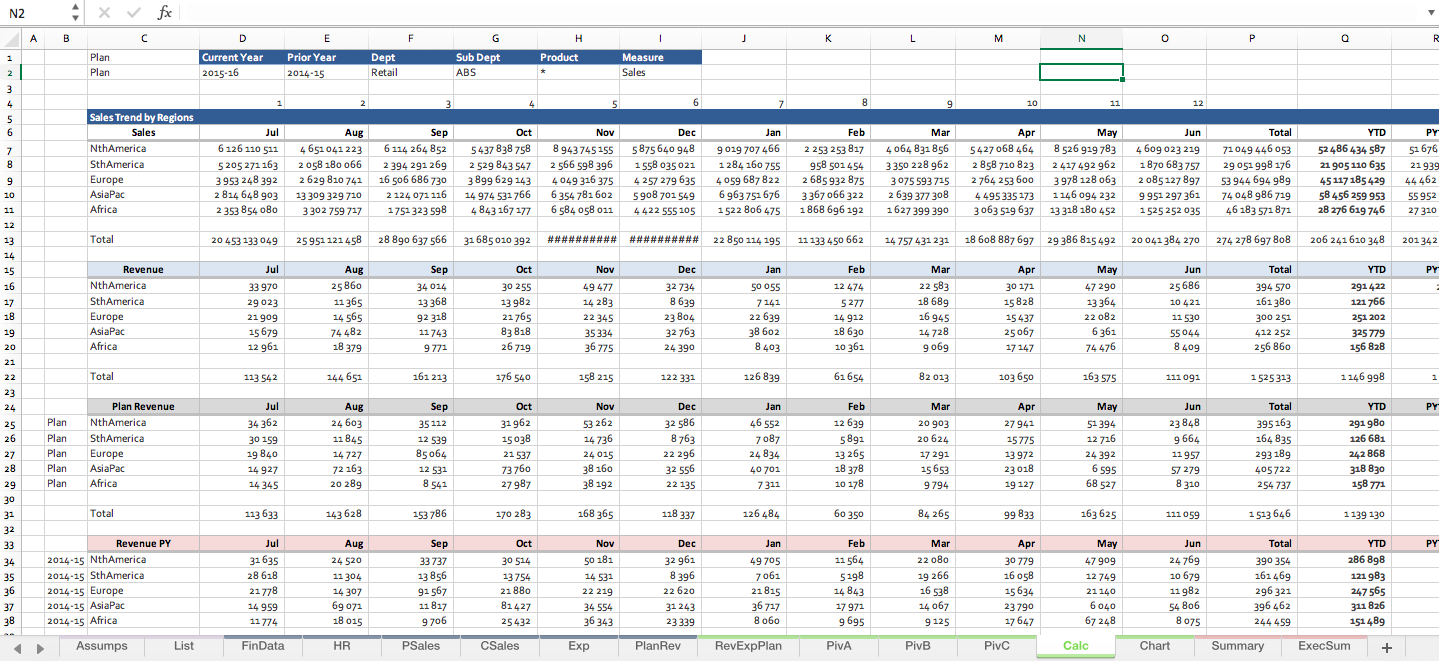
Organisations or individuals who wish to incorporate a range of financial, operational and human resource data will get the most from this tool.
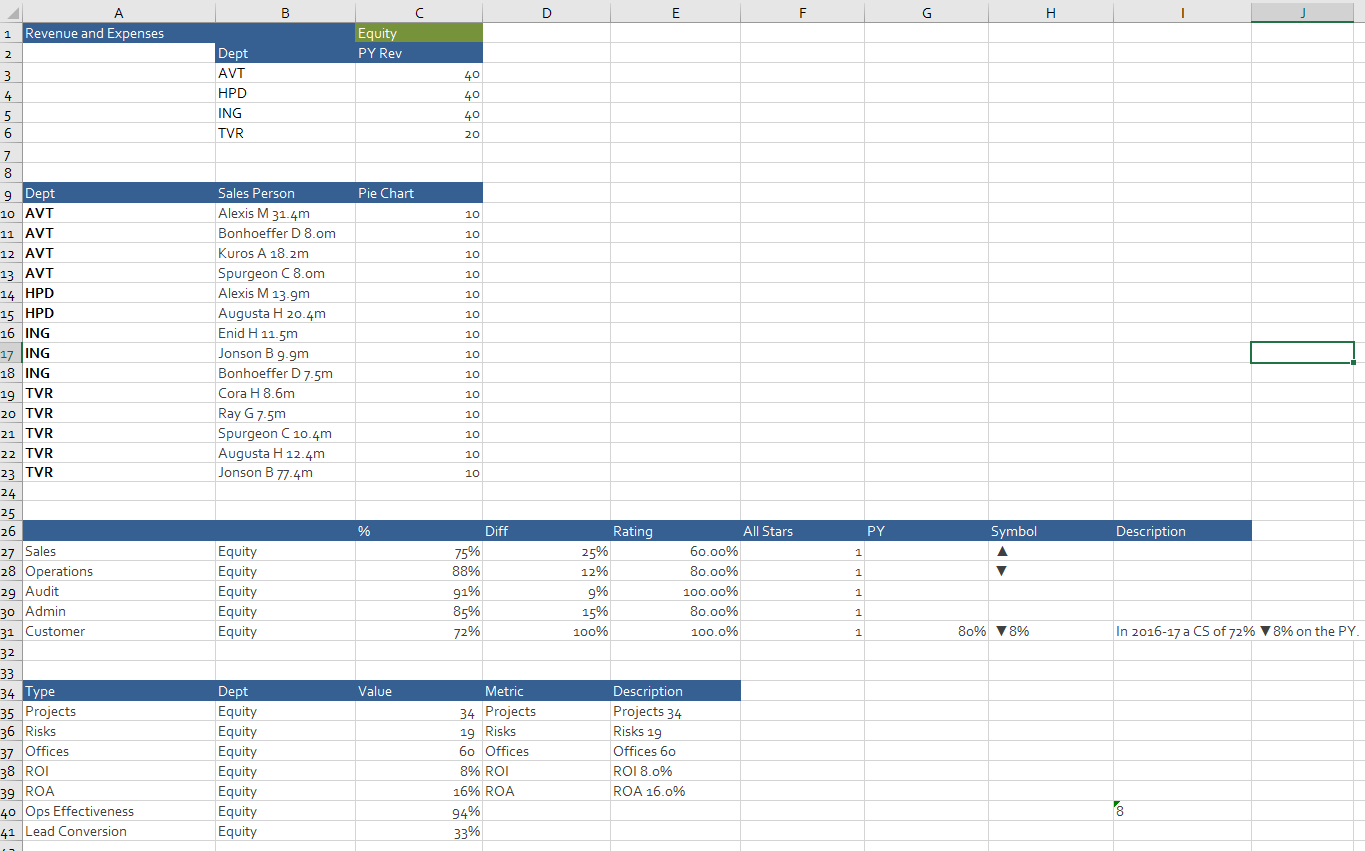
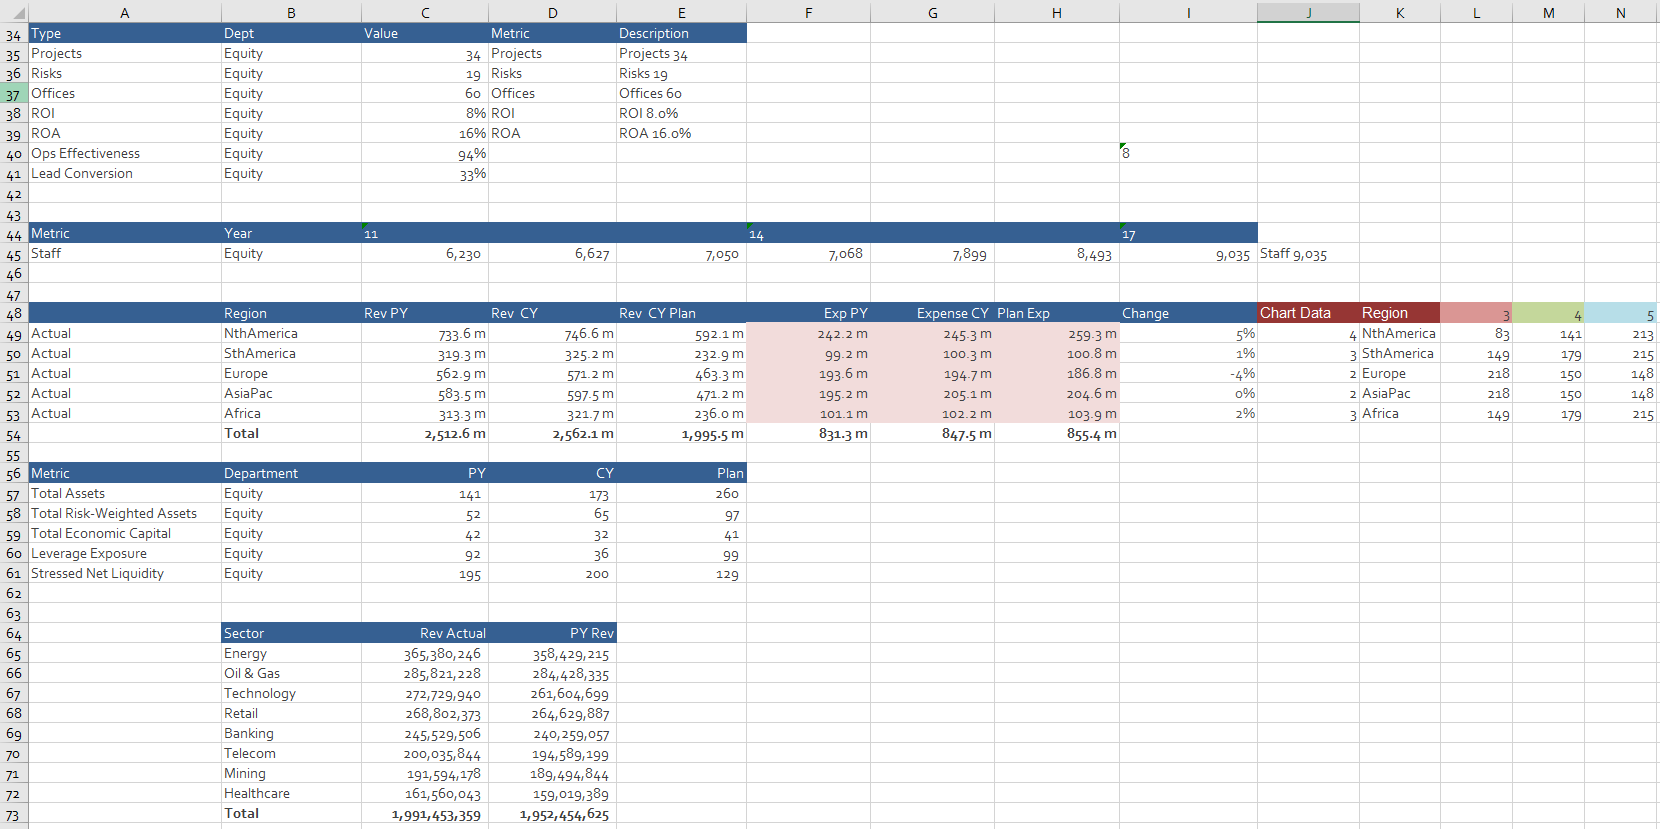
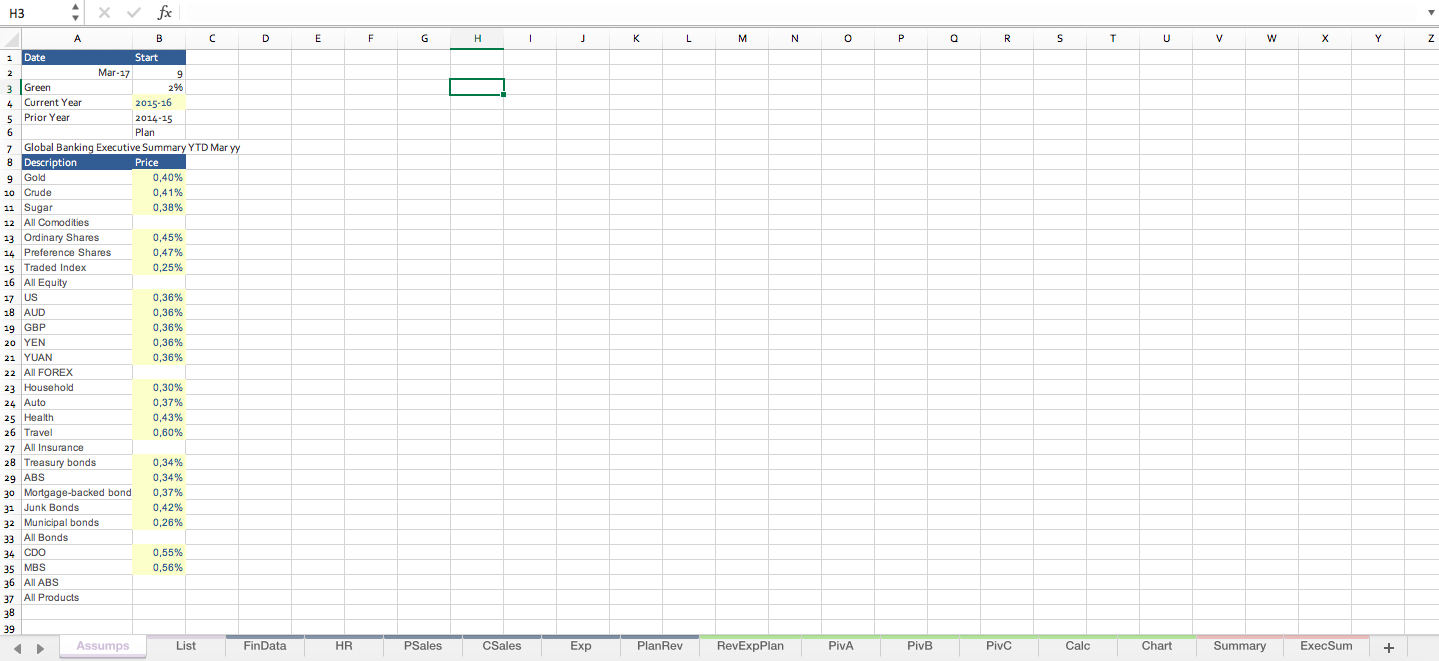
The file is professionally formatted to easily cut and paste key data into this workbook and have the data flow through to the calculations pages.
Reviews
Write a review
- I love them all!Keep them coming, Marcus! I love them all!
People using this Best Practice also downloaded
More Best Practices from Marcus Small
Dashboard Design in Excel - The Complete Course
The complete, comprehensive course for dashboard design in Excel.10,0725add_shopping_cart$299.00by Marcus Small
Excel Finance Administration Dashboard
The dashboard displays an incredible range of data in a succinct, clear, pliable easy to update summary.12,4591add_shopping_cart$35.00by Marcus Small
The Ultimate Business KPI Dashboard Bundle
This exemplary financial dashboard bundle includes 9 top-tier business dashboards, ready-to-use, for your organisation.4,197Discussadd_shopping_cart$300.00by Marcus Small
Key Financial Metrics Report Excel Model
The workbook compares a range of metrics by region. It is simple to update and presents data clear concise way.9,5391add_shopping_cart$99.00by Marcus Small
Sales KPI Dashboard Report
This report summaries a range of financial and non financial data in a succinct 1 page summary which is highly pliable.6,5861add_shopping_cart$99.00by Marcus Small
Excel Financial Modelling Course
Financial modelling using different scenarios to create robust structure, report setup, to create Excel magic.8991add_shopping_cart$300.00by Marcus Small
Balanced Scorecard Dashboard Excel Model
This is a balanced scorecard summary report, presented in a succinct clear format which is ready to use.4,297Discussadd_shopping_cart$149.00by Marcus Small
KPI Excel Dashboard Model
This financial KPI dashboard displays a range of organisational metrics (actual v plan) in a clear succinct summary.5,423Discussadd_shopping_cart$99.00by Marcus Small
Advanced Dashboard Design Course
The complete advanced Dashboard Design Course for Excel. Learn how to create 5 types of corporate dashboards.1,1171add_shopping_cart$349.00by Marcus Small
Data Trends by Month Dashboard Excel
This dashboard shows a range of operational, financial and HR information with comparison, trend and variance to plan.4,1923add_shopping_cart$99.00by Marcus Small
Premium Dashboard Models (the very best)
These premium Excel dashboards are ready to use. Create stunning visuals by adding your own data. That simple.9,8671add_shopping_cart$399.00by Marcus Small
Client Corporate Excel Dashboard
A neat corporate summary report which can be easily adapted to incorporate financial and non financial data.3,804Discussadd_shopping_cart$99.00by Marcus Small
Any questions on Company KPI Dashboard Model - By Department?
The user community and author are here to help. Go ahead!