Originally published: 04/03/2024 07:50
Publication number: ELQ-66224-1
View all versions & Certificate
Publication number: ELQ-66224-1
View all versions & Certificate

Actual vs. Budget Variance Analysis Template
Excel model and dashboard for the preparation of a monthly budget and to track actual performance against budget and prior year
financial managementbudgetactualdashboardfinancial modelexcel templateprior yearvariance analysisperformance managementbudgeting
Description
PURPOSE OF MODEL
Actual vs. budget variance analysis is a financial management process that involves comparing the actual financial results of a business with the budgeted or planned figures helping businesses understand the differences between what was expected and what actually occurred. This enables businesses to identify areas of success or concern and to make informed decisions.
Our highly versatile and user-friendly Excel template has a dual purpose:
(1) It allows for the preparation of a monthly budget based on latest actuals combined with assumptions for the projection/budget period;
(2) It allows the user to track actual performance against budget and prior year on a monthly and year to date basis with results presented in a dashboard format with a mix of charts and tables.
The model is not industry specific and includes 10 revenue streams (which can be any mix of products or services), related costs of sales, inventory (if applicable) and direct expenses. Apart from revenue and direct costs, the model allows the user to model staff costs, marketing costs, other operating costs, fixed assets, borrowings, sales tax, corporate tax and dividend distributions.
The model follows good practice financial modelling principles and includes instructions, line item explanations, checks and input validations and incorporates a cash flow statement calculation for actuals.
KEY OUTPUTS
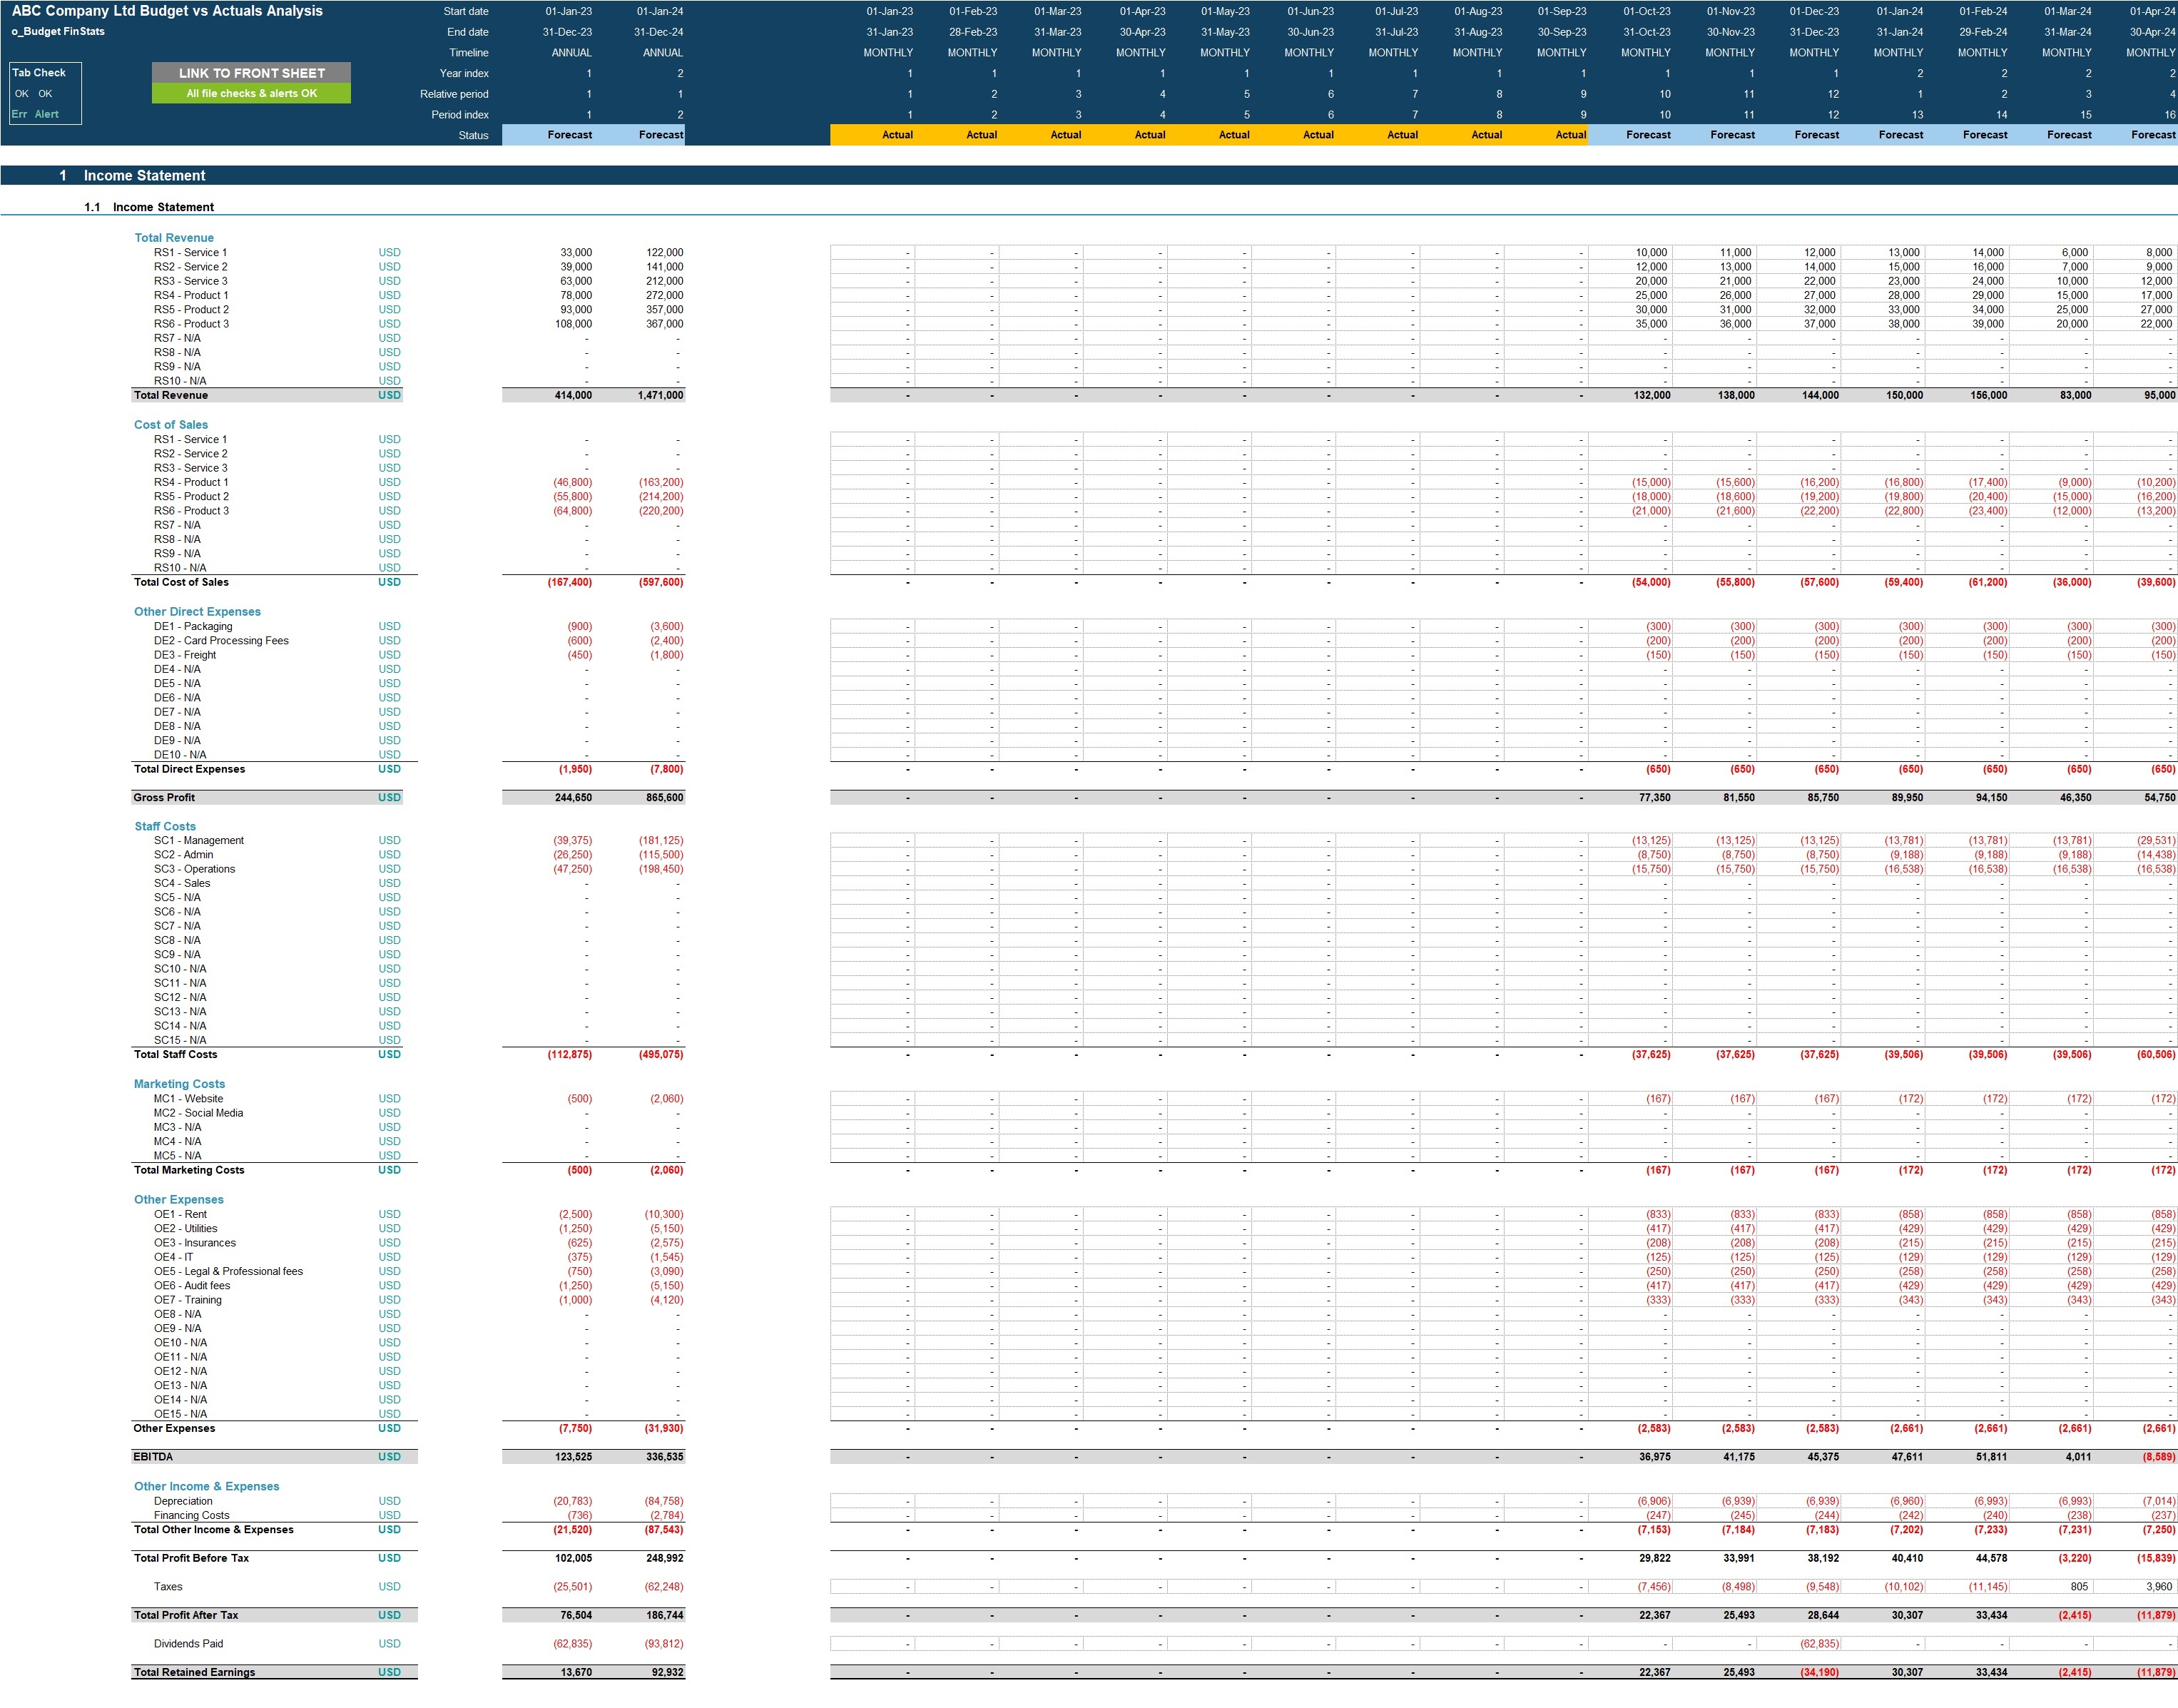
- Budgeted full financial statements (Income Statement, Balance Sheet and Cash flow Statement) presented on a monthly basis across and summarised on an annual basis.
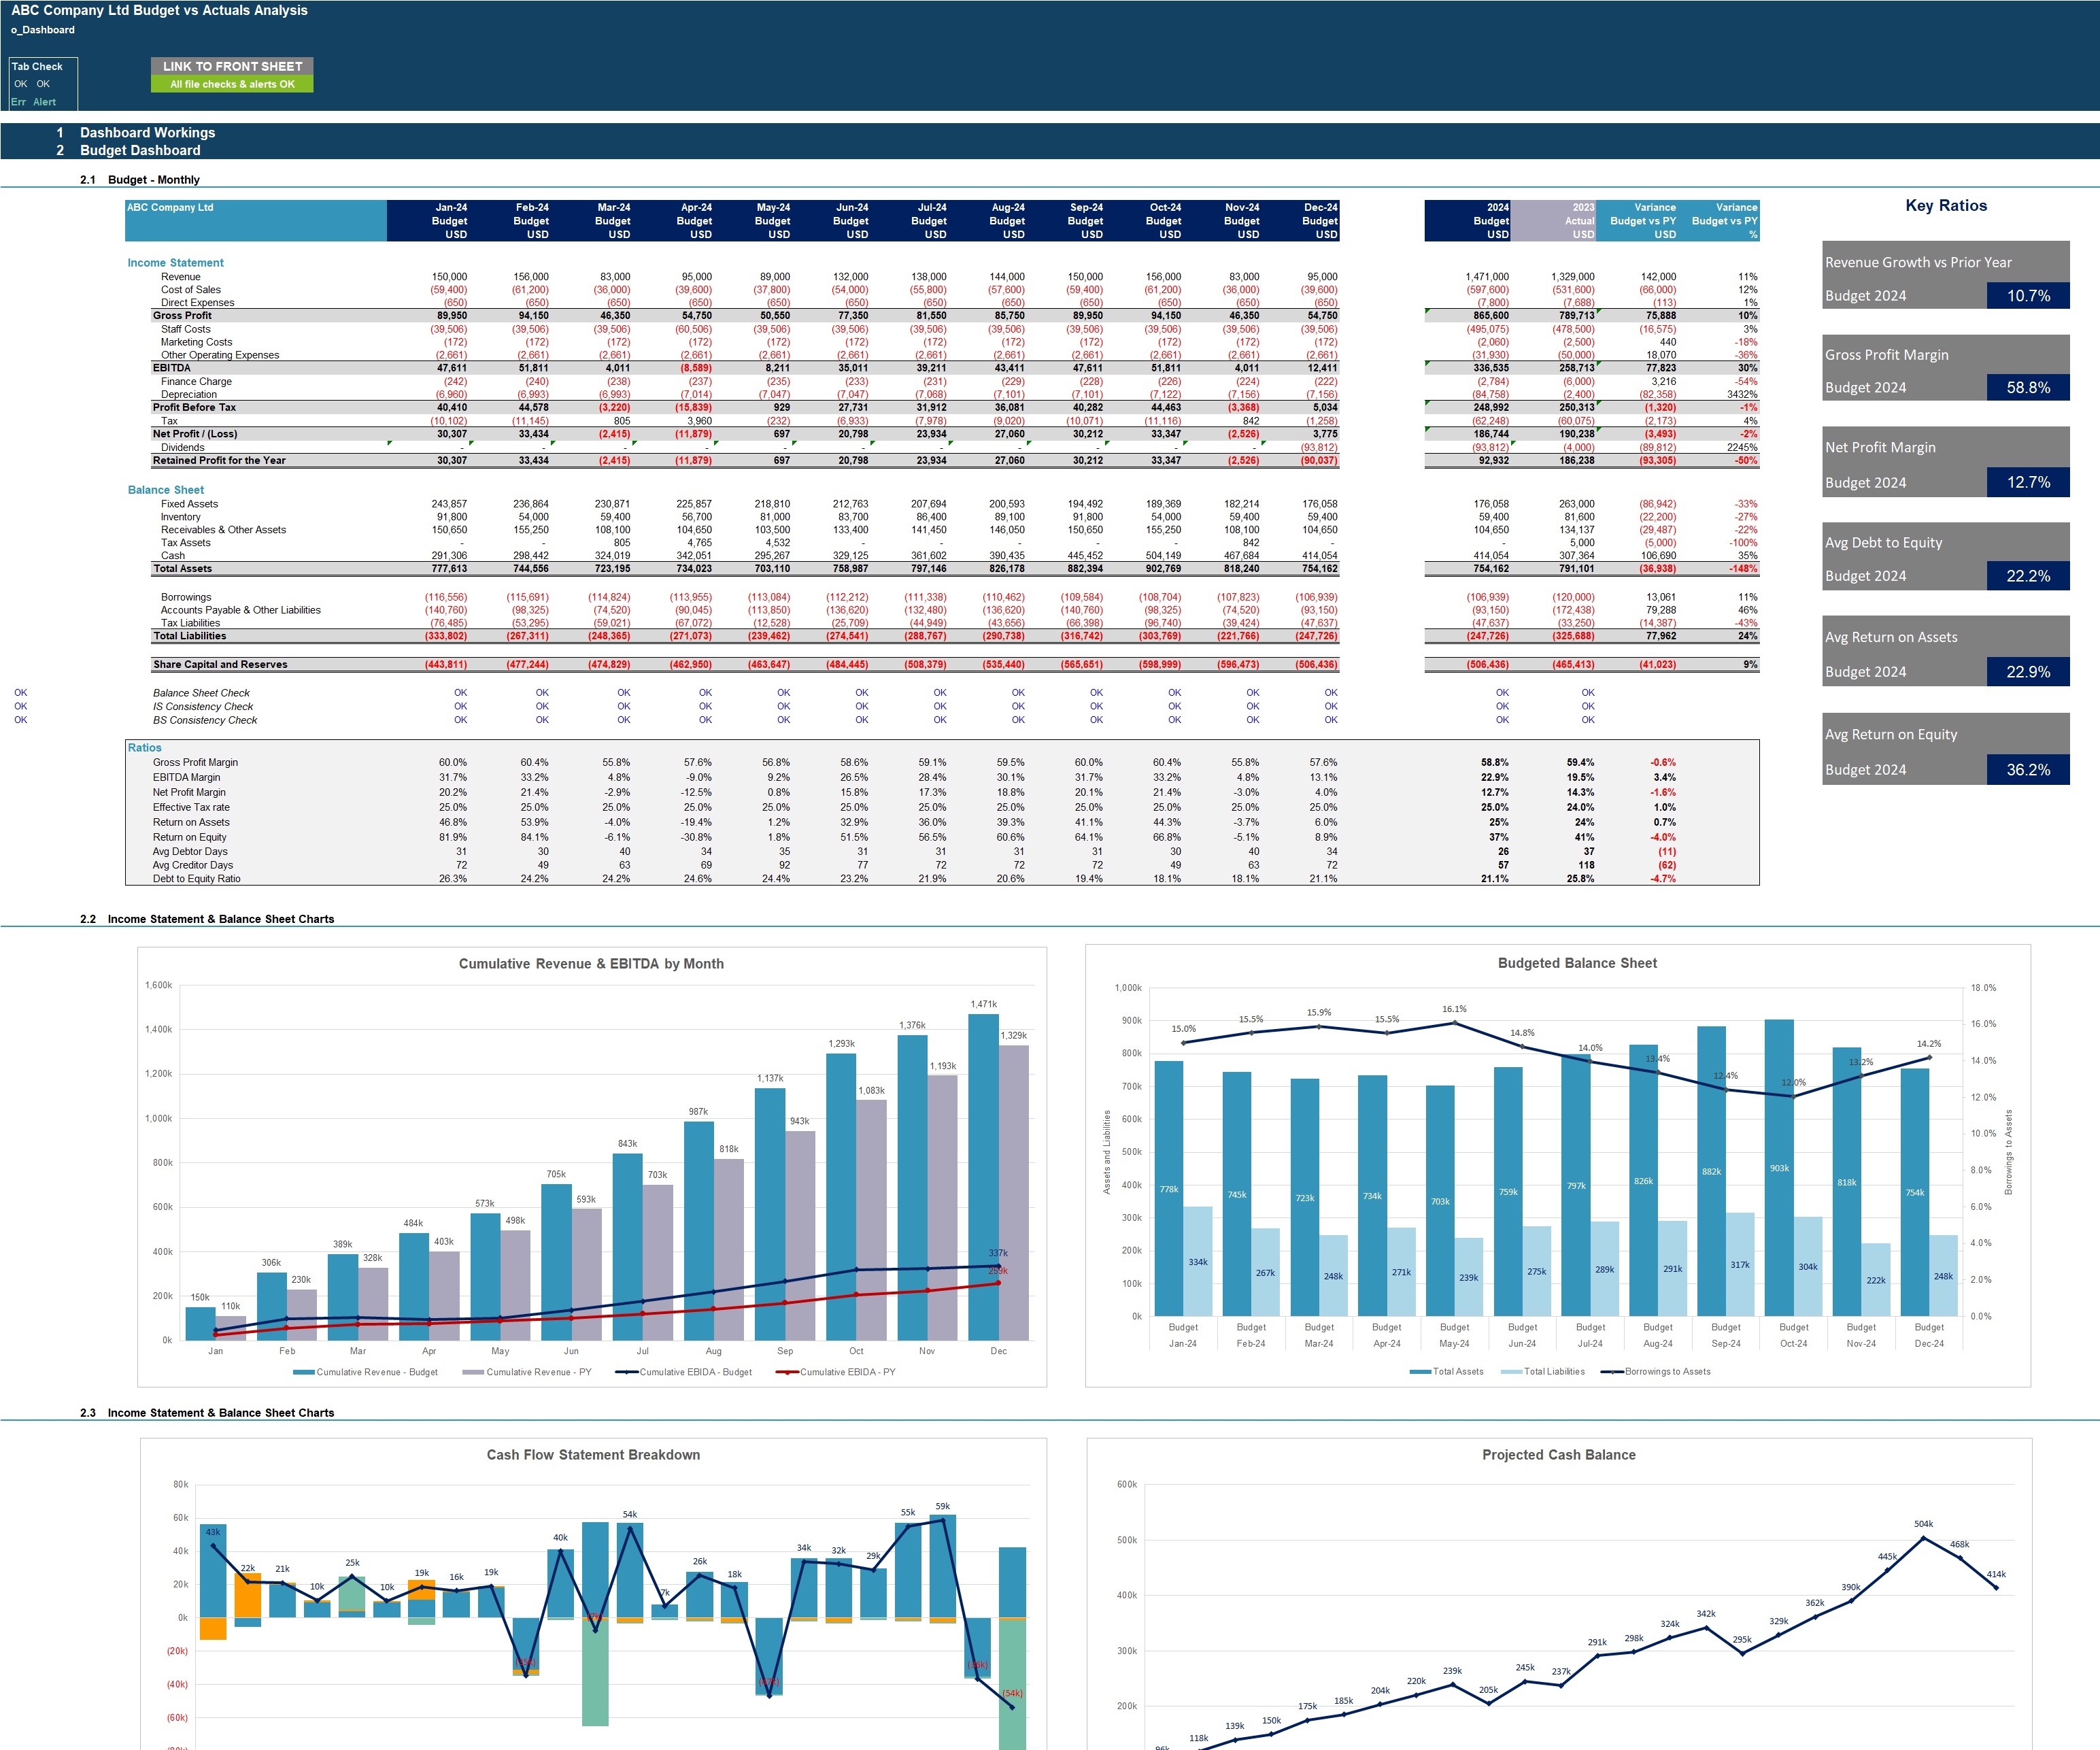
- Budget vs Prior Year Dashboard with:
o Summarised projected Income Statement and Balance Sheet by month and year;
o List of key ratios including average profit margins, average return on assets and equity and average debt to equity ratio;
o Variance analysis comparing budget to prior year income statement and balance sheet line items.
o Bar charts comparing budgeted income statement and balance sheet to prior year;
o Cash flow charts showing budgeted cash flow movement and balances;
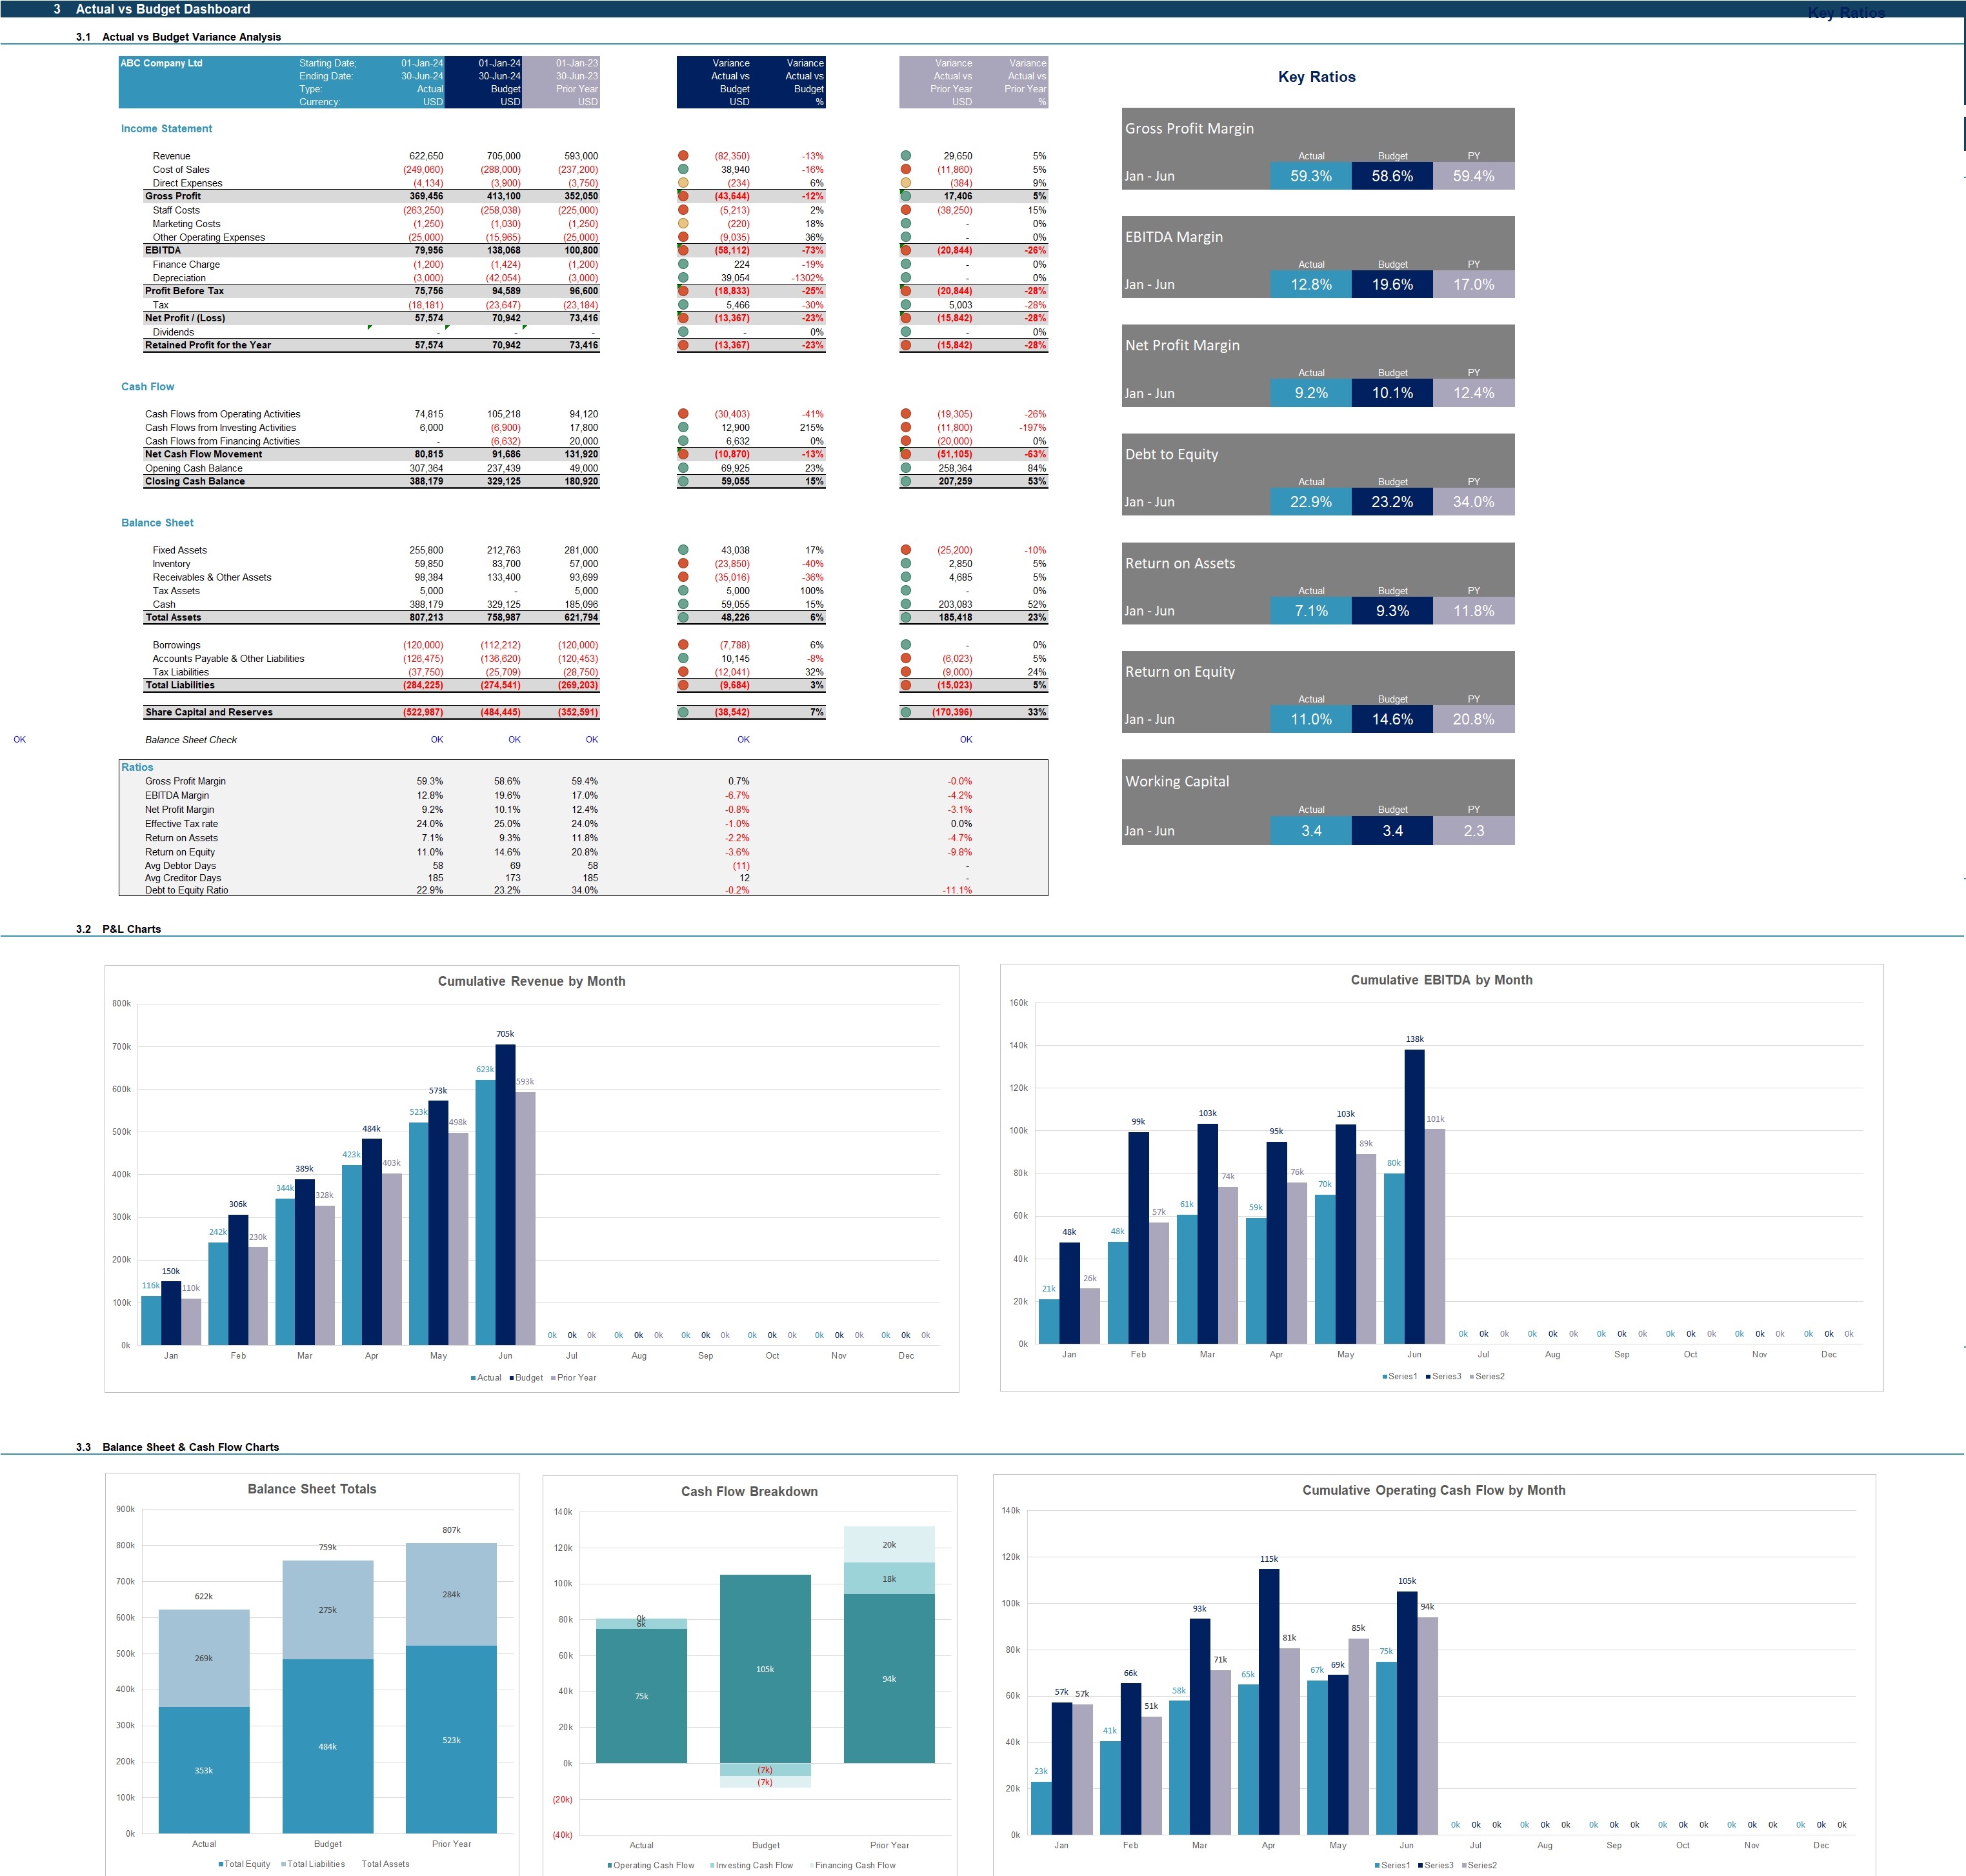
- Actual vs Budget and Prior Year Dashboard with:
o Summarised projected Income Statement, Balance Sheet and Cash Flow for Year to date for Actuals, budget and prior year;
o List of key ratios including average profit margins, average return on assets and equity and average debt to equity ratio for actuals, budget and prior year;
o Variance analysis comparing actuals, budget and prior year income statement, cash flow and balance sheet line items.
o Bar charts comparing actual, budget and prior year cumulative revenue, EBITDA, operating cash flow, balance sheet totals and cash flow breakdown.
KEY INPUTS
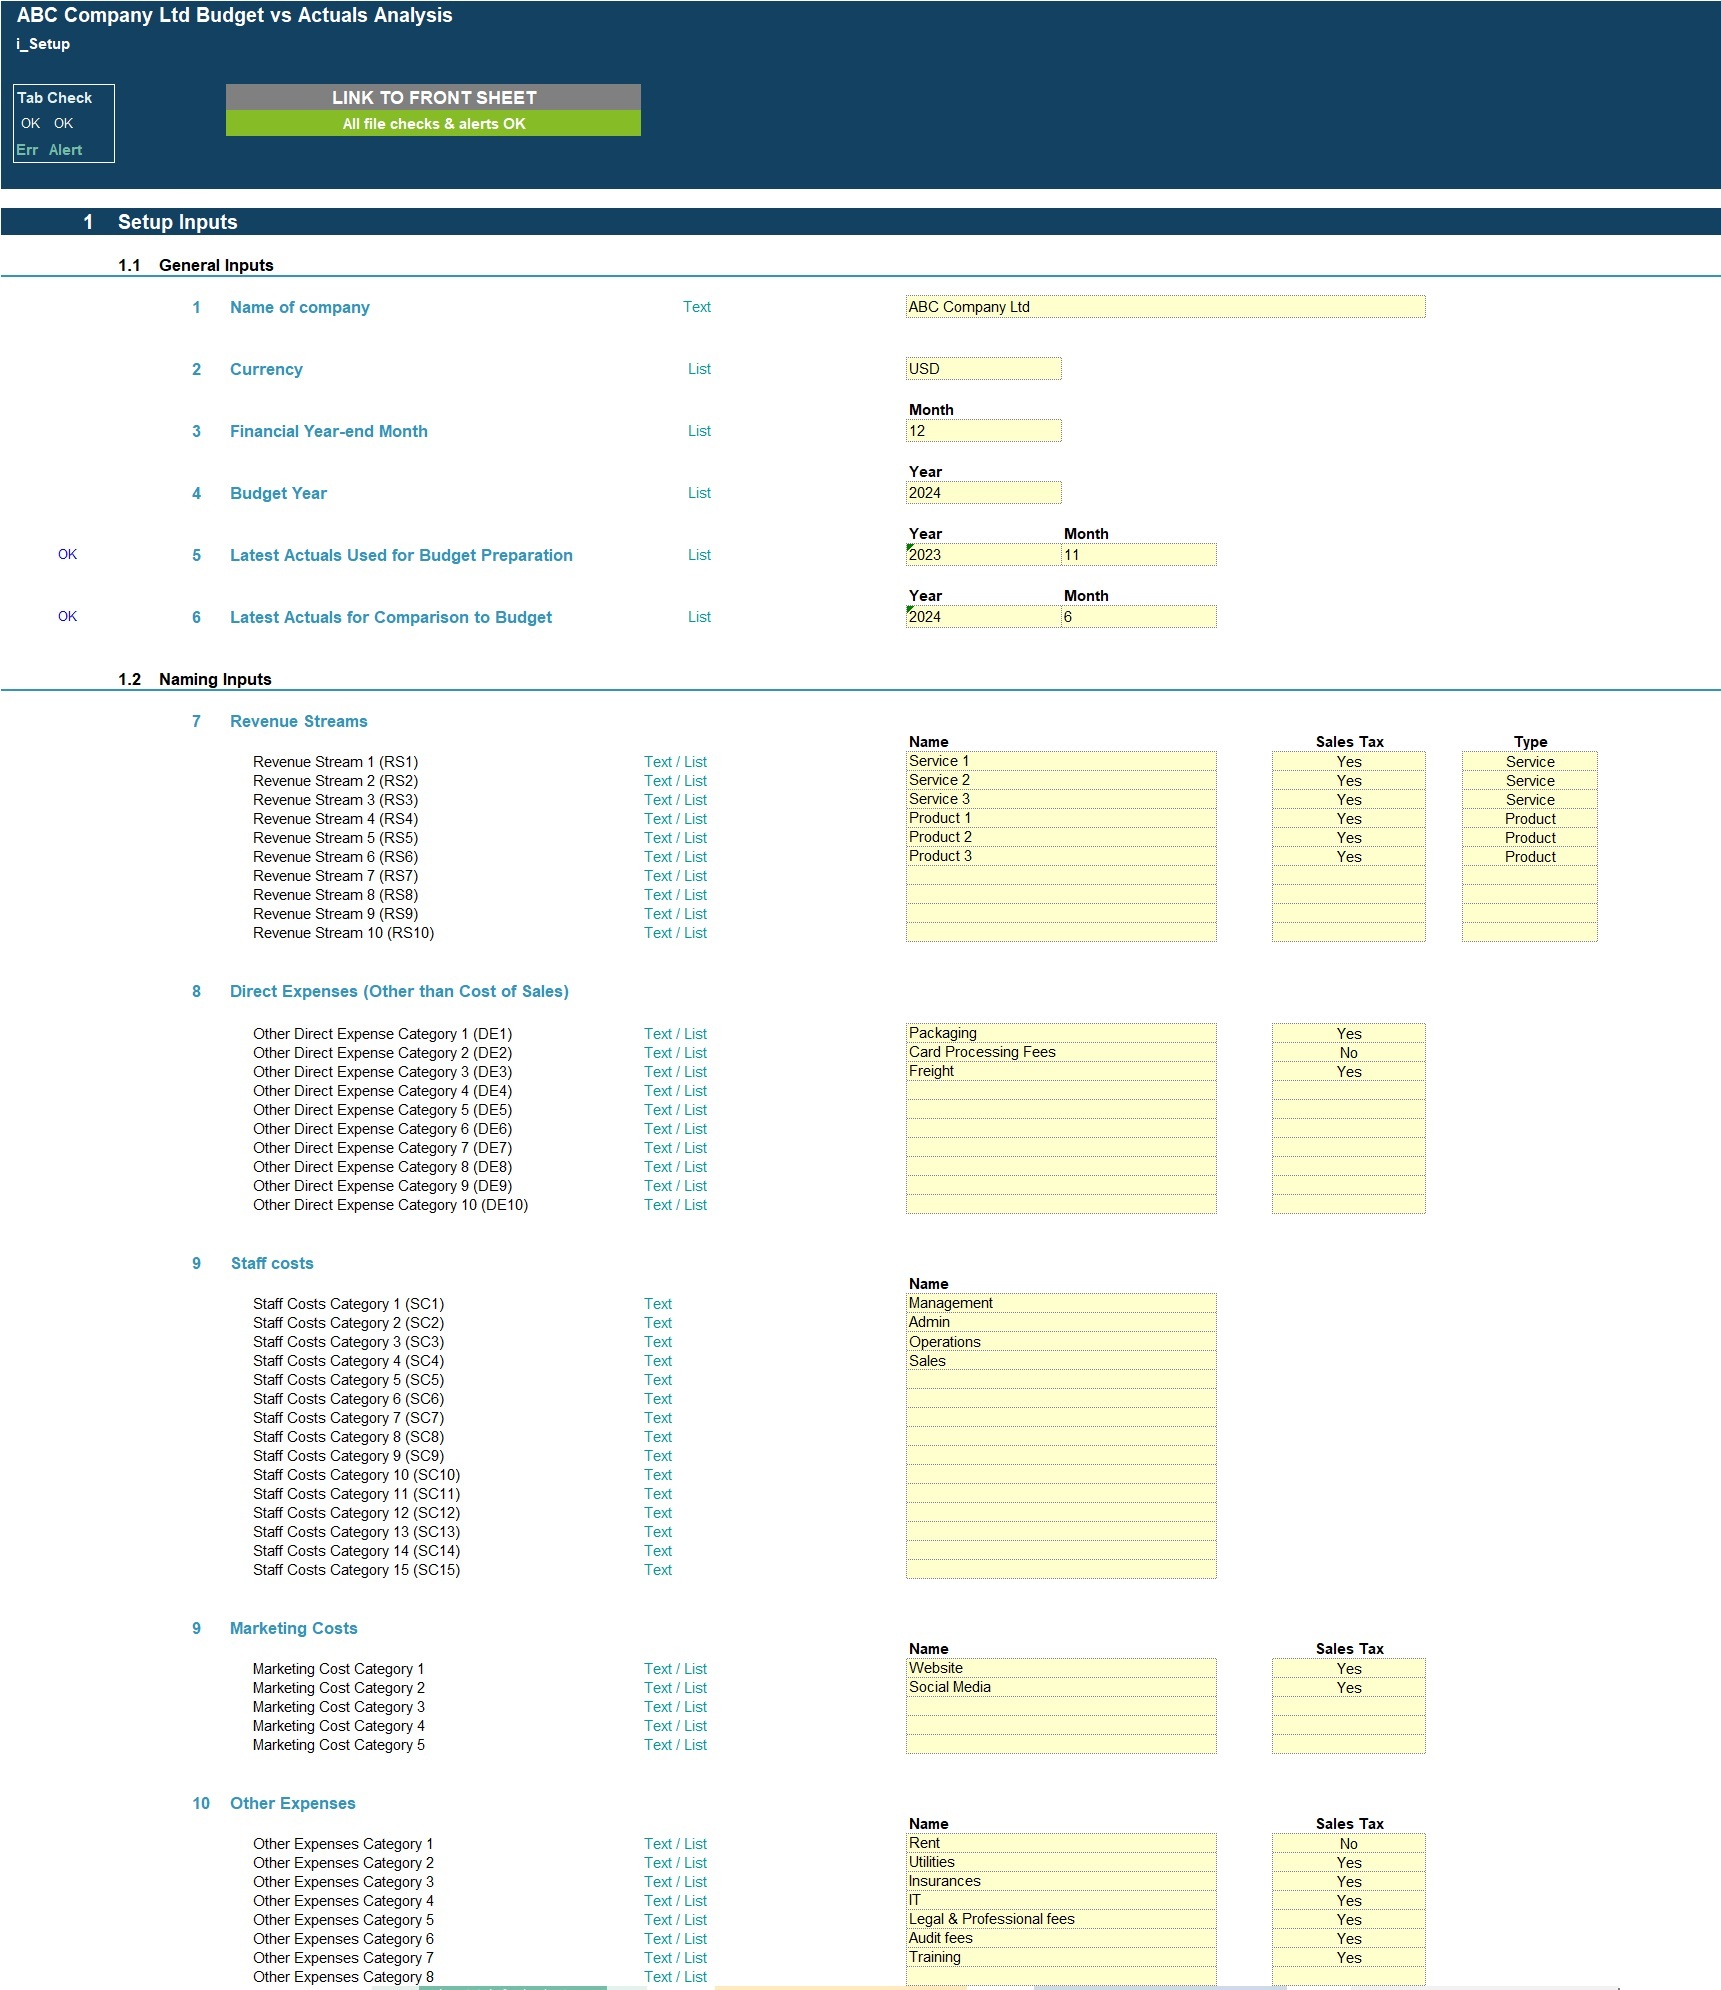
Setup Inputs:
- Name of business;
- Currency;
- Financial Year-end;
- Budget Year;
- Latest Actuals Used for Budget Preparation;
- Latest Actuals for Comparison to Budget.
- Naming for revenue streams, direct expenses, staff, marketing costs, other operating costs, fixed assets and borrowings;
- Sales tax applicability for revenue, direct costs, other expenses and fixed assets.
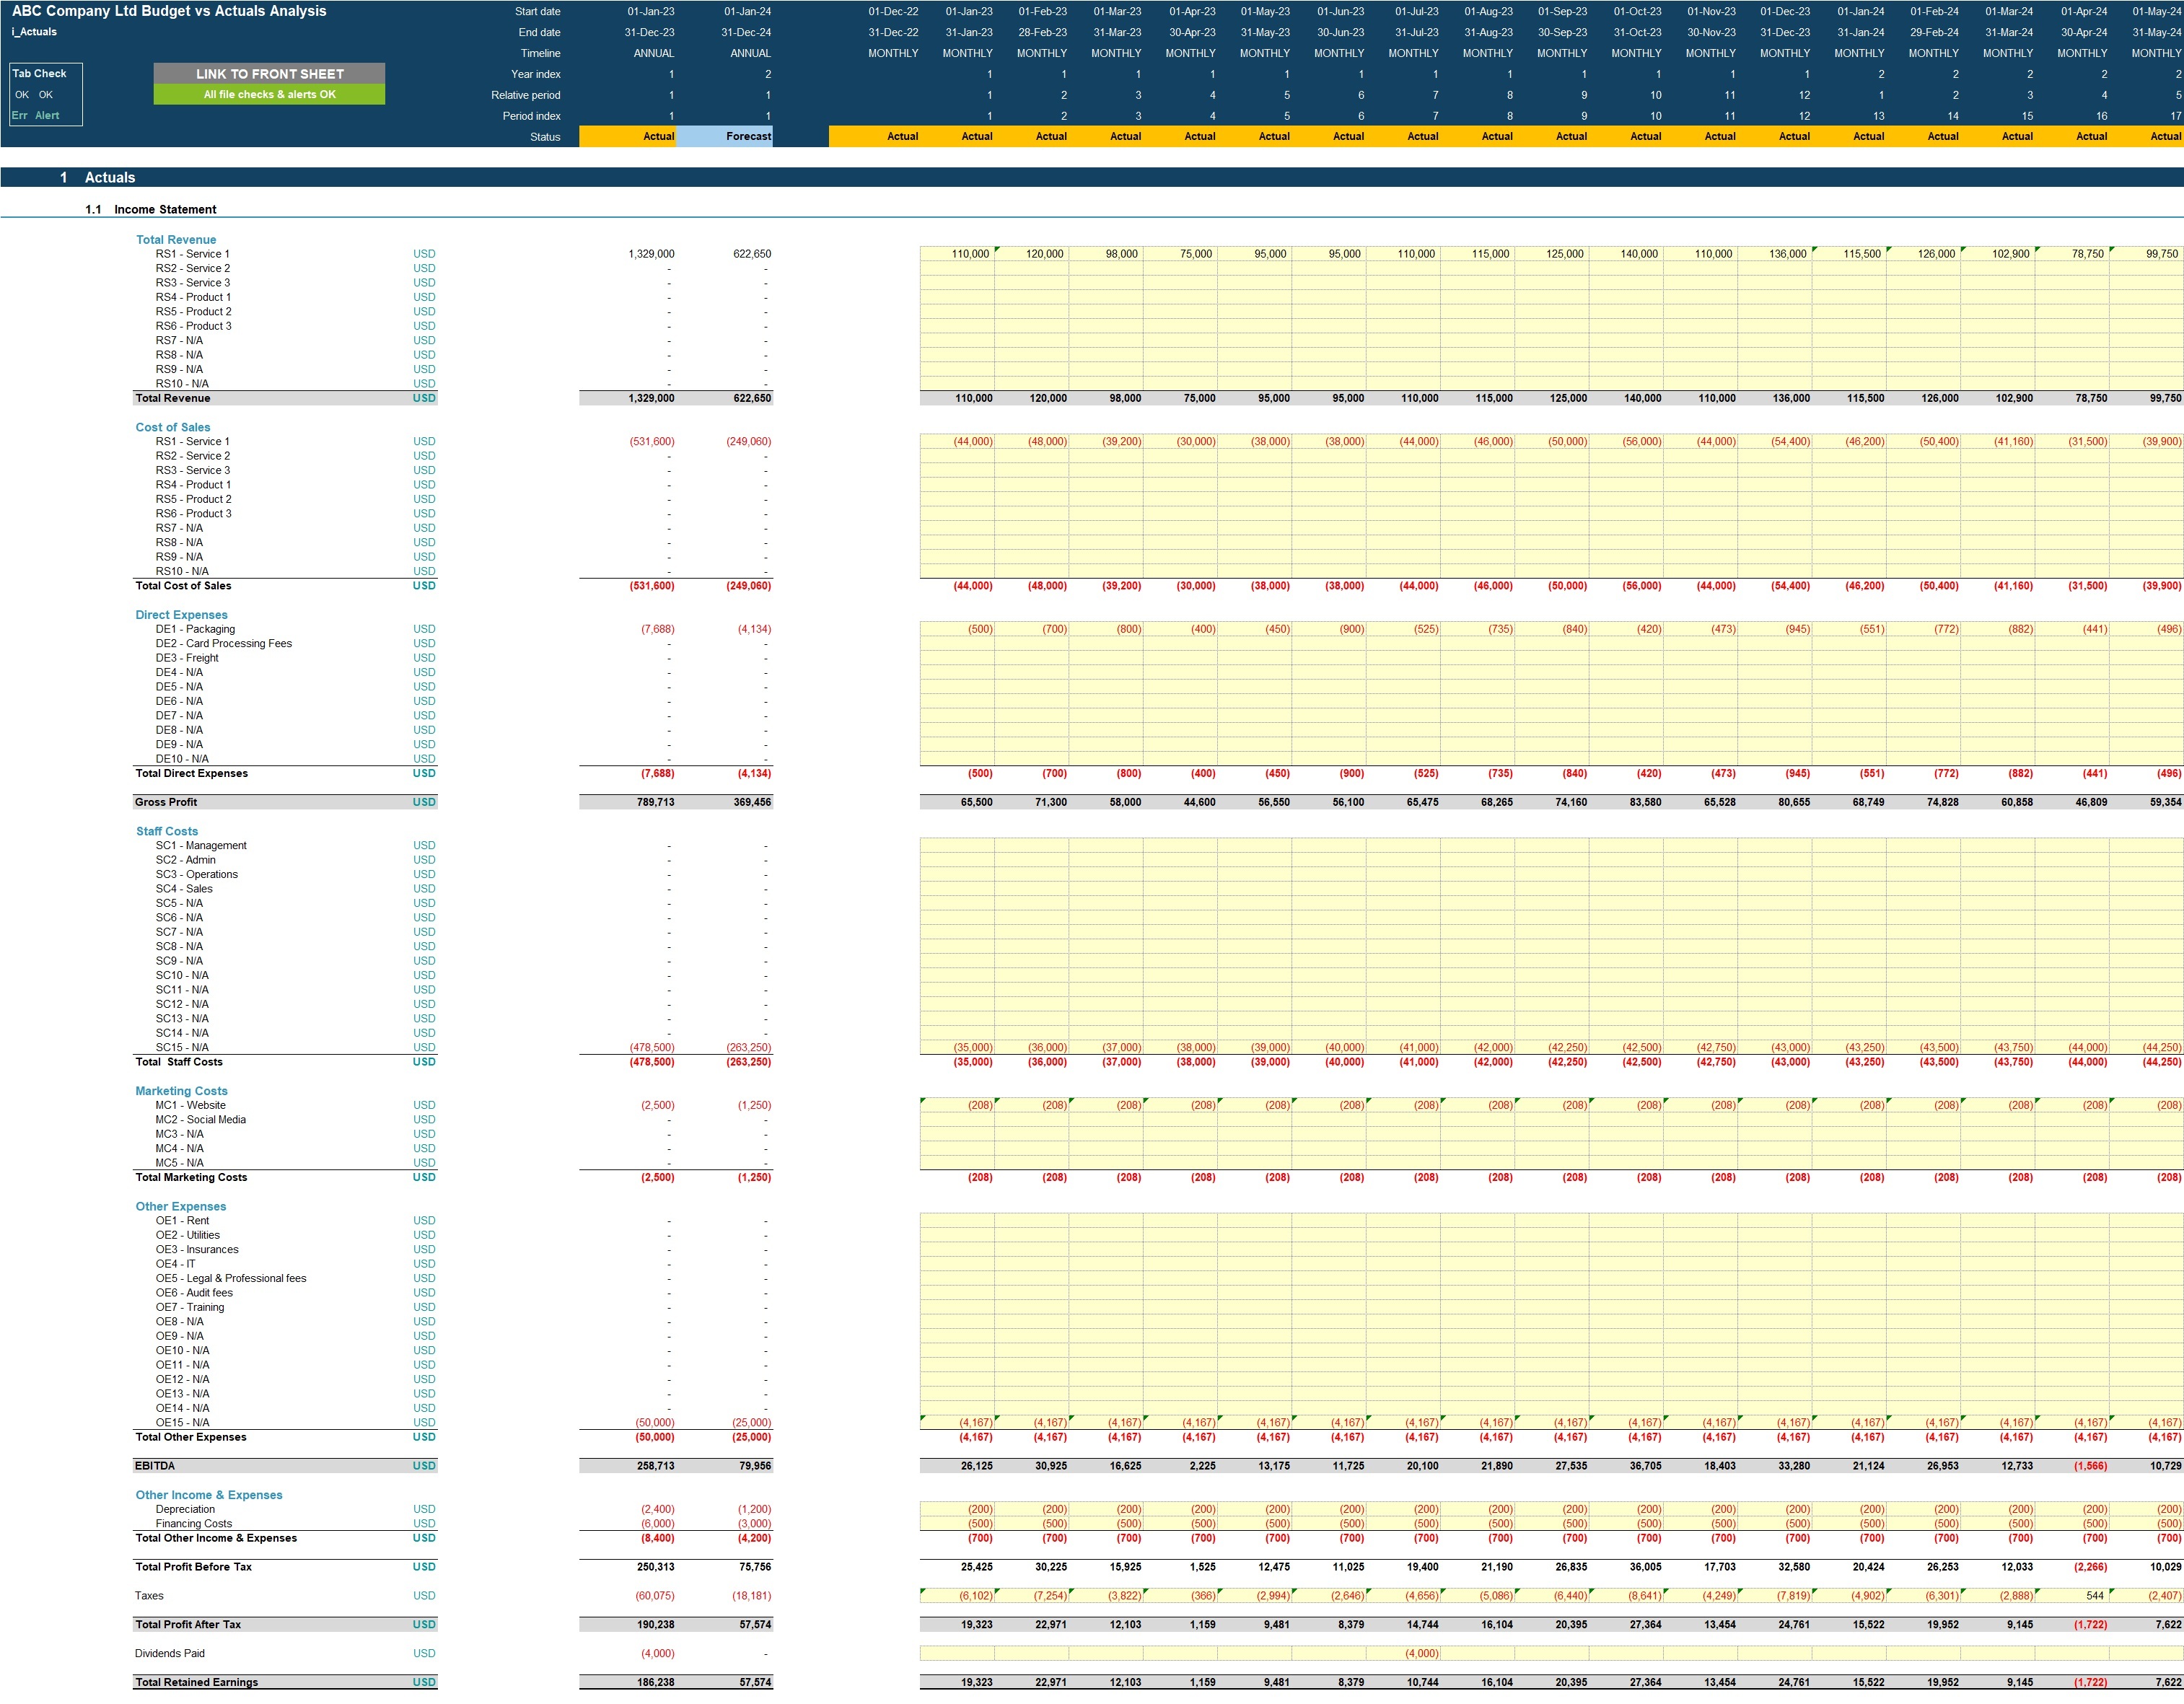
Actuals Inputs:
- Income Statement actuals by month;
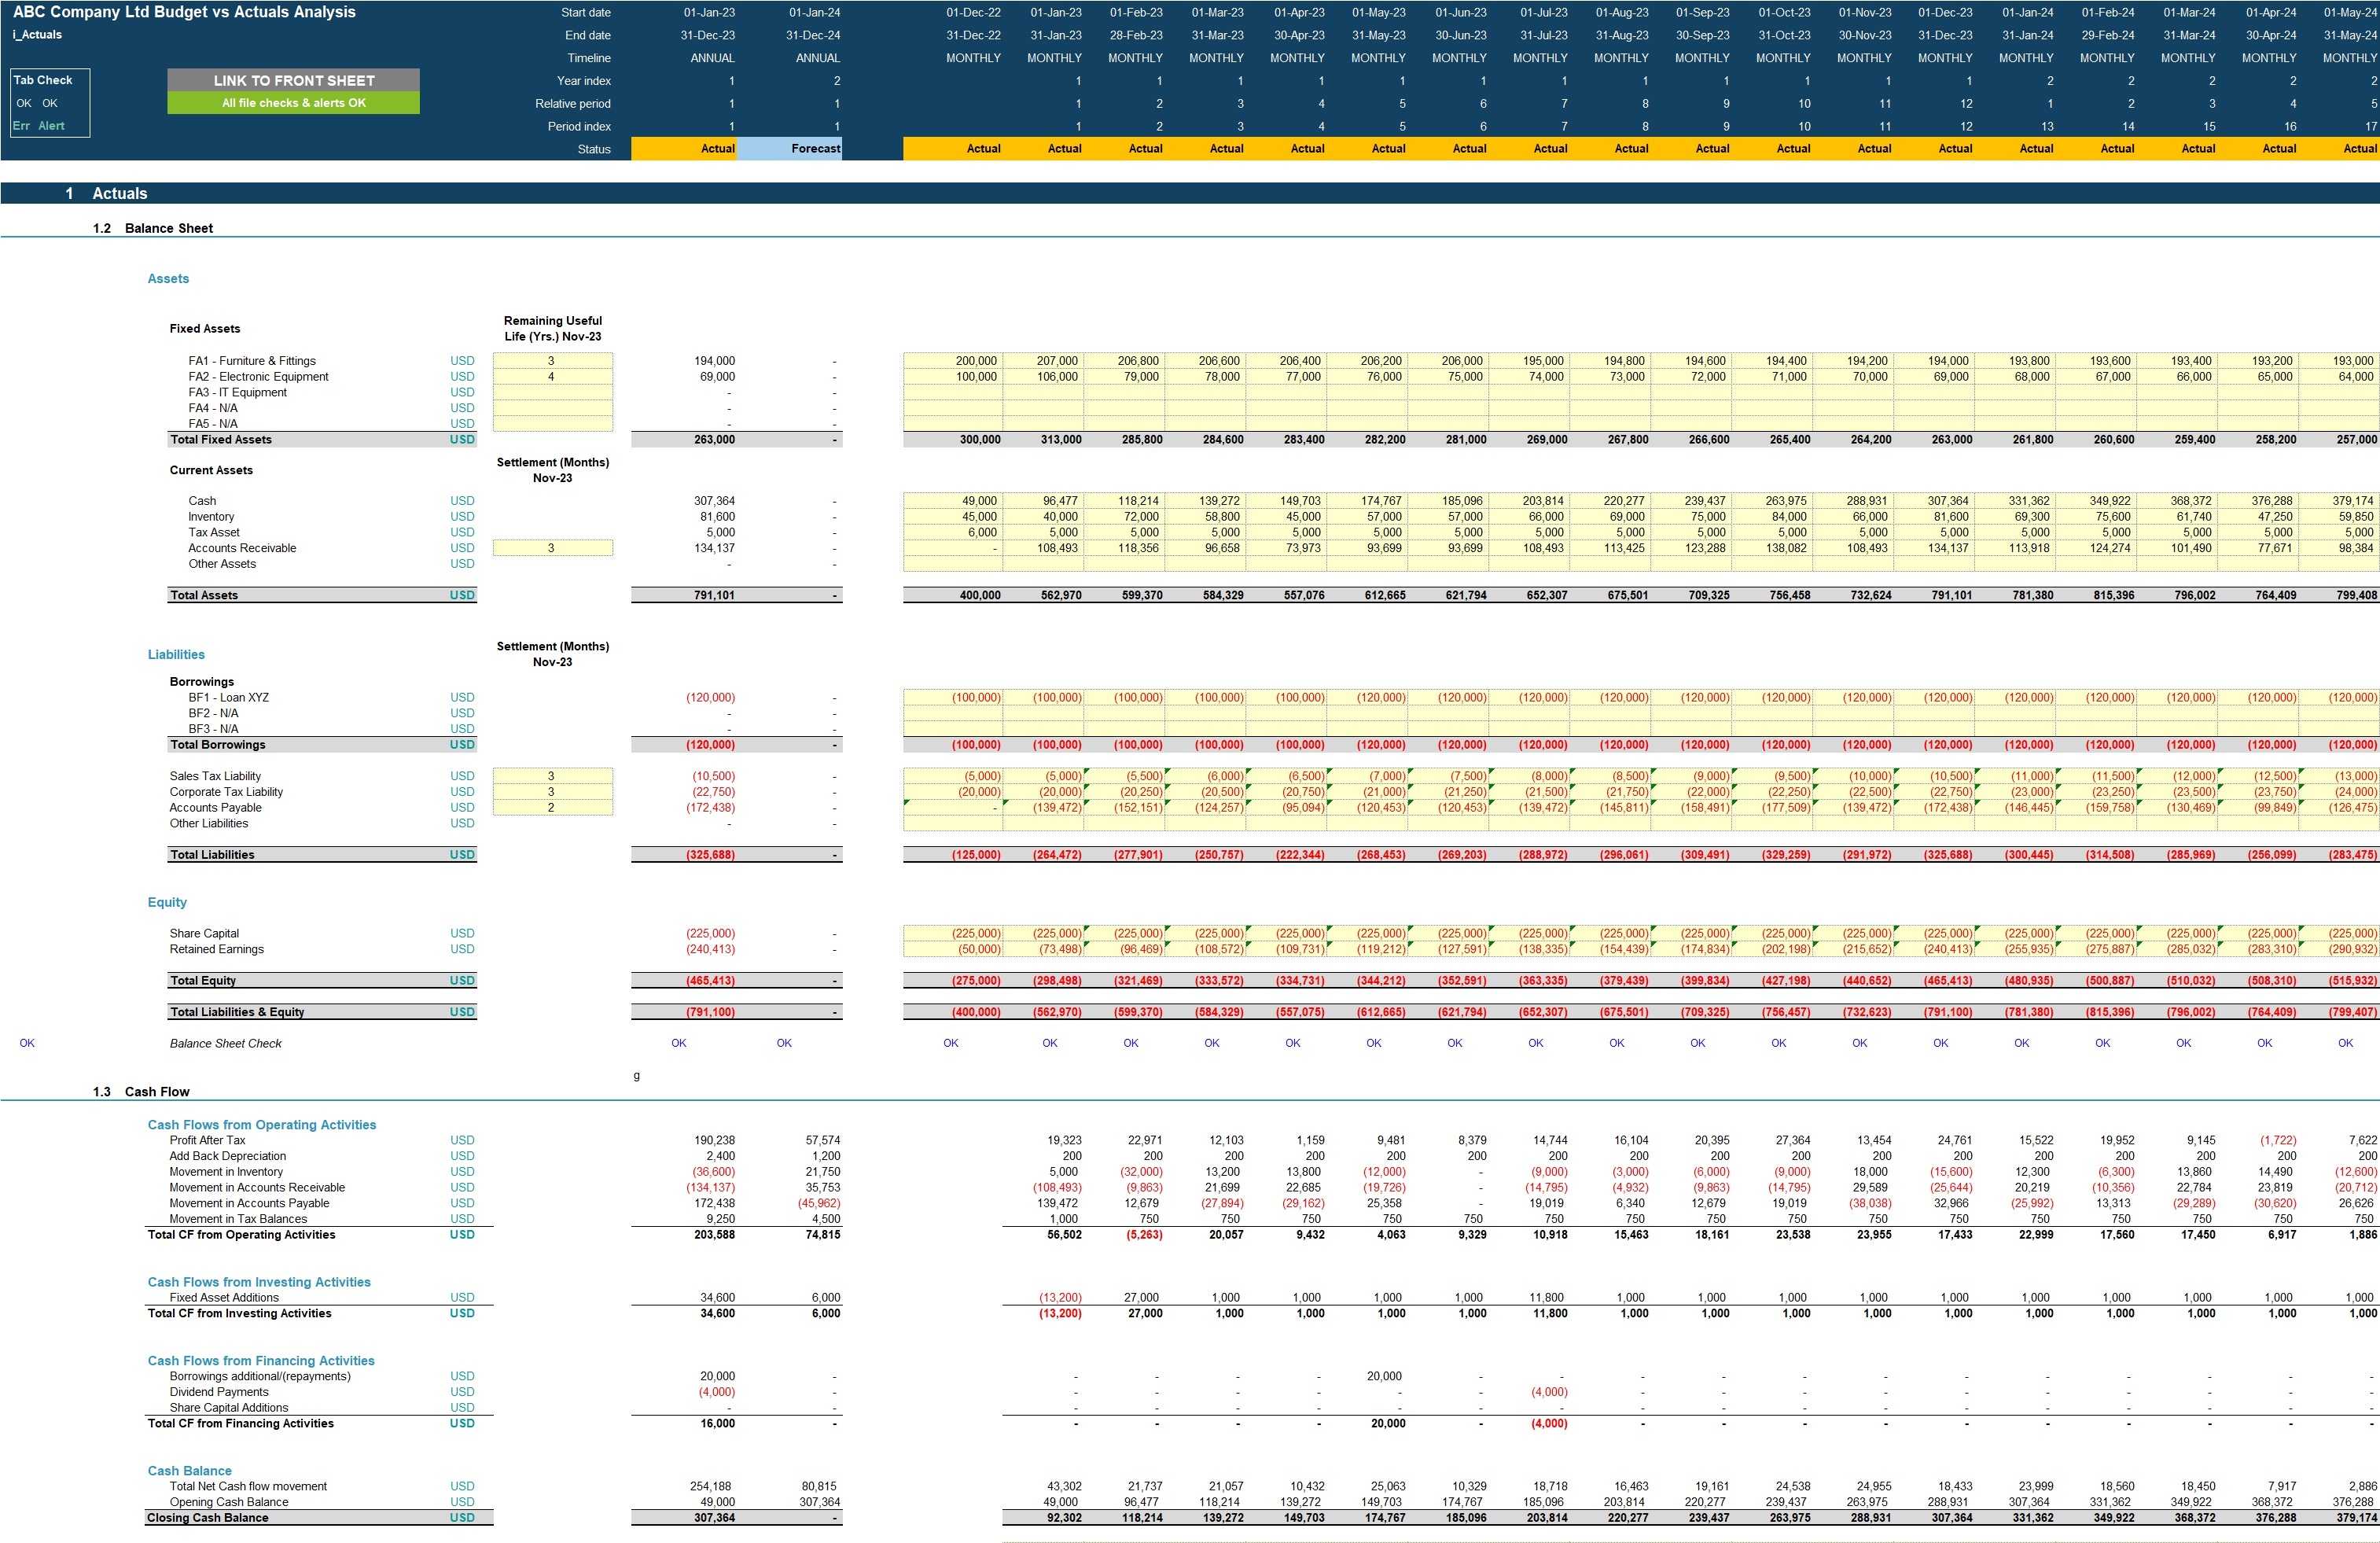
- Balance sheet balances by month.
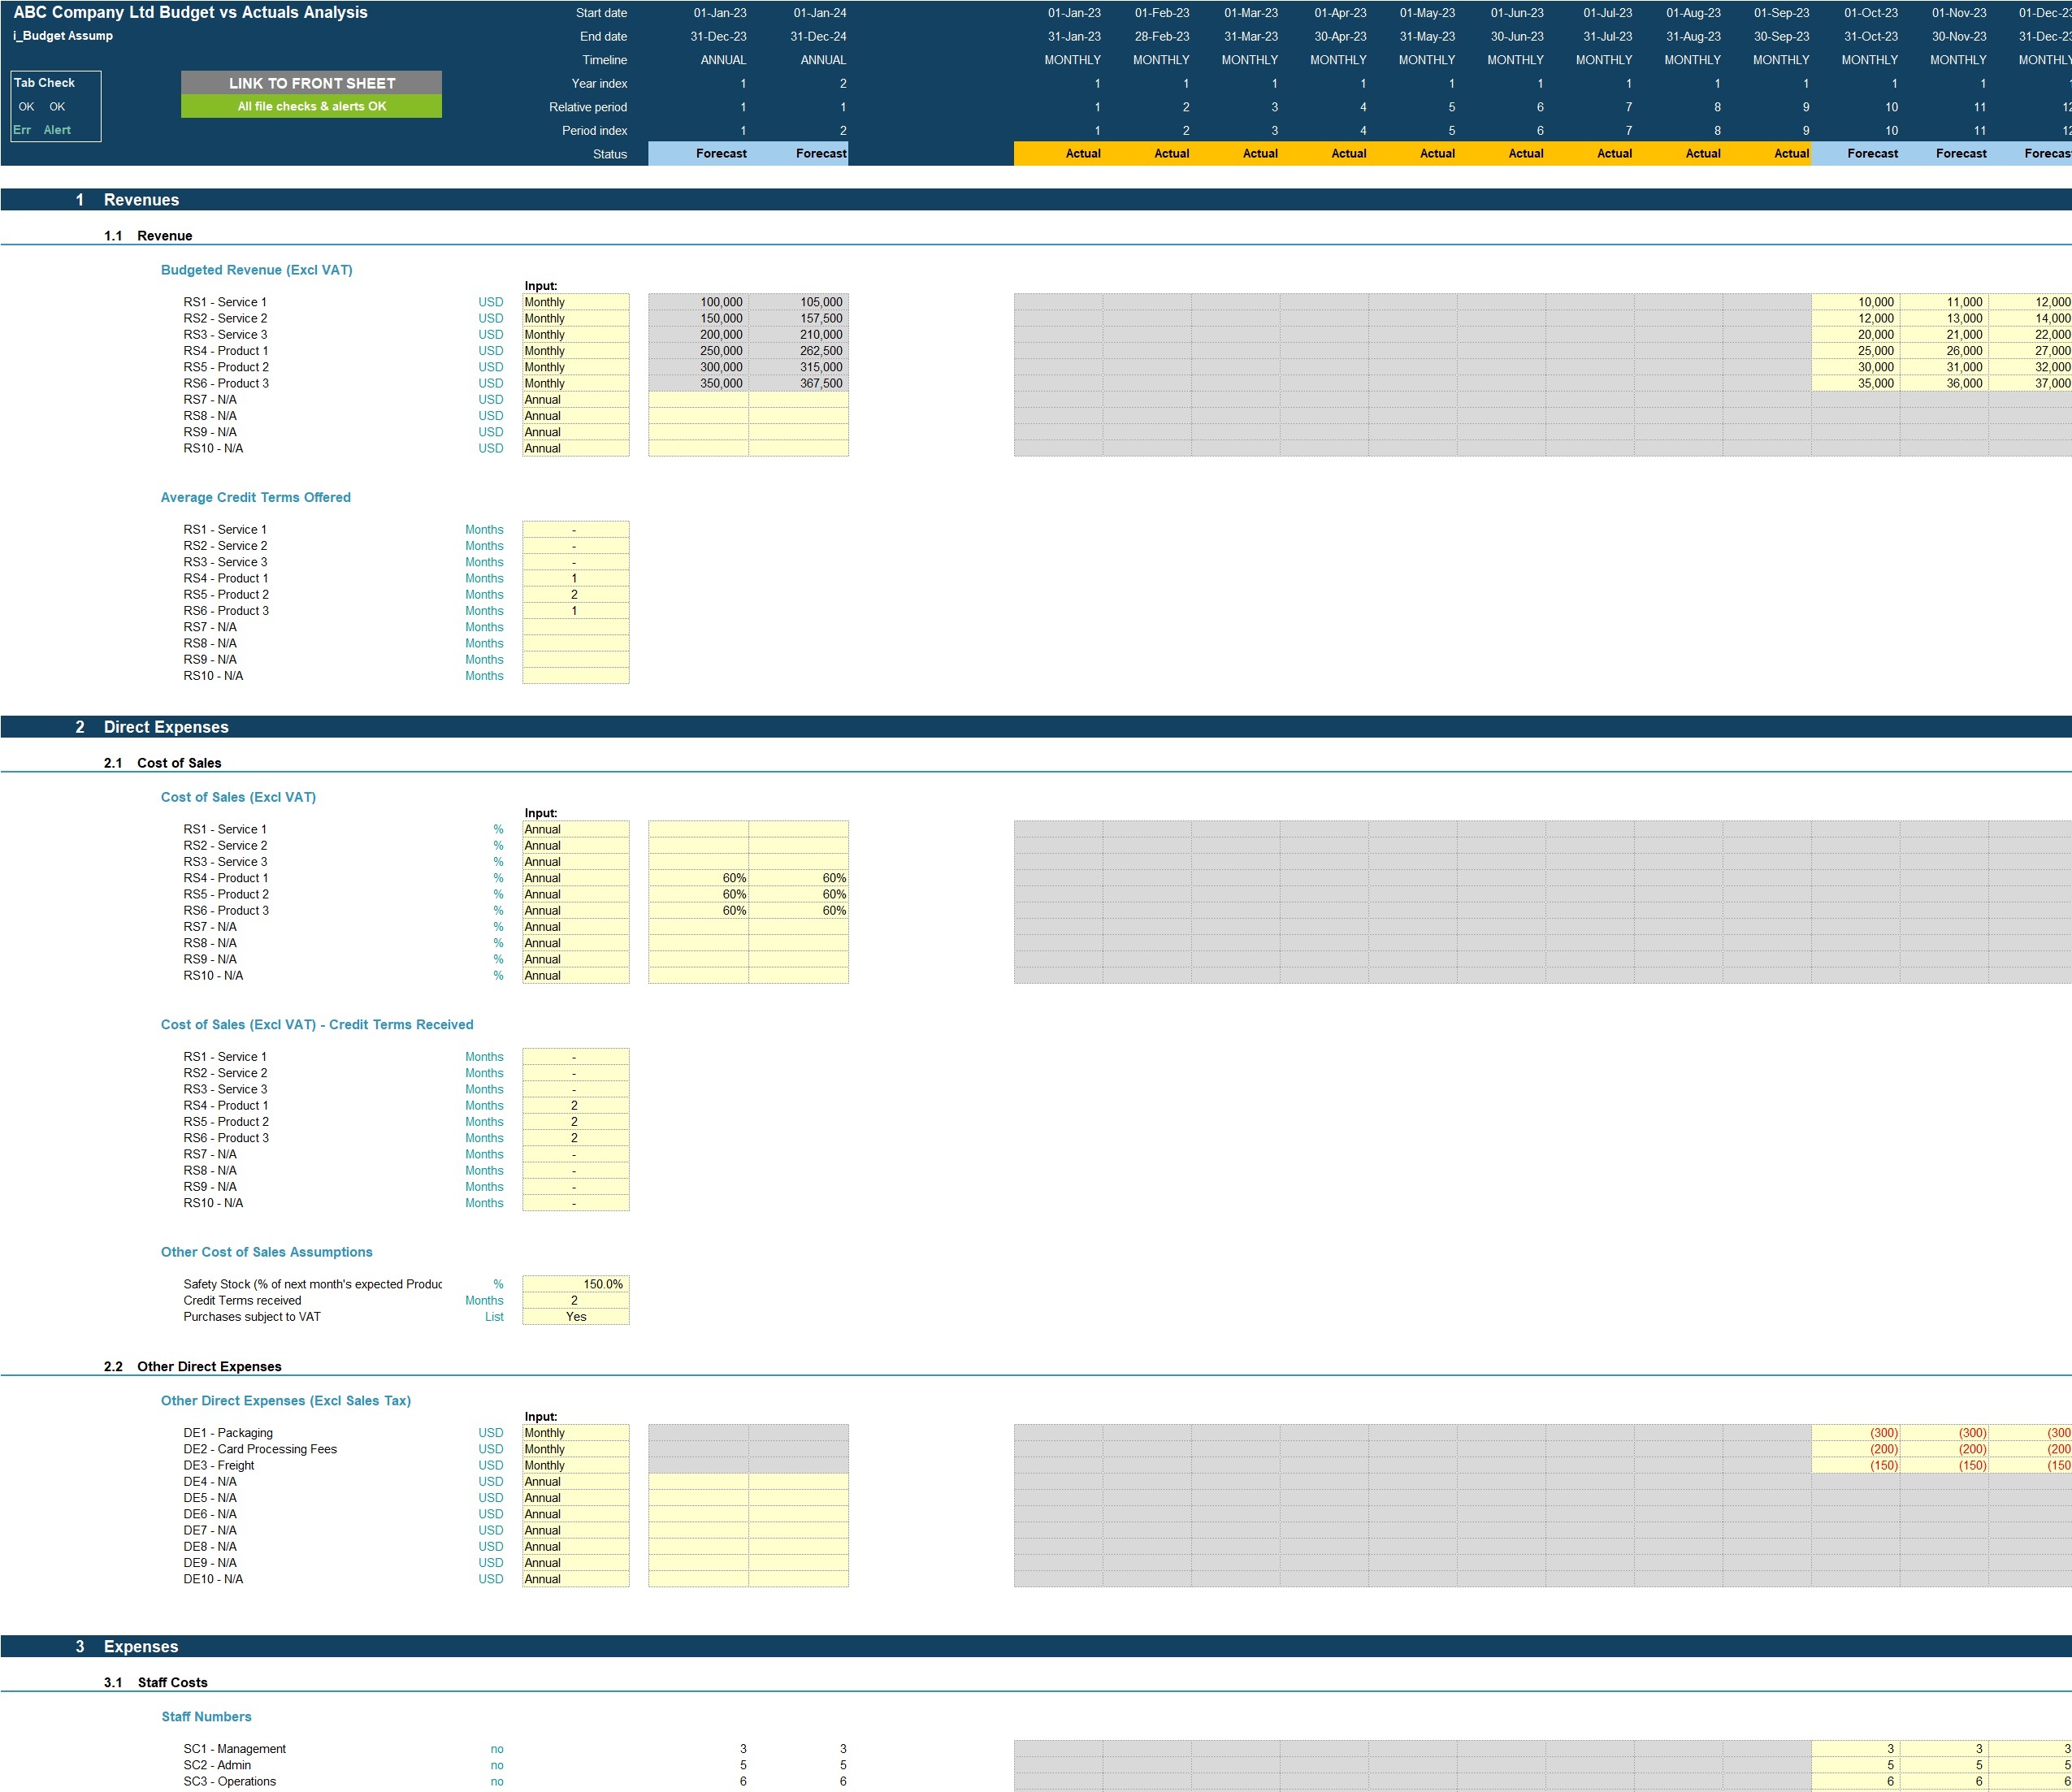
Budget Assumption Inputs:
- Revenue assumptions including average credit terms offered;
- Cost of sales assumptions including cost of sales percentages, credit terms received, safety stock and credit terms received;
- Direct expense assumptions;
- Staff cost inputs including staff numbers, average salary per full time position, average employer’s social security percentage of salary, average annual bonus and bonus payment months.
- Other costs inputs including marketing costs and other operating costs;
- Sales and corporate tax inputs including rate and payment periods;
- Dividend inputs including amount (percentage of retained earnings) and frequency;
- Fixed assets including addition amounts and useful life;
- Borrowings including addition amounts, interest rate and maturity date;
- Share capital additions.
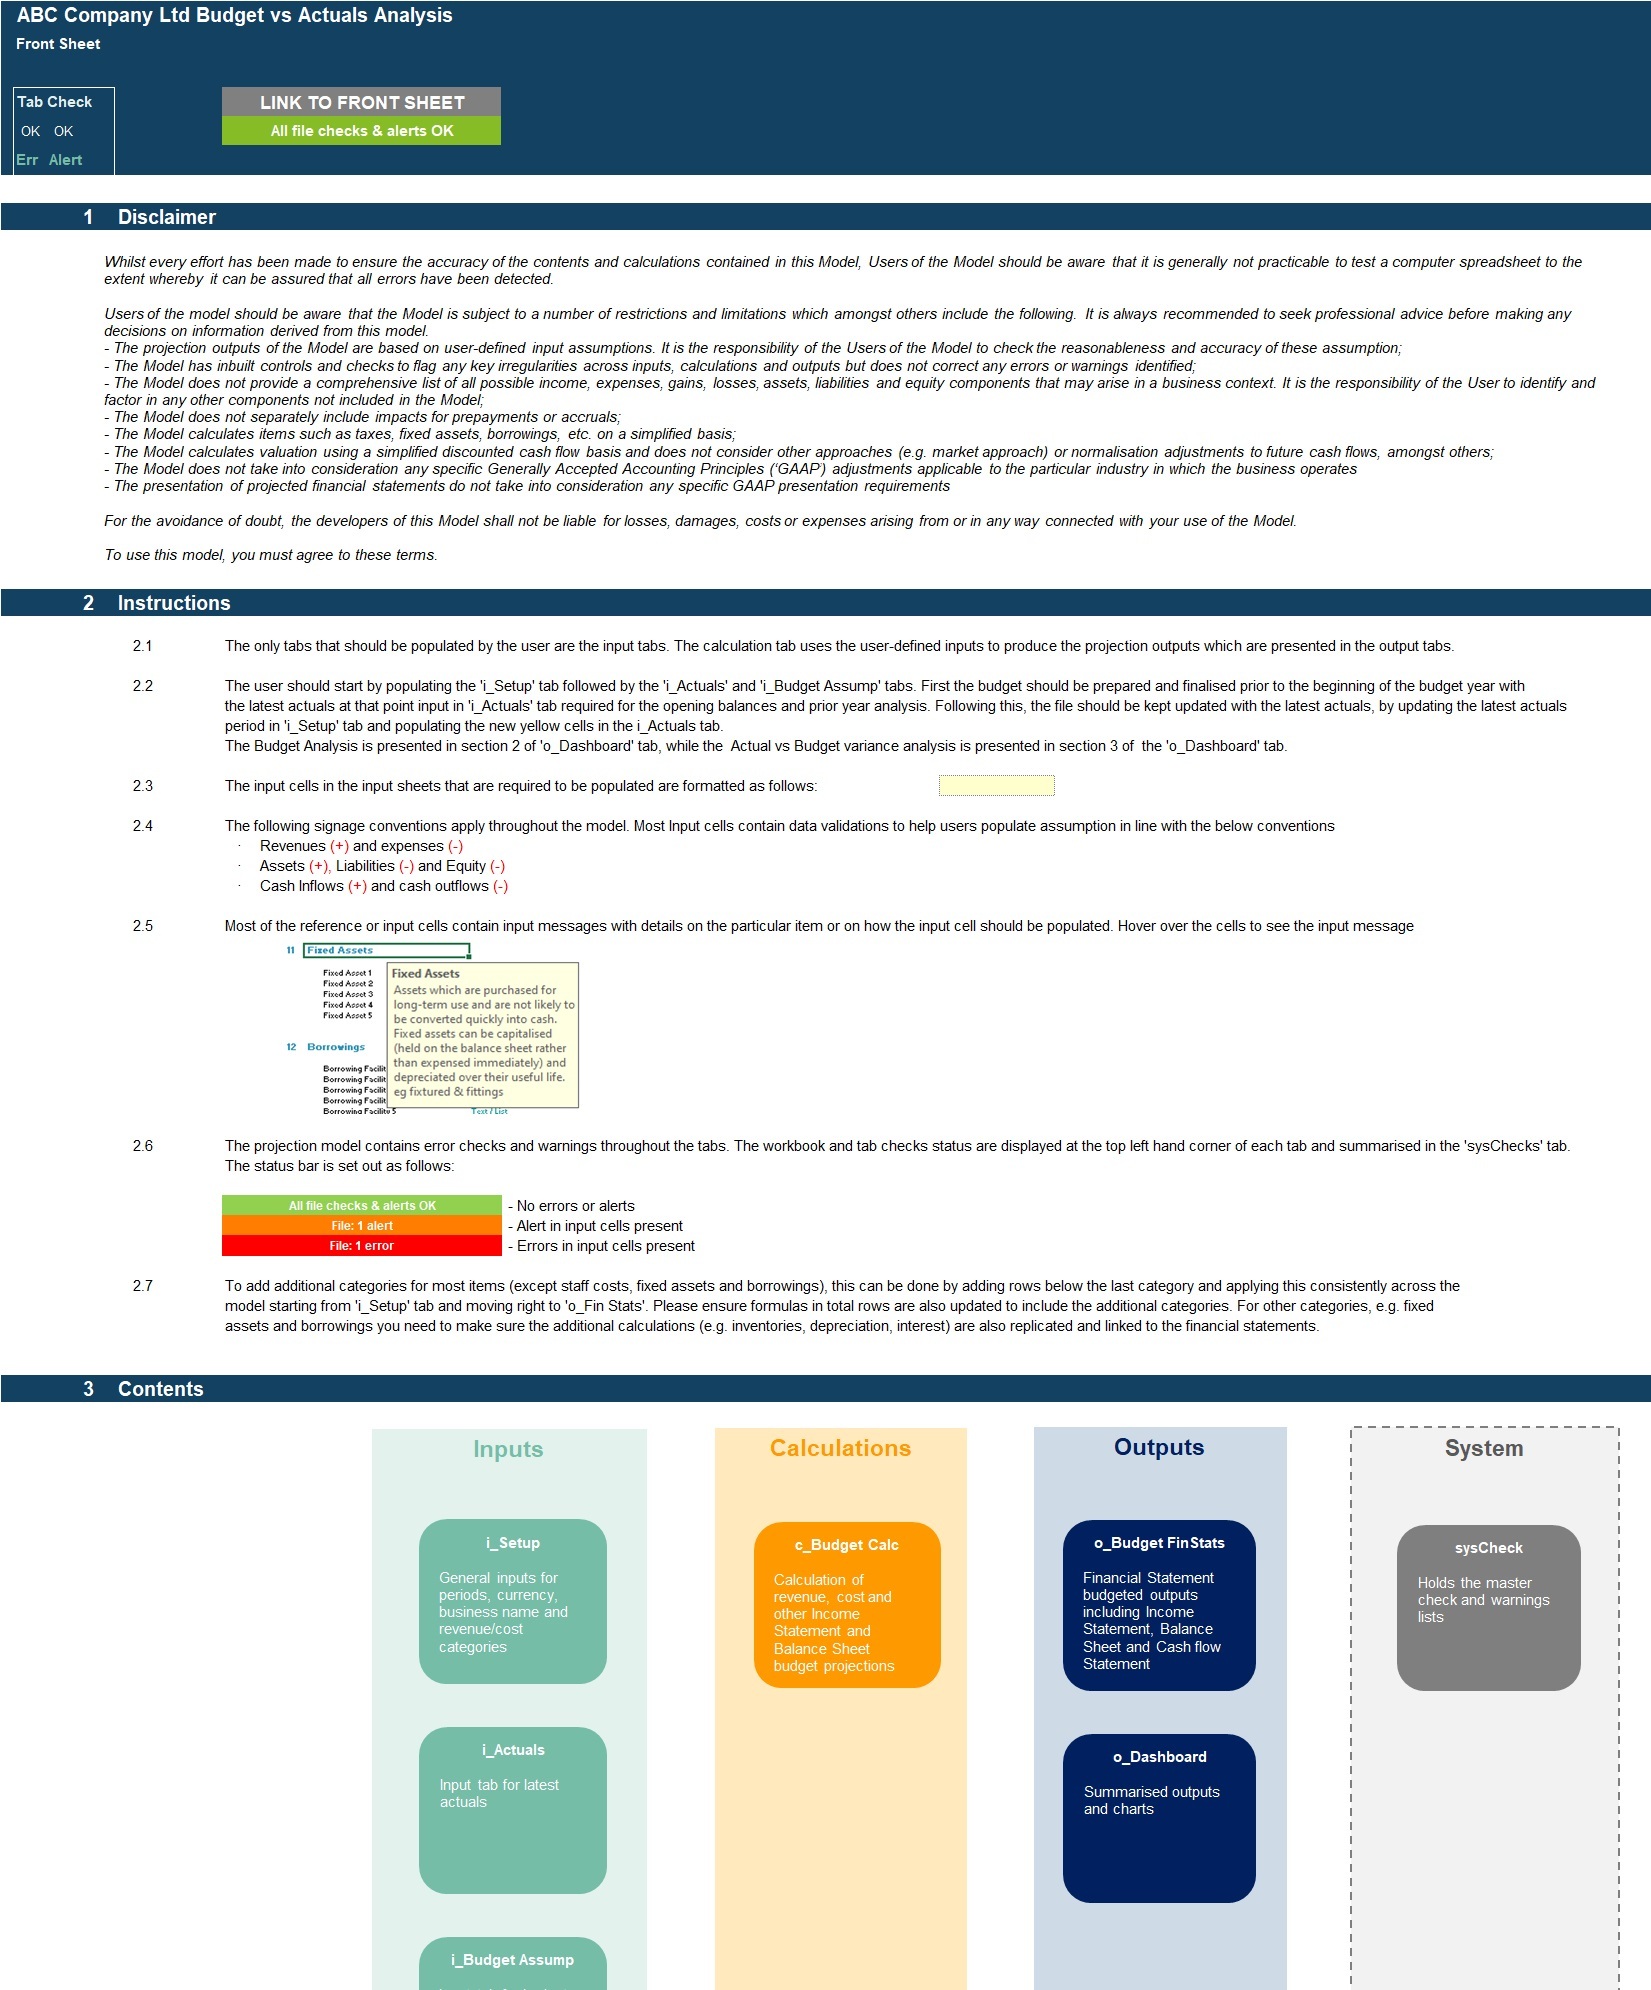
MODEL STRUCTURE
The model comprises of 8 tabs split into input ('i_'), calculation ('c_'), output ('o_’) and system tabs. The tabs to be populated by the user are the input tabs ('i_Setup', ‘i_Actuals’ and 'i_Budget Assump'). The calculation tab uses the user-defined inputs to calculate and produce the projection outputs which are presented in 'o_Budget FinStats' and ‘o_Dashboard’.
KEY FEATURES
- The model contains a flexible timeline that allows for a mix of actual and forecast periods across a 2-year period. This allows projections to be easily rolled forward as forecast periods become actual period;
- Timeline is split on a monthly basis and summarised on an annual basis;
- The model allows the user to model up to 10 revenue streams consisting of products or services each with their own cost of sales, inventory (if applicable) and direct expenses.
- The model is not password protected and can be modified as required following download;
- The model is reviewed using specialised model audit software to help reduce risk of formula inconsistencies;
- The model allows for the following number of underlying categories for each line item (these can be easily expanded if required):
o Revenue Streams – 10 types;
o Direct expenses – 10 categories;
o Staff costs – 15 categories;
o Marketing costs – 5 categories;
o Other expenses – 15 categories;
o Fixed assets – 5 categories;
o Borrowings – 3 facilities
- Apart from budgeting/projecting revenue and costs the model includes the possibility to model fixed assets, borrowings (amortising), dividends and corporate tax;
- Business name, currency, starting projection period are fully customisable;
- Revenue, cost and fixed asset descriptions are fully customisable;
- The model included an integrated cash flow statement calculation for monthly actuals;
- The model includes instructions, line-item explanations, checks and input validations to help ensure input fields are populated accurately;
- The model includes a checks dashboard which summarises all the checks included in the various tabs making it easier to identify any errors.
SUPPORT / MODIFICATIONS
We are keen to ensure our customers are satisfied and find the models useful for their financial projection needs. Our models are developed with the user in mind and include instructions, line-item explanations, checks and input validations to ensure they are as user-friendly and easy to use as possible without requiring extensive knowledge of Microsoft Excel, finance or accounting. If any questions do arise, we are more than happy to assist. We are also happy to support with any be-spoke modifications you may require to the models to better suit your business needs. To get in touch, please send us a message through the website
We are also always keen to receive feedback so please do let us know what you think of our models by sending us a message or submitting a review.
ABOUT PROJECTIFY
We are financial modelling professionals with experience working in big 4 business modelling teams and strong experience supporting businesses with their financial modelling and decision support needs. Our aim is to provide robust and easy-to-use tools that follow good practice financial modelling guidelines and assist individuals and businesses with their financial projection and analysis requirements.
PURPOSE OF MODEL
Actual vs. budget variance analysis is a financial management process that involves comparing the actual financial results of a business with the budgeted or planned figures helping businesses understand the differences between what was expected and what actually occurred. This enables businesses to identify areas of success or concern and to make informed decisions.
Our highly versatile and user-friendly Excel template has a dual purpose:
(1) It allows for the preparation of a monthly budget based on latest actuals combined with assumptions for the projection/budget period;
(2) It allows the user to track actual performance against budget and prior year on a monthly and year to date basis with results presented in a dashboard format with a mix of charts and tables.
The model is not industry specific and includes 10 revenue streams (which can be any mix of products or services), related costs of sales, inventory (if applicable) and direct expenses. Apart from revenue and direct costs, the model allows the user to model staff costs, marketing costs, other operating costs, fixed assets, borrowings, sales tax, corporate tax and dividend distributions.
The model follows good practice financial modelling principles and includes instructions, line item explanations, checks and input validations and incorporates a cash flow statement calculation for actuals.
KEY OUTPUTS
- Budgeted full financial statements (Income Statement, Balance Sheet and Cash flow Statement) presented on a monthly basis across and summarised on an annual basis.
- Budget vs Prior Year Dashboard with:
o Summarised projected Income Statement and Balance Sheet by month and year;
o List of key ratios including average profit margins, average return on assets and equity and average debt to equity ratio;
o Variance analysis comparing budget to prior year income statement and balance sheet line items.
o Bar charts comparing budgeted income statement and balance sheet to prior year;
o Cash flow charts showing budgeted cash flow movement and balances;
- Actual vs Budget and Prior Year Dashboard with:
o Summarised projected Income Statement, Balance Sheet and Cash Flow for Year to date for Actuals, budget and prior year;
o List of key ratios including average profit margins, average return on assets and equity and average debt to equity ratio for actuals, budget and prior year;
o Variance analysis comparing actuals, budget and prior year income statement, cash flow and balance sheet line items.
o Bar charts comparing actual, budget and prior year cumulative revenue, EBITDA, operating cash flow, balance sheet totals and cash flow breakdown.
KEY INPUTS
Setup Inputs:
- Name of business;
- Currency;
- Financial Year-end;
- Budget Year;
- Latest Actuals Used for Budget Preparation;
- Latest Actuals for Comparison to Budget.
- Naming for revenue streams, direct expenses, staff, marketing costs, other operating costs, fixed assets and borrowings;
- Sales tax applicability for revenue, direct costs, other expenses and fixed assets.
Actuals Inputs:
- Income Statement actuals by month;
- Balance sheet balances by month.
Budget Assumption Inputs:
- Revenue assumptions including average credit terms offered;
- Cost of sales assumptions including cost of sales percentages, credit terms received, safety stock and credit terms received;
- Direct expense assumptions;
- Staff cost inputs including staff numbers, average salary per full time position, average employer’s social security percentage of salary, average annual bonus and bonus payment months.
- Other costs inputs including marketing costs and other operating costs;
- Sales and corporate tax inputs including rate and payment periods;
- Dividend inputs including amount (percentage of retained earnings) and frequency;
- Fixed assets including addition amounts and useful life;
- Borrowings including addition amounts, interest rate and maturity date;
- Share capital additions.
MODEL STRUCTURE
The model comprises of 8 tabs split into input ('i_'), calculation ('c_'), output ('o_’) and system tabs. The tabs to be populated by the user are the input tabs ('i_Setup', ‘i_Actuals’ and 'i_Budget Assump'). The calculation tab uses the user-defined inputs to calculate and produce the projection outputs which are presented in 'o_Budget FinStats' and ‘o_Dashboard’.
KEY FEATURES
- The model contains a flexible timeline that allows for a mix of actual and forecast periods across a 2-year period. This allows projections to be easily rolled forward as forecast periods become actual period;
- Timeline is split on a monthly basis and summarised on an annual basis;
- The model allows the user to model up to 10 revenue streams consisting of products or services each with their own cost of sales, inventory (if applicable) and direct expenses.
- The model is not password protected and can be modified as required following download;
- The model is reviewed using specialised model audit software to help reduce risk of formula inconsistencies;
- The model allows for the following number of underlying categories for each line item (these can be easily expanded if required):
o Revenue Streams – 10 types;
o Direct expenses – 10 categories;
o Staff costs – 15 categories;
o Marketing costs – 5 categories;
o Other expenses – 15 categories;
o Fixed assets – 5 categories;
o Borrowings – 3 facilities
- Apart from budgeting/projecting revenue and costs the model includes the possibility to model fixed assets, borrowings (amortising), dividends and corporate tax;
- Business name, currency, starting projection period are fully customisable;
- Revenue, cost and fixed asset descriptions are fully customisable;
- The model included an integrated cash flow statement calculation for monthly actuals;
- The model includes instructions, line-item explanations, checks and input validations to help ensure input fields are populated accurately;
- The model includes a checks dashboard which summarises all the checks included in the various tabs making it easier to identify any errors.
SUPPORT / MODIFICATIONS
We are keen to ensure our customers are satisfied and find the models useful for their financial projection needs. Our models are developed with the user in mind and include instructions, line-item explanations, checks and input validations to ensure they are as user-friendly and easy to use as possible without requiring extensive knowledge of Microsoft Excel, finance or accounting. If any questions do arise, we are more than happy to assist. We are also happy to support with any be-spoke modifications you may require to the models to better suit your business needs. To get in touch, please send us a message through the website
We are also always keen to receive feedback so please do let us know what you think of our models by sending us a message or submitting a review.
ABOUT PROJECTIFY
We are financial modelling professionals with experience working in big 4 business modelling teams and strong experience supporting businesses with their financial modelling and decision support needs. Our aim is to provide robust and easy-to-use tools that follow good practice financial modelling guidelines and assist individuals and businesses with their financial projection and analysis requirements.
This Best Practice includes
1 Excel model with populated example and 1 Excel model without populated example
Further information
Excel model/template for the preparation of a monthly budget and to track actual performance against budget and prior year
Business looking to prepare a budget and track actual performance against budget and prior year
