

Originally published: 05/10/2021 09:52
Publication number: ELQ-39543-1
View all versions & Certificate
Publication number: ELQ-39543-1
View all versions & Certificate

Gaming Company Financial Model in Excel
Gaming Company Financial Model in Excel
Expert in performance improvement and restructuring with significant experienceFollow 444
Description
Gaming Company Financial Model in Excel
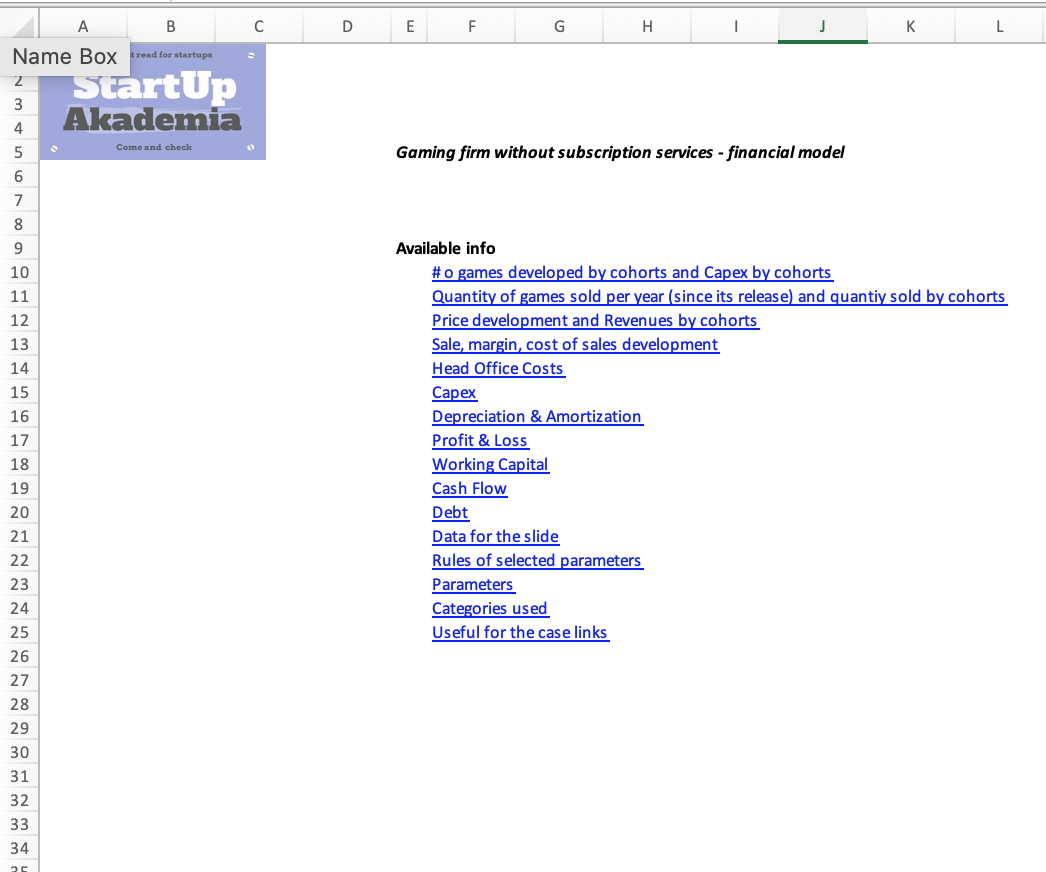
More and more firms move to the design and production of games. Gaming is not easy as you have to take into account the big seasonality of the sales and huge Capex that you need to create a game. That’s why we have created a model that will help you forecast your revenues and profits based on the number of games released. This is an annual model. By altering the cells in blue you can adjust the model to your needs.
A few information about the model
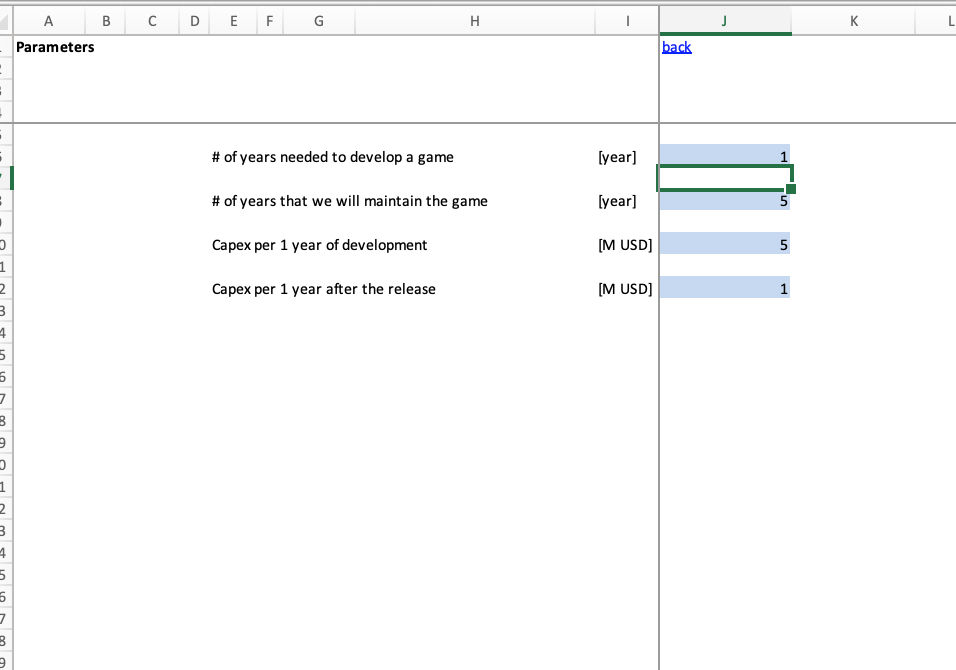
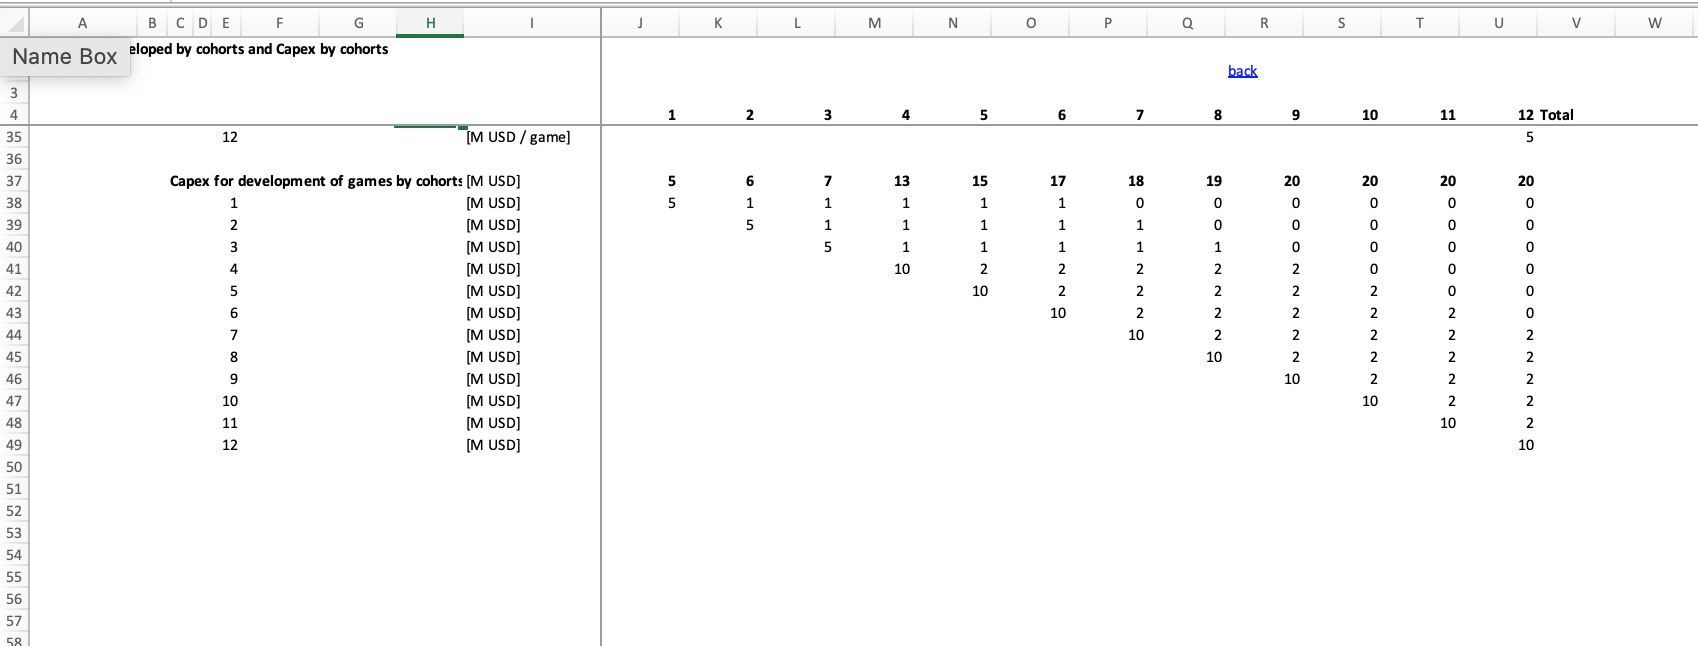
1. Games Sold. In sheet Games, we model the number of games produced every year. We also estimate the CAPEX per game (both for releasing and updating). Based on that in the sheet “Quantity” we forecast how many pieces of games in total you will sell given the old and new games. Estimations are based on the number of games released from the sheet “Games” and assumed average sales per 1 game for every year since its release. The sale of a specific game is assumed to go down as the age of the game increase. Finally, in the sheet “Price” we estimate the revenues per every cohort and the average implied price per game sold.
2. Sales & Margin. In the sheet Sales & Margin, we model revenues, gross margin, cost of acquisition, retention.
3. Capex. Capex is calculated in sheet Capex, based on the Games released (in the sheet “Games”. In a separate sheet (Depreciation) we model the Depreciation by cohorts and Net Value of Assets. We do that by cohorts.
4. Head Office costs. These costs are calculated in the sheet HQ.
5. Profit and Loss statement. Based on data from previous sheets in the sheet P&L we generate the Profit and Loss statement.
6. Working Capital. Working Capital is calculated in the sheet Work Cap, based on sales and conversion periods assumed for inventory, receivables, and payables.
7. Debt. We assume that the growth will be partially financed by Debt. In this sheet, we calculate the Debt at the end of the year based on assumed loans that we take and repayment of the loans. We also calculate here the financial costs and profits.
8. Cash Flow. Finally, in the sheet CF, we calculate the cash flow based on data from previous sheets
Gaming Company Financial Model in Excel
More and more firms move to the design and production of games. Gaming is not easy as you have to take into account the big seasonality of the sales and huge Capex that you need to create a game. That’s why we have created a model that will help you forecast your revenues and profits based on the number of games released. This is an annual model. By altering the cells in blue you can adjust the model to your needs.
A few information about the model
1. Games Sold. In sheet Games, we model the number of games produced every year. We also estimate the CAPEX per game (both for releasing and updating). Based on that in the sheet “Quantity” we forecast how many pieces of games in total you will sell given the old and new games. Estimations are based on the number of games released from the sheet “Games” and assumed average sales per 1 game for every year since its release. The sale of a specific game is assumed to go down as the age of the game increase. Finally, in the sheet “Price” we estimate the revenues per every cohort and the average implied price per game sold.
2. Sales & Margin. In the sheet Sales & Margin, we model revenues, gross margin, cost of acquisition, retention.
3. Capex. Capex is calculated in sheet Capex, based on the Games released (in the sheet “Games”. In a separate sheet (Depreciation) we model the Depreciation by cohorts and Net Value of Assets. We do that by cohorts.
4. Head Office costs. These costs are calculated in the sheet HQ.
5. Profit and Loss statement. Based on data from previous sheets in the sheet P&L we generate the Profit and Loss statement.
6. Working Capital. Working Capital is calculated in the sheet Work Cap, based on sales and conversion periods assumed for inventory, receivables, and payables.
7. Debt. We assume that the growth will be partially financed by Debt. In this sheet, we calculate the Debt at the end of the year based on assumed loans that we take and repayment of the loans. We also calculate here the financial costs and profits.
8. Cash Flow. Finally, in the sheet CF, we calculate the cash flow based on data from previous sheets
This Best Practice includes
1 Excel model
