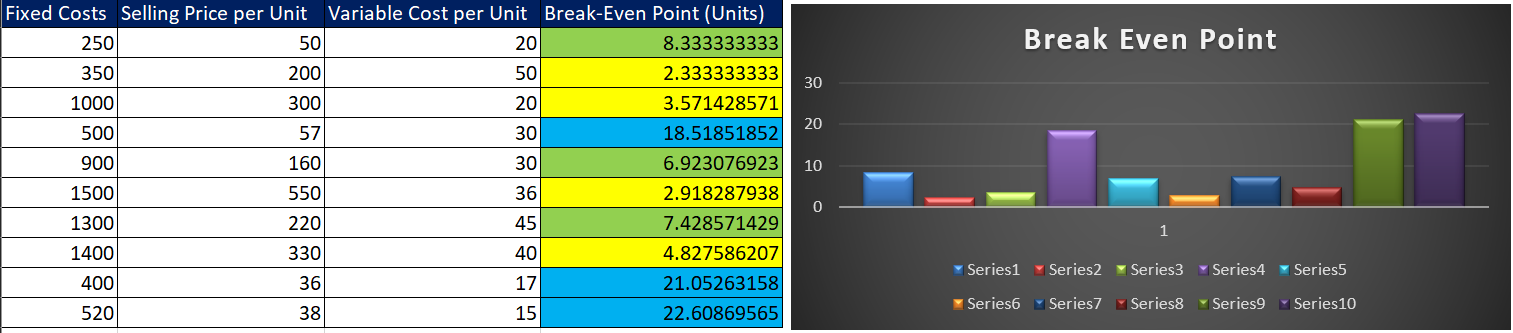
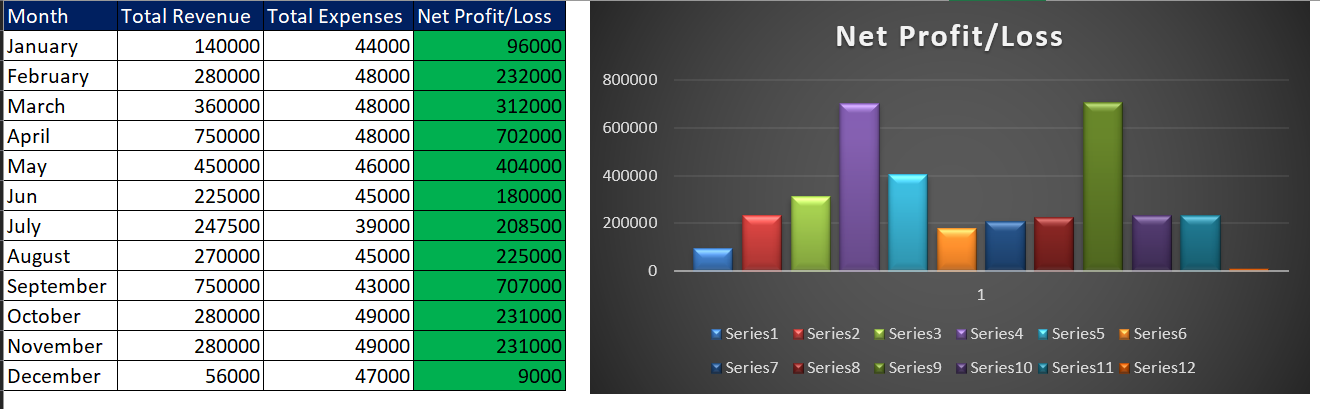
Cash flow, Revenue, profit/ loss and expanses flow chart template
Originally published: 17/03/2026 15:35
Publication number: ELQ-68116-1
View all versions & Certificate
certified

Cash flow, Revenue, profit/ loss and expanses flow chart template

To create the Cash flow, Revenue, profit/ loss and expenses flow chart template

Description

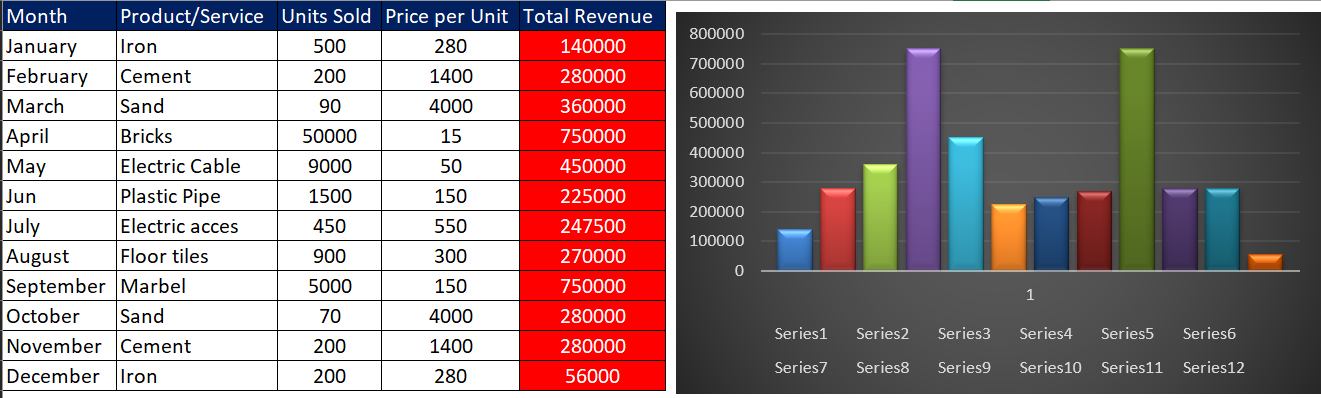
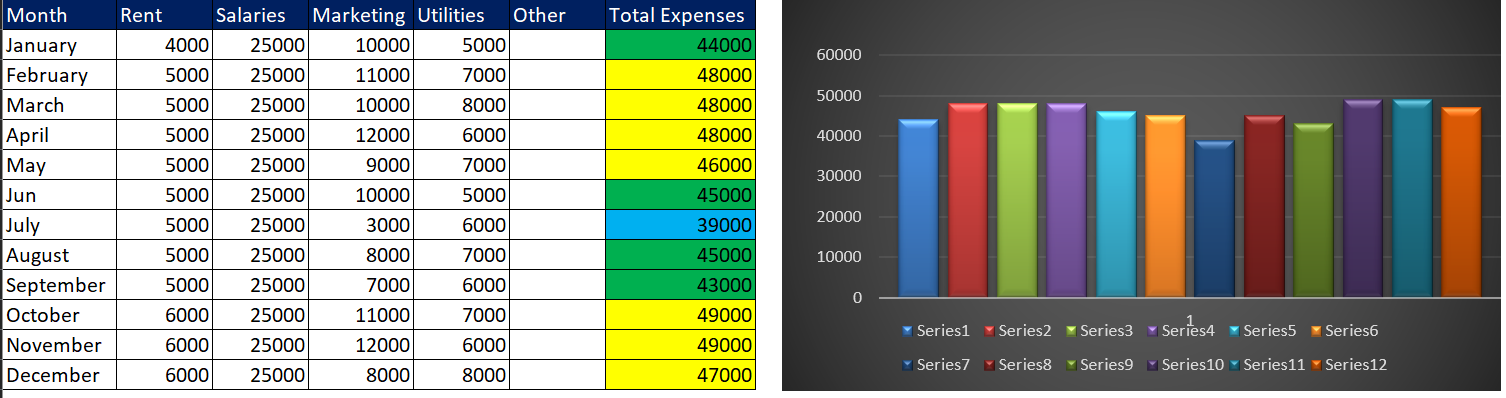
This cash flow, revenue, profit/loss, and expenses flow chart template is a visual tool used to understand how money moves through a business. The flow chart begins with revenue, which represents the total income generated from sales of products or services. This revenue enters the business and becomes the starting point of the financial process. From this income, the business pays its expenses, which may include operational costs such as salaries, rent, utilities, materials, marketing, and other administrative costs.

The flow chart then shows how revenue minus expenses determines the profit or loss of the business. If the total revenue is greater than the total expenses, the result is profit, which indicates that the business is financially successful during that period. However, if expenses exceed revenue, the business experiences a loss, meaning it has spent more money than it earned.

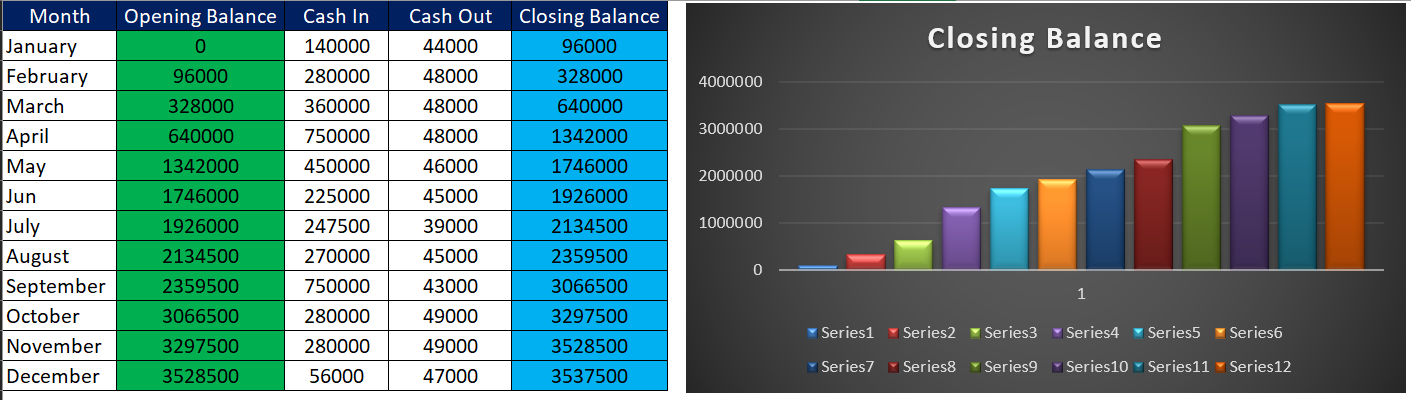
Another important component illustrated in the flow chart is cash flow. Cash flow tracks the actual movement of cash entering and leaving the business. Positive cash flow occurs when cash inflows from sales and other sources are greater than the cash outflows for expenses and investments. Negative cash flow occurs when more money is leaving the business than coming in.

Overall, this flow chart helps managers and stakeholders easily analyze financial performance, control expenses, and make better financial decisions for sustainable business growth.

This Best Practice includes
2 MS Excel documents

Acquire business license for $5.00

Add to cart

Add to bookmarks

Discuss


0.0 / 5 (0 votes)

please wait...