Garments Business Performance Dashboard | Excel Sales, Inventory & Revenue Management Template
Originally published: 24/04/2026 08:47
Publication number: ELQ-67852-1
View all versions & Certificate
certified

Garments Business Performance Dashboard | Excel Sales, Inventory & Revenue Management Template

Interactive Excel dashboard to monitor garments sales, inventory, revenue, expenses, and key business performance KPIs in one dynamic view.

Description
Garments Business Dashboard – Excel Analytics Template | Sales, Profit, and Inventory Insights

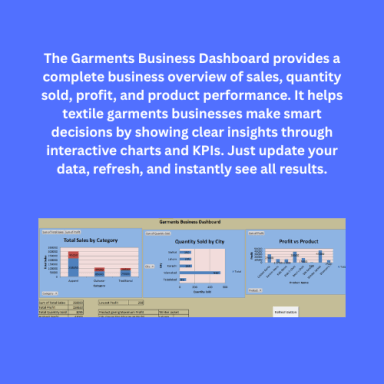
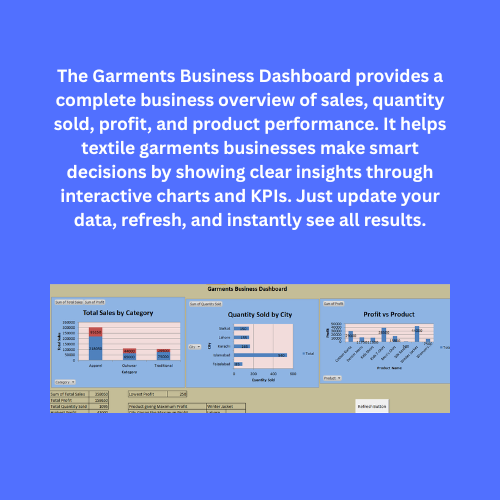
Take full control of your garments or textile business with this professional Excel Dashboard, designed to give you instant insights into your sales, profit, product performance, and city-wise business growth.

Whether you run a boutique, wholesale shop, clothing brand, tailoring unit, online store, or garments supply business — this dashboard helps you make smarter, faster, data-driven decisions.

This ready-to-use Excel file includes clean input sheets, automated formulas, and beautifully organized charts that update instantly when you add your own data.

What’s Inside the Dashboard

Your Excel file includes:

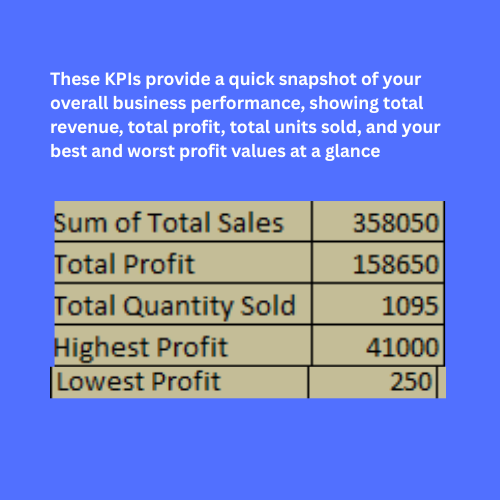
1. KPI Cards (Key Performance Indicators)
Get instant summary of:
· Total Sales (Revenue)
· Total Profit
· Total Quantity Sold
· Highest Profit
· Lowest Profit
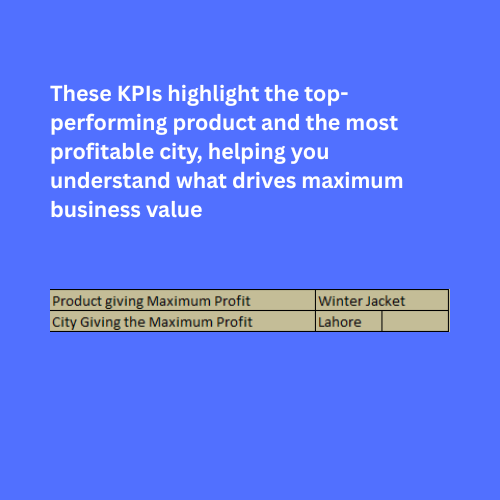
· City giving Maximum Profit
· Product giving Maximum Profit

2. Automated Business Charts
Beautiful, clean visuals:
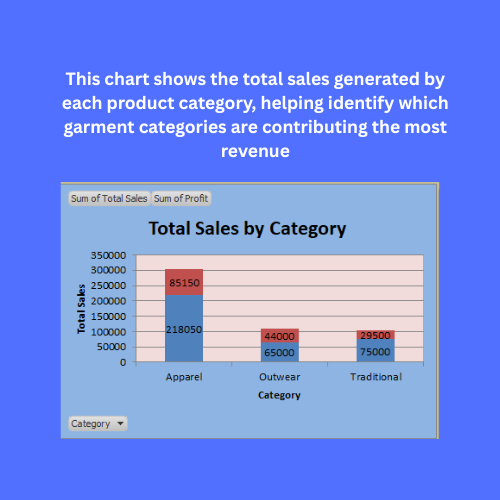
· Total Sales by Category (Column Chart)
See which clothing category (Shirts, Jeans, Trousers, Kidswear, etc.) brings in the most revenue.
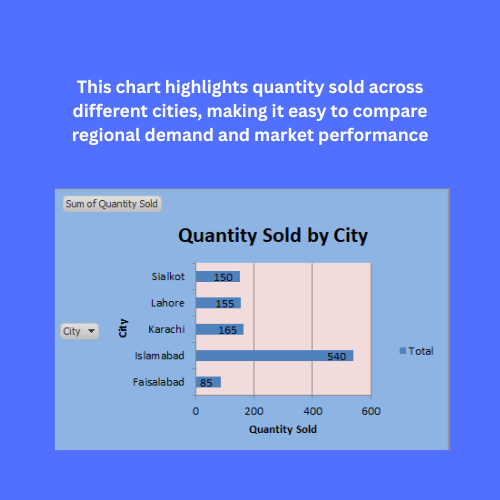
· Quantity Sold by City (Bar Chart)
Instantly compare performance across different Pakistani or international cities.
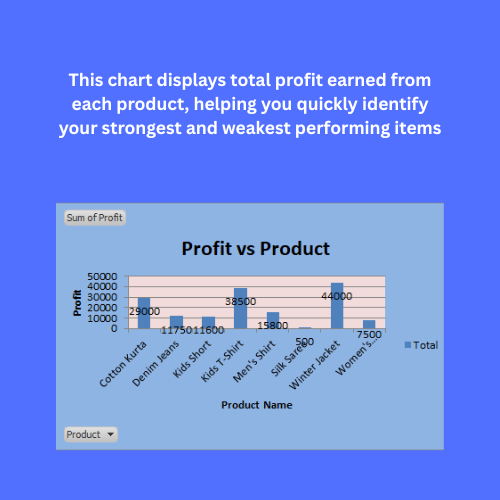
· Profit by Product (Column Chart)
Find out which product generates maximum profit.
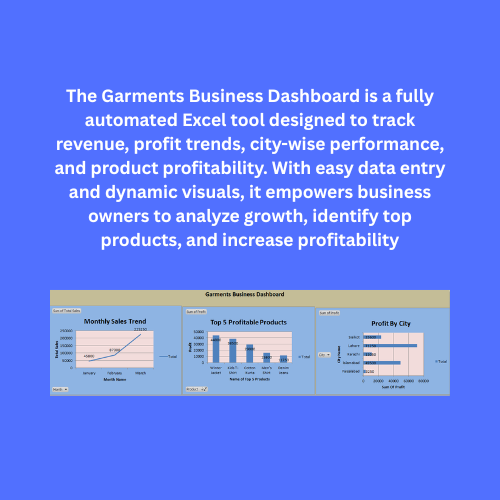
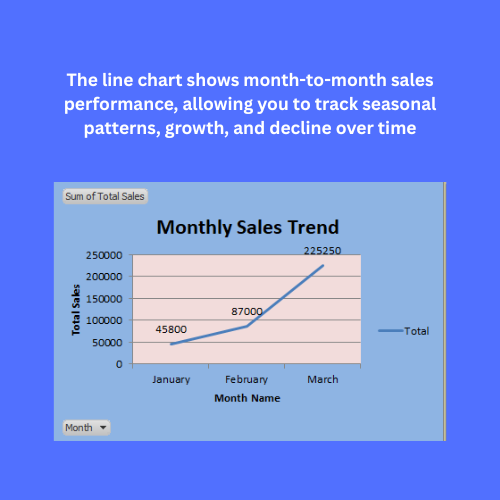
· Monthly Sales Trend (Line Chart)
See growth, dips, and patterns month-by-month.
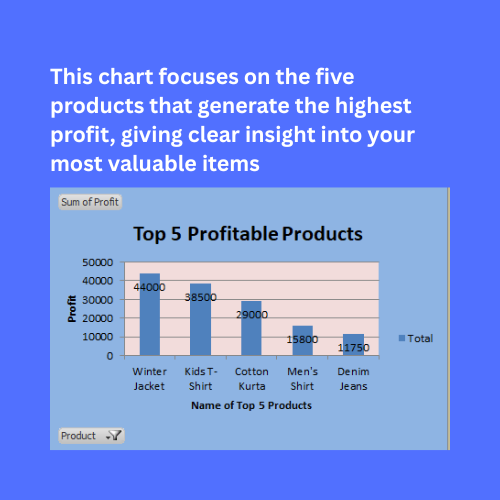
· Top 5 Most Profitable Products (Column Chart)
A quick way to plan stocking and promotions.
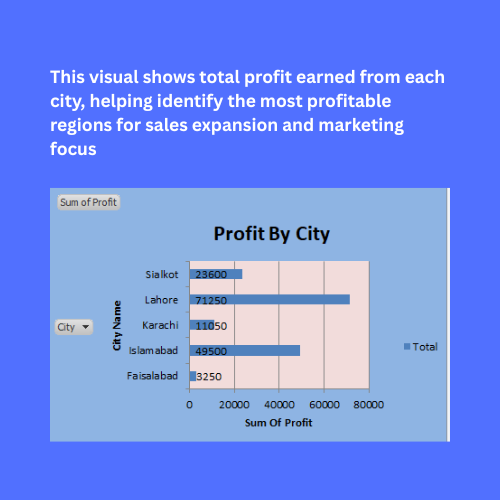
· Profit by City (Bar Chart)
Identify your strongest and weakest markets.

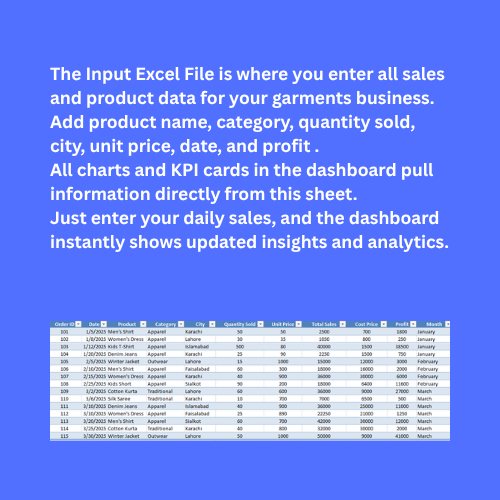
3. Easy-to-Use Input Sheet
Just enter your sales data in input sheet No 2 with columns like:
· Order ID
· Date
· Product
· Category
· City/Region
· Quantity Sold
· Unit Price
· Total sales
· Cost Price
· Profit (auto-calculated)
· Month

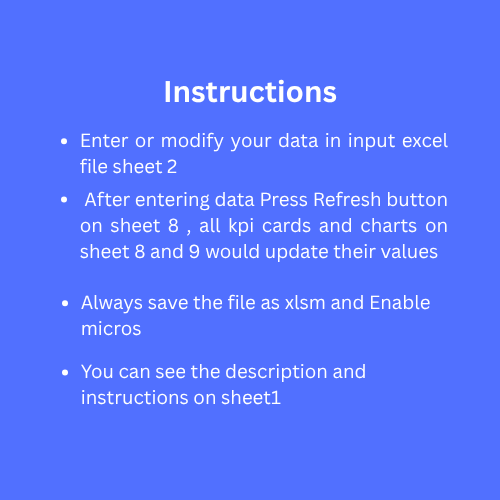
After entering data press Refresh button on sheet 8, Everything else — KPIs, charts, insights — updates automatically.

This Best Practice includes
1 excel dashboard file (xlsm) with instruction set

Acquire business license for $25.00

Add to cart

Add to bookmarks

Discuss

Further information

1. Objectives of This Downloadable Best Practice
Monitor garments sales performance through dynamic Excel charts and KPI cards.
Track revenue, expenses, and profit trends for better financial decision-making.
Analyze product-wise or category-wise sales to identify top-performing items.
Monitor stock levels and inventory movement to avoid shortages or overstocking.
Evaluate business performance using KPIs such as total sales, profit margin, and units sold.
Support data-driven decisions for retail shops, boutiques, wholesalers, and garment businesses.
Reduce manual reporting time through automated calculations and visual dashboards.
Improve transparency in sales and inventory reporting.

2. Conditions for Which This Downloadable Best Practice Applies Best
Garment shops, clothing stores, boutiques, and apparel wholesalers using Excel for reporting.
Small to medium retail businesses needing sales and inventory monitoring.
Business owners who want a visual dashboard for revenue, expenses, and stock analysis.
Users who require an affordable and easy-to-use Excel-based management tool.
Teams preparing monthly, weekly, or daily business performance reports.

3. Conditions for Which This Downloadable Best Practice Does Not Apply Ideally
Businesses using advanced ERP, POS, or cloud-based inventory systems.
Organizations requiring real-time database integration or multi-user live reporting.
Very large retail chains with enterprise-level inventory systems.
Users looking for web-based or mobile dashboard solutions instead of Excel.
Businesses needing barcode, billing, or automated stock scanning systems.


0.0 / 5 (0 votes)

please wait...