

Publication number: ELQ-10388-1
View all versions & Certificate

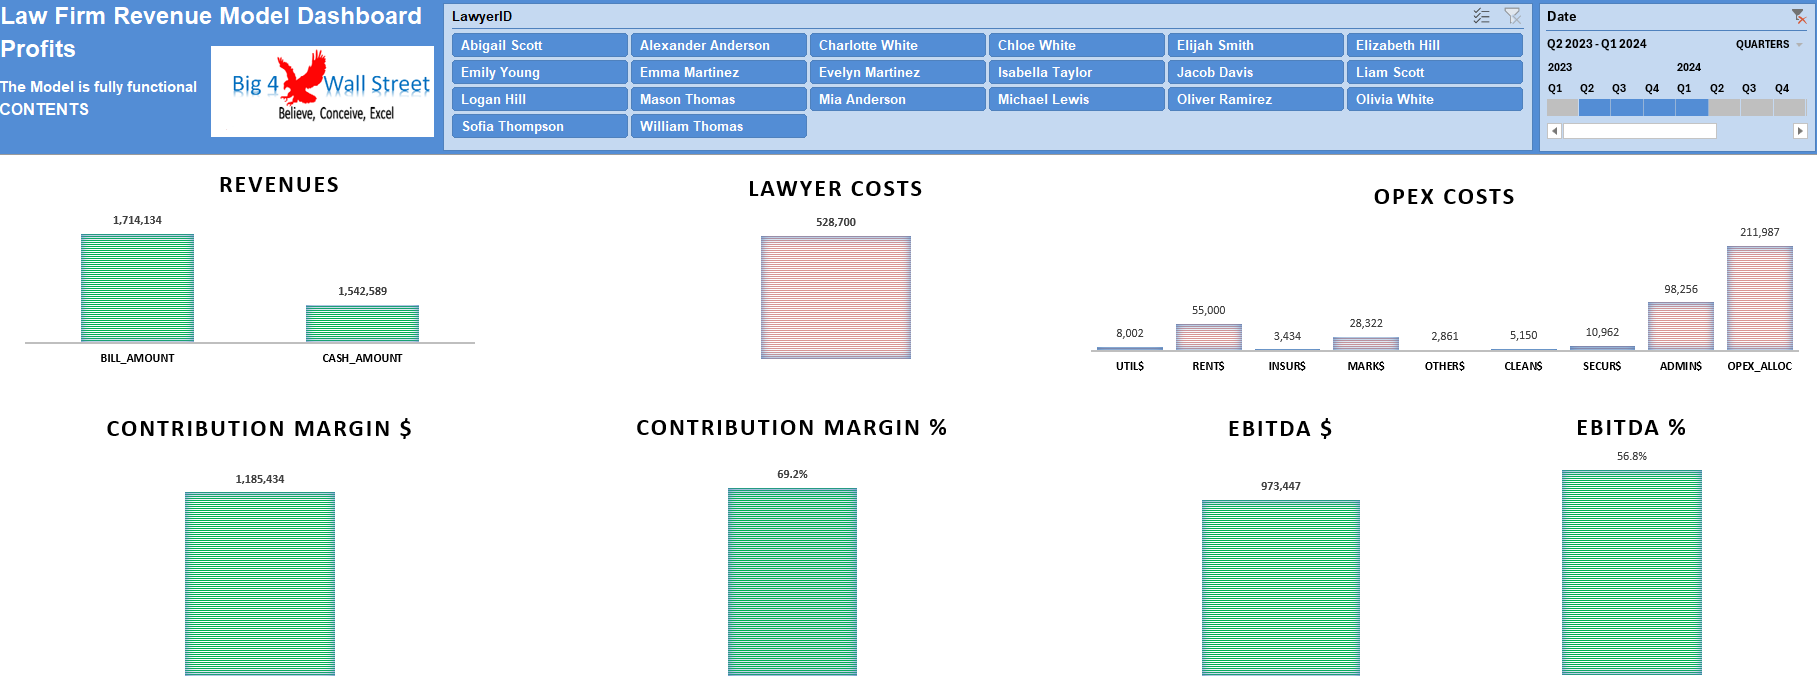
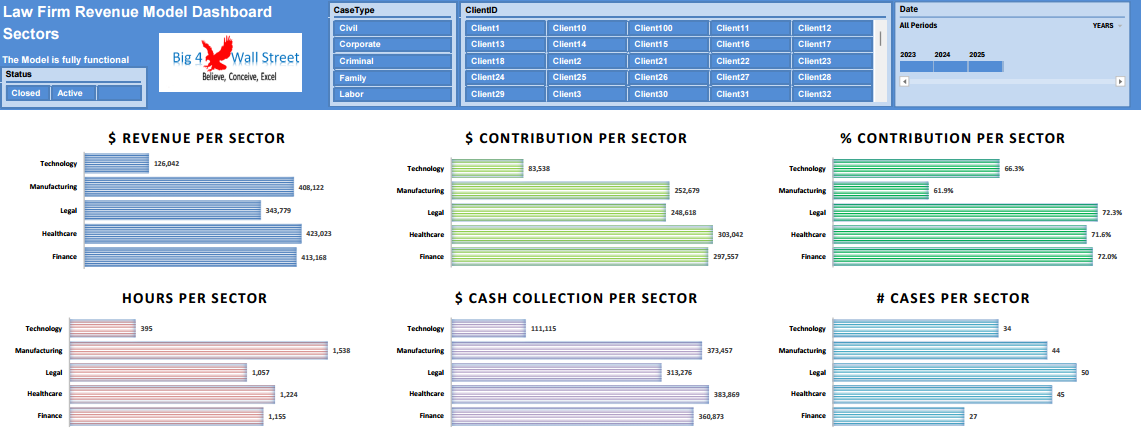
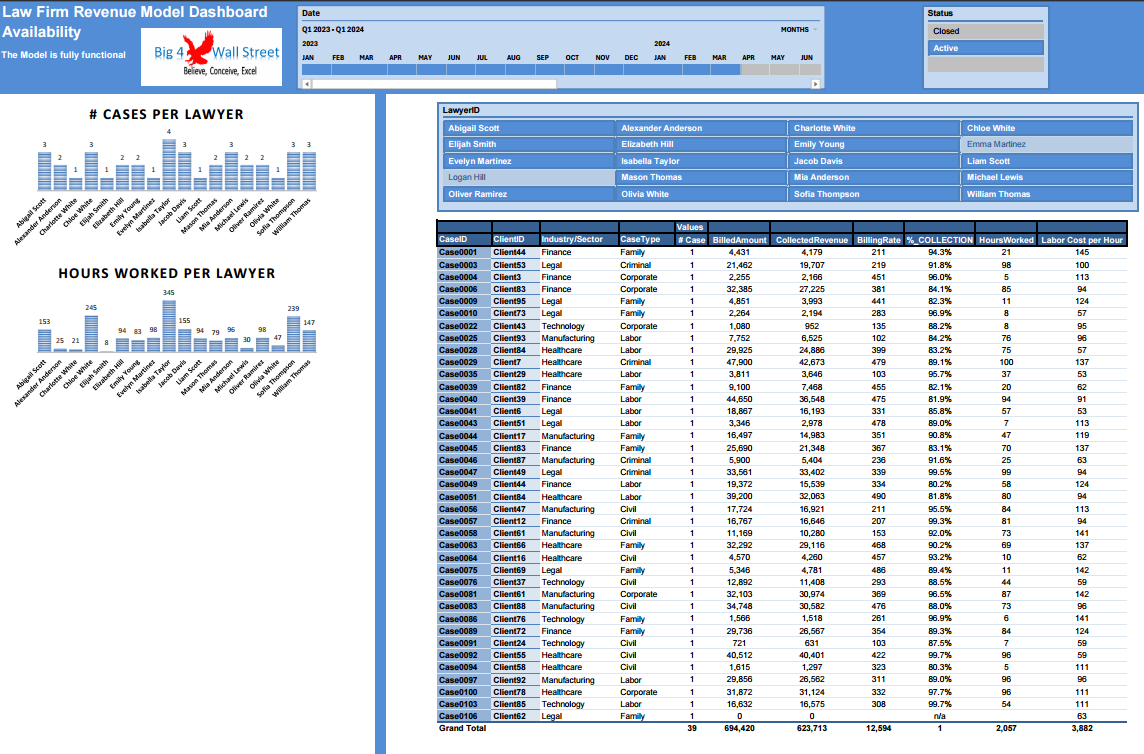
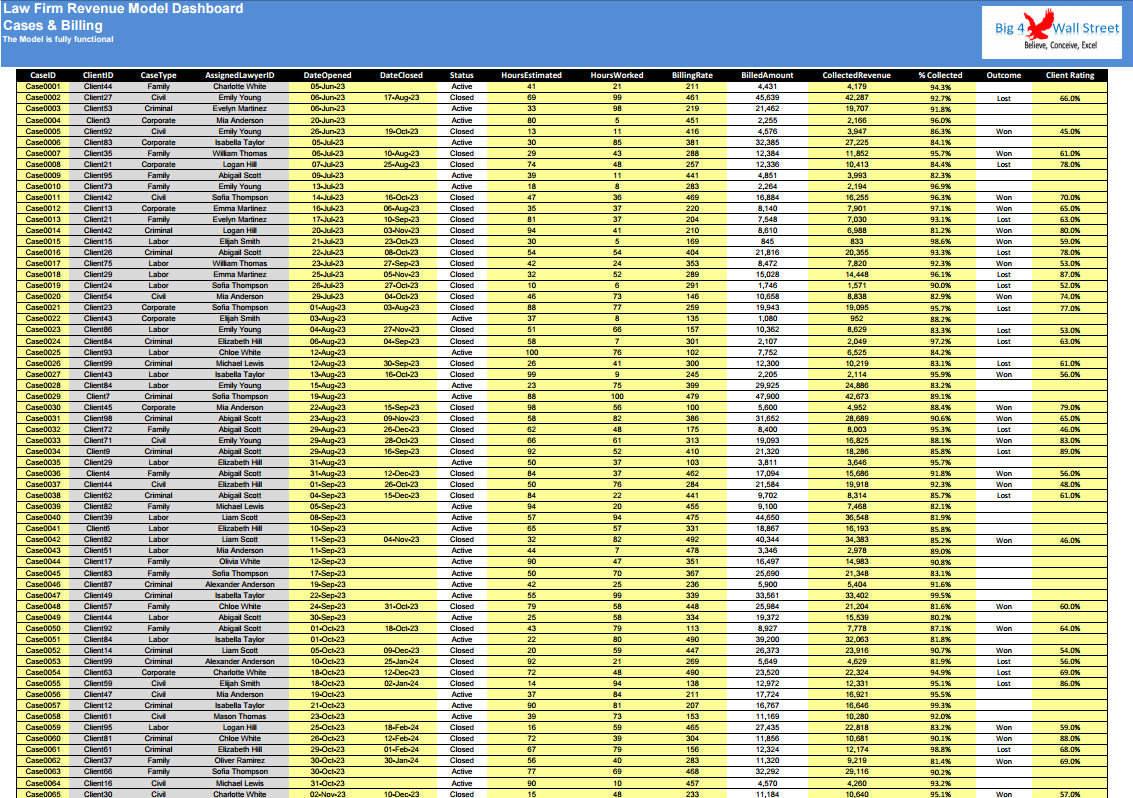
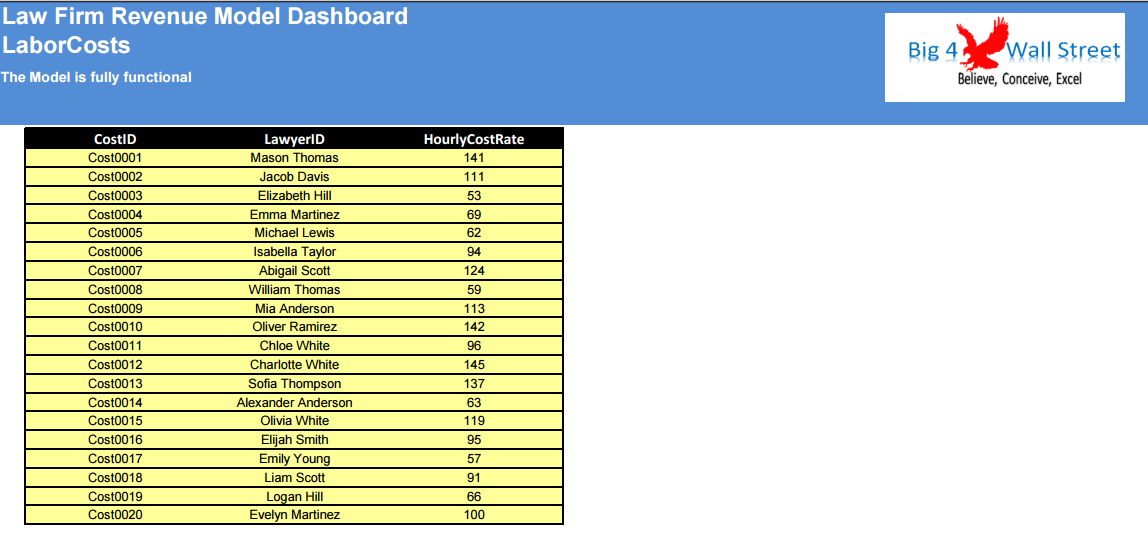
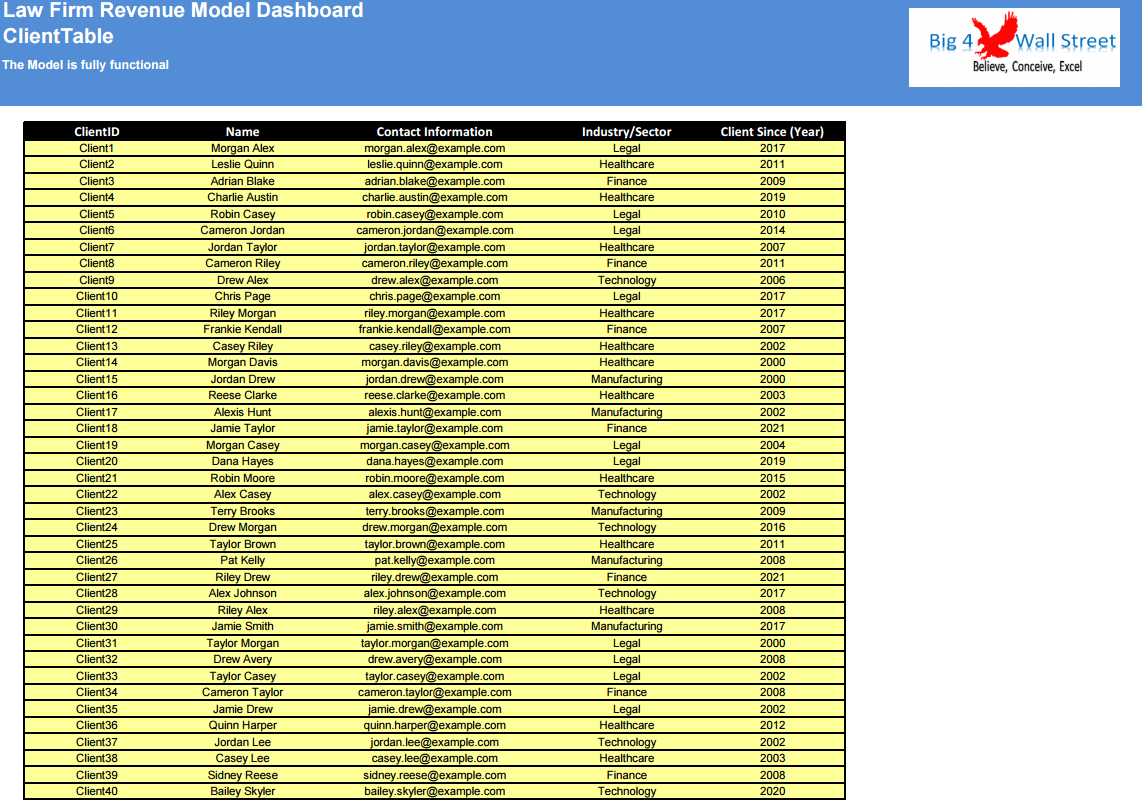
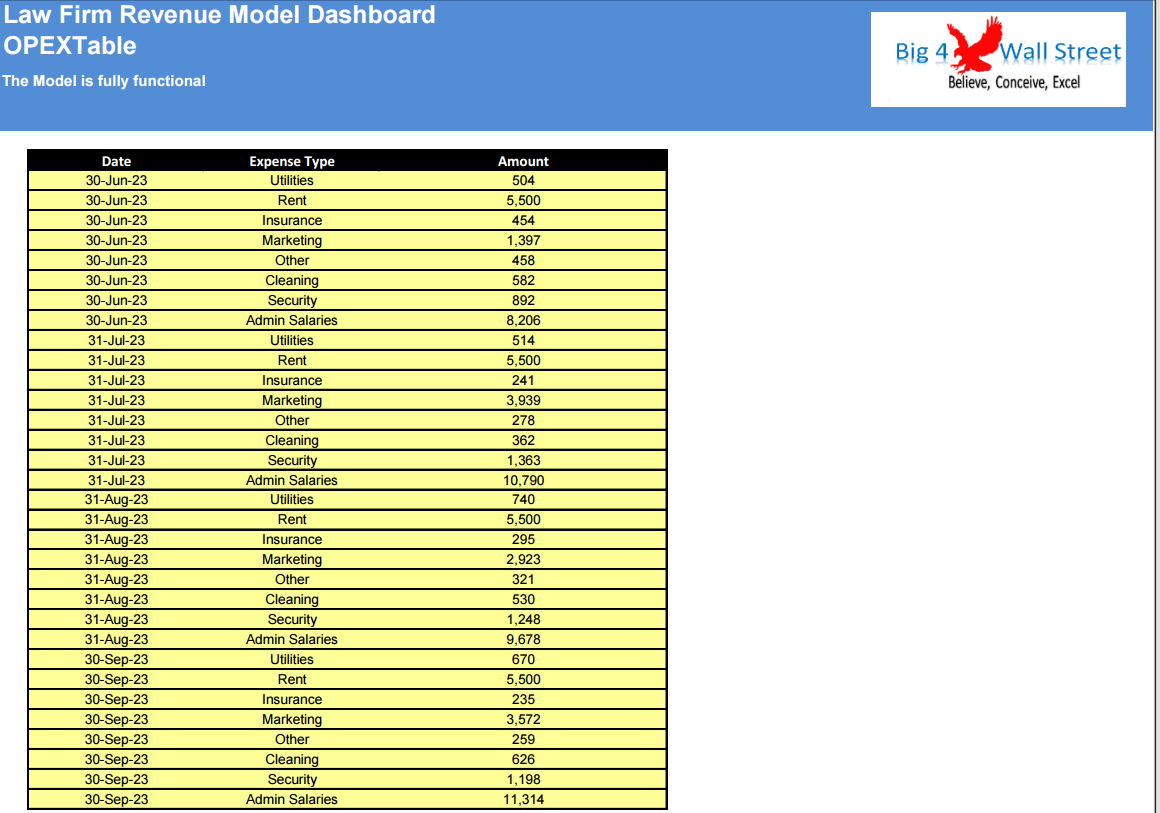
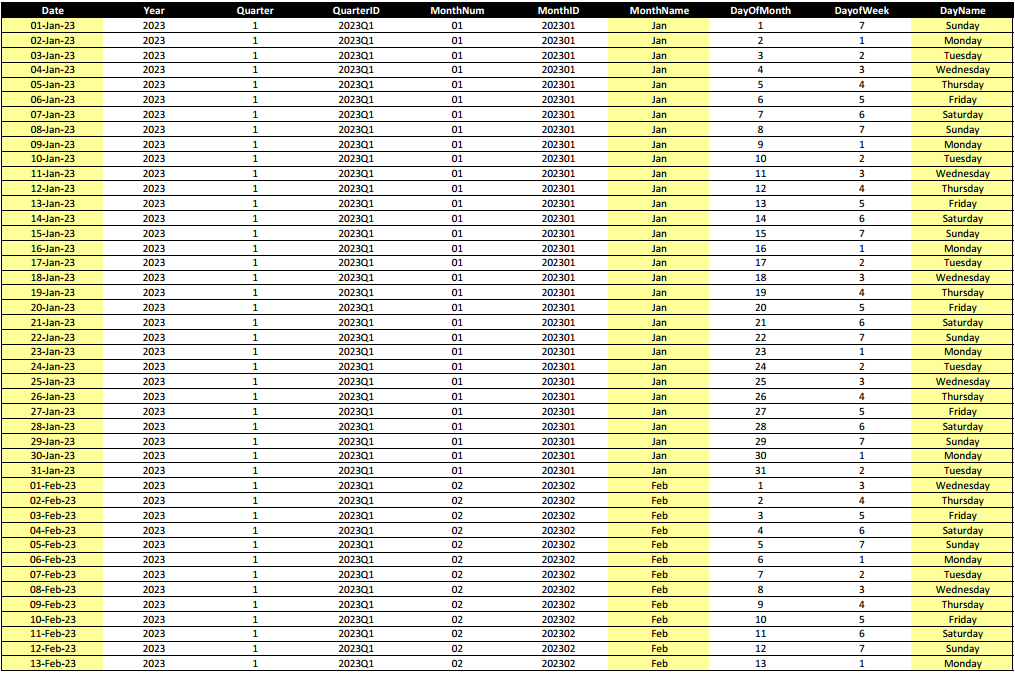
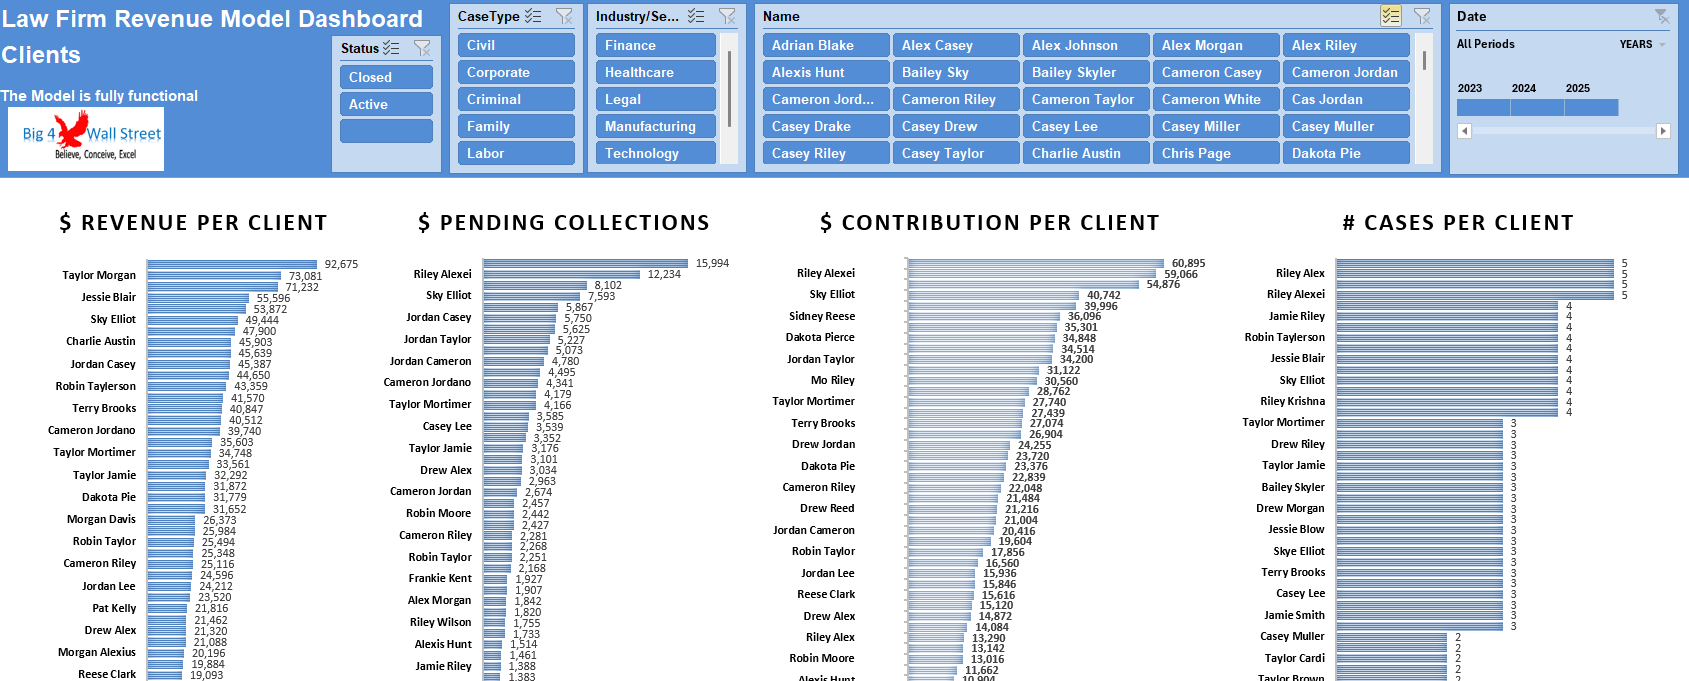
Law Firm Revenue Model Dashboard
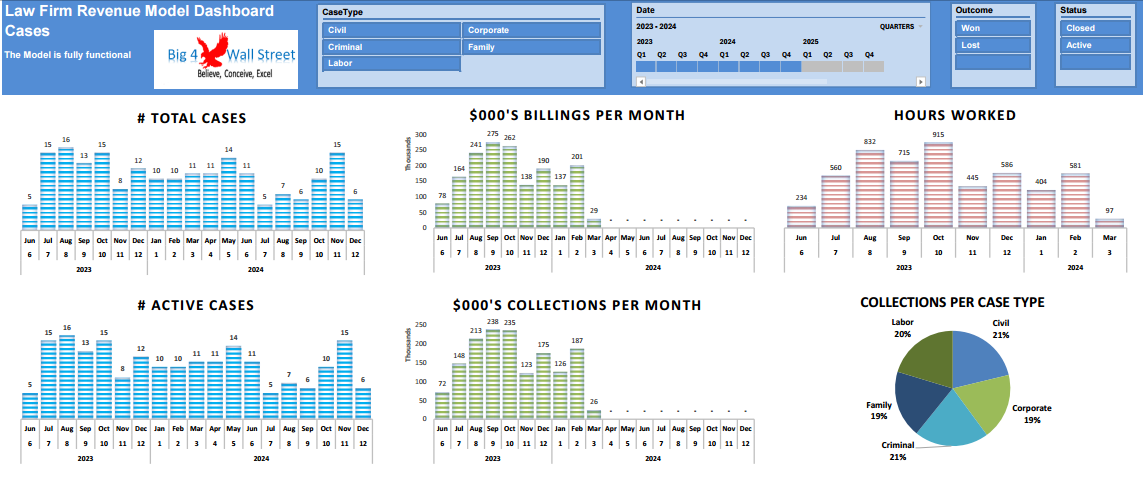
The Law Firm Revenue Model Dashboard is a comprehensive tool designed to provide insights into the financial performance of a law firm.
Further information
- Insights: The Law Firm Revenue Model Dashboard provides insights into the firm's financial performance, allowing stakeholders to make timely and informed decisions.
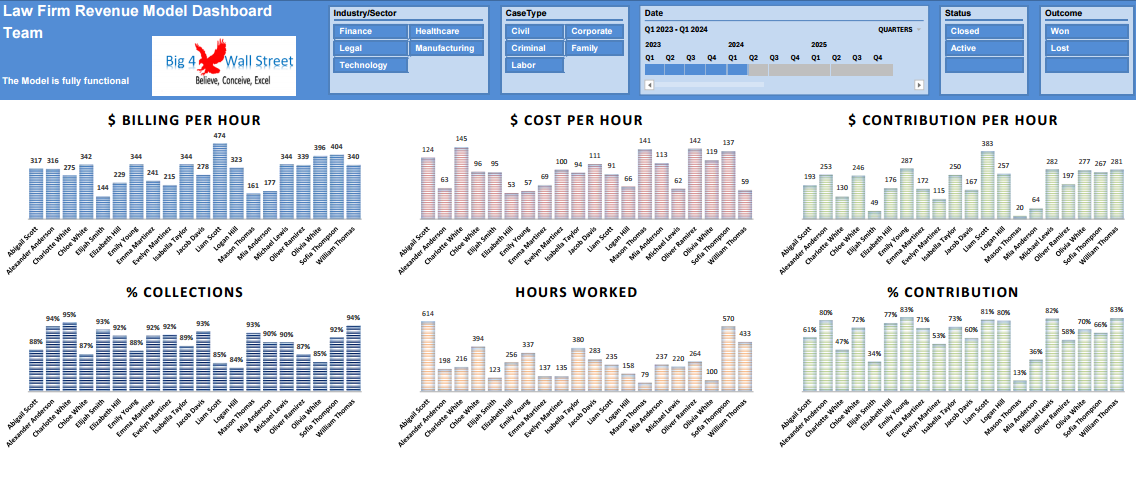
- Financial Management: By tracking cases, hours worked, client billing, and expenses, the dashboard helps in managing the firm's finances effectively and optimizing profitability.
- Strategic Planning: It assists in strategic planning by identifying trends, analyzing performance metrics, and scheduling future cases allocations, enabling the firm to set goals and develop actionable strategies for growth.
- Billing / Client Insights: With insights into client billing and outstanding payments, the dashboard supports client relationship management efforts, facilitating communication and improving client satisfaction.
