

Originally published: 05/10/2021 09:27
Last version published: 05/10/2021 14:01
Publication number: ELQ-27952-2
View all versions & Certificate
Last version published: 05/10/2021 14:01
Publication number: ELQ-27952-2
View all versions & Certificate

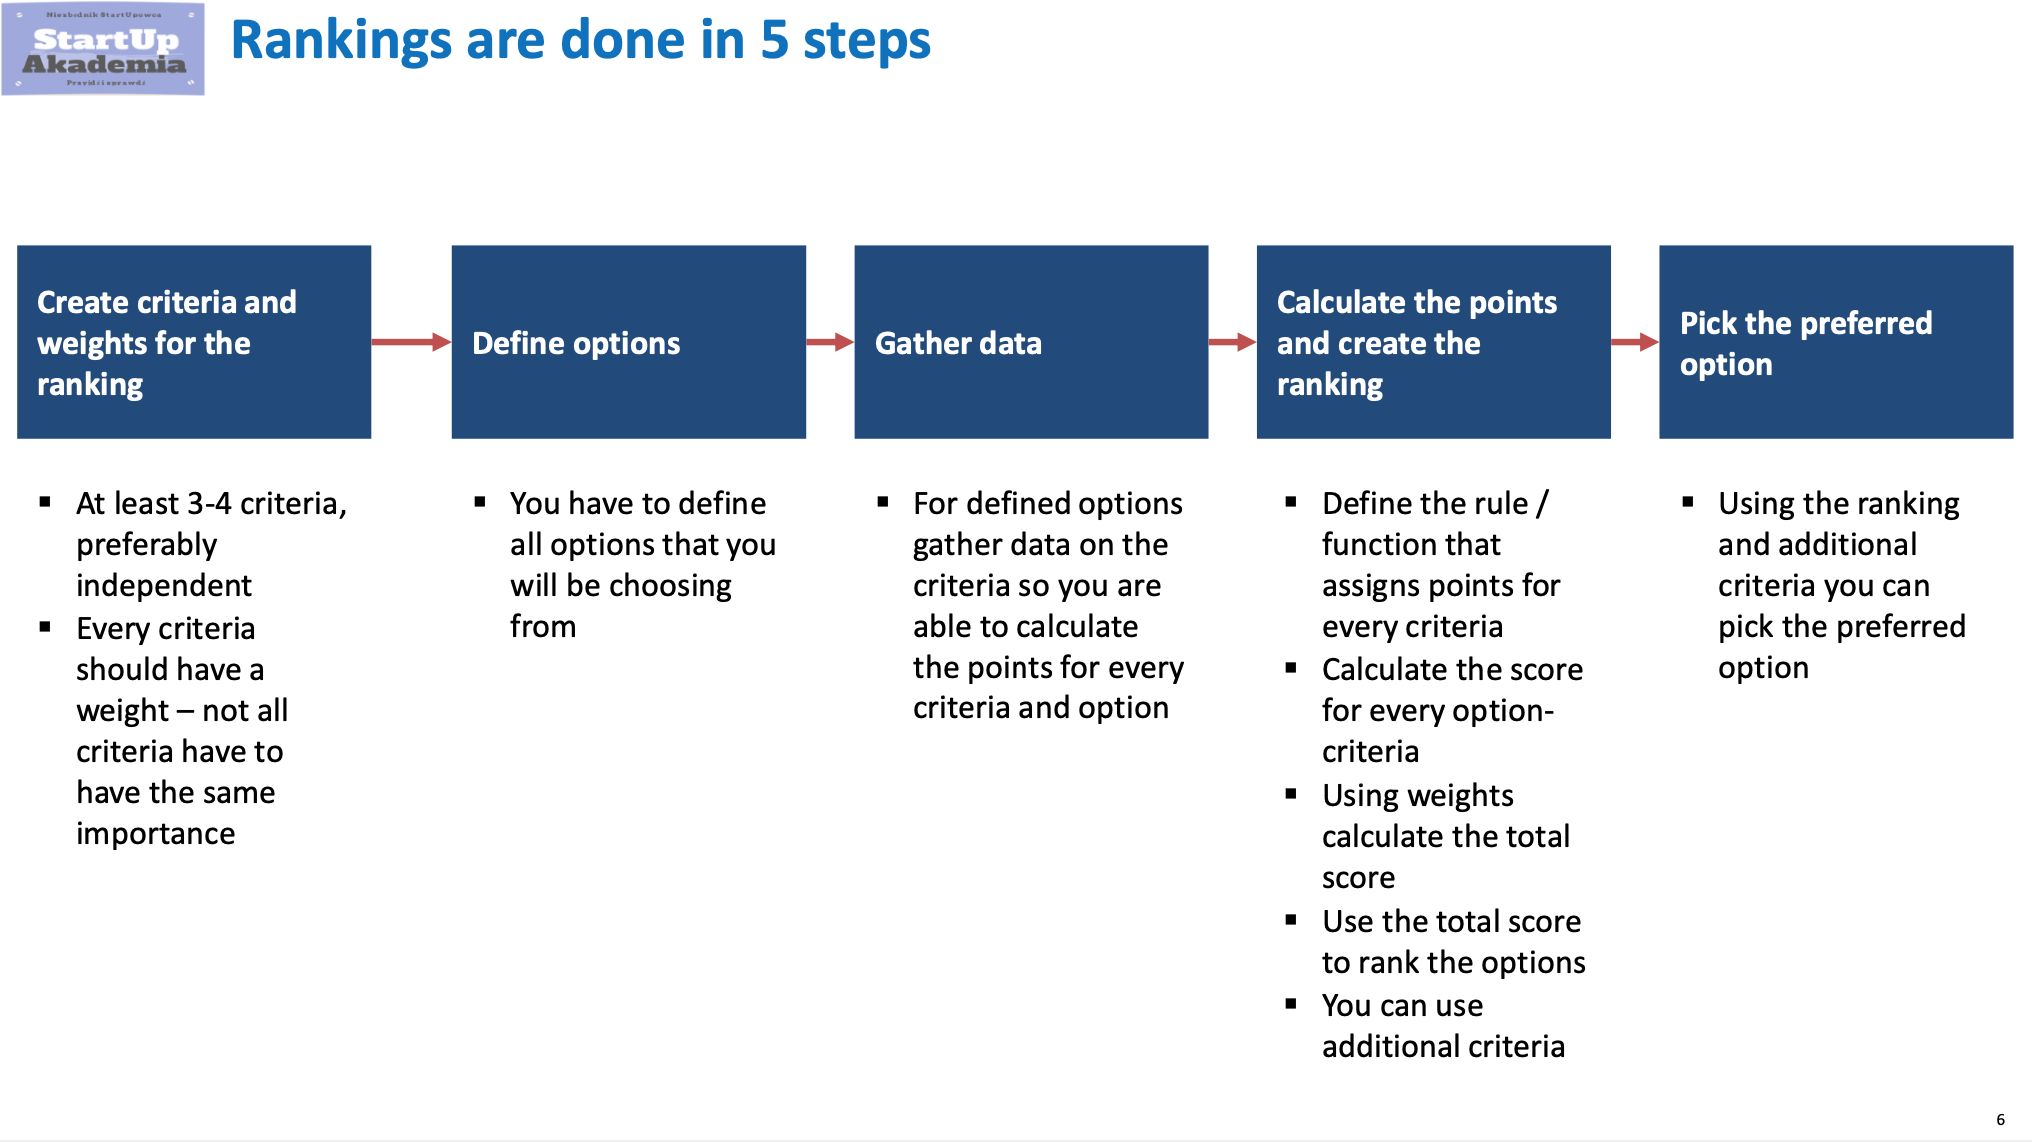
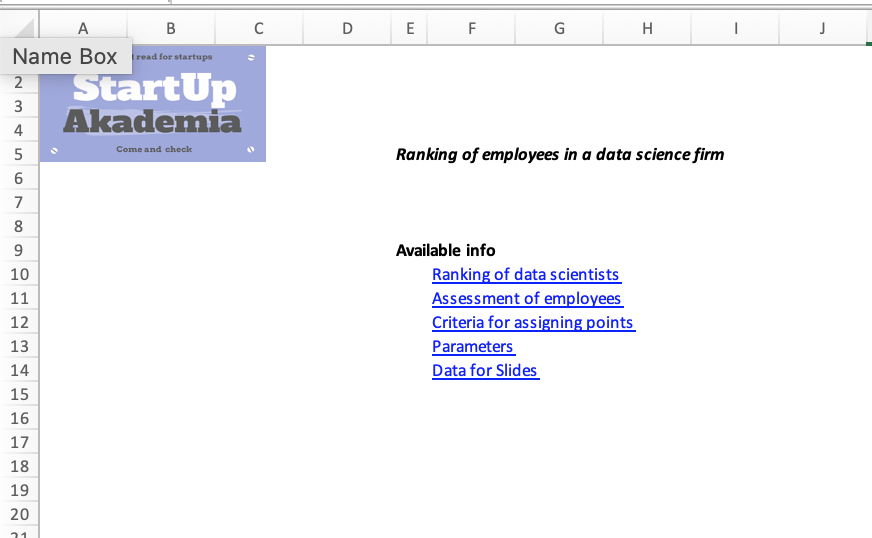
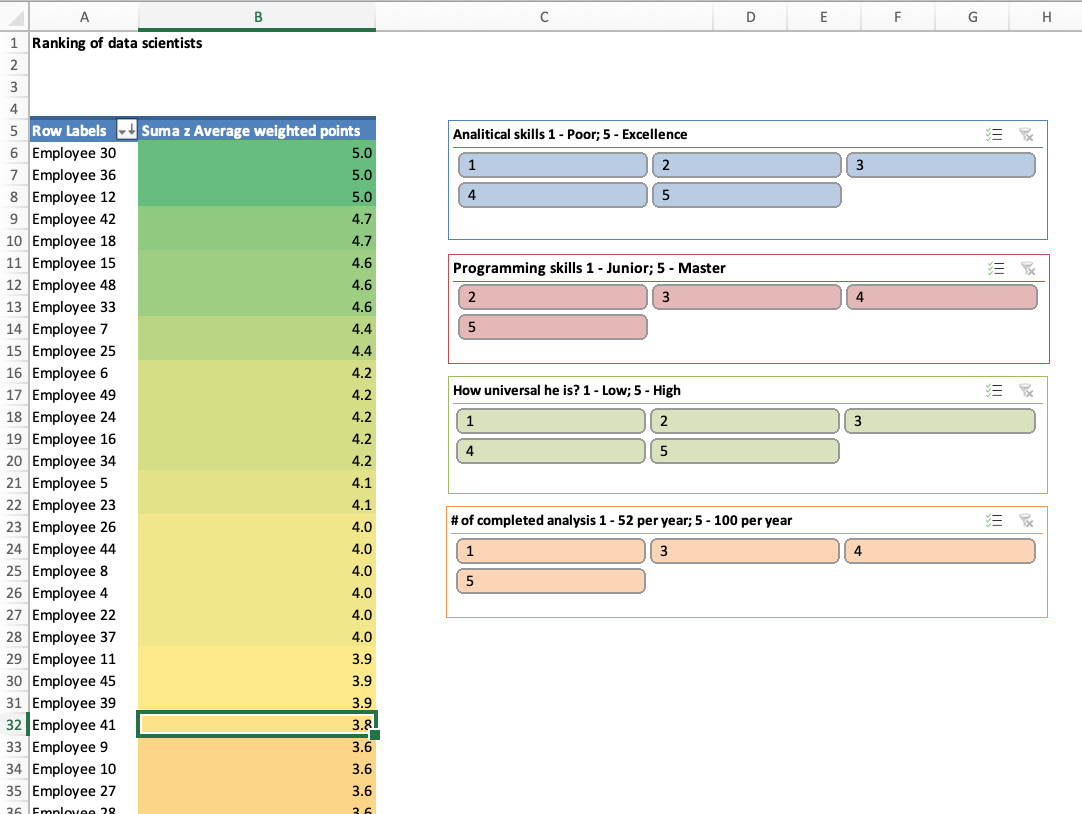
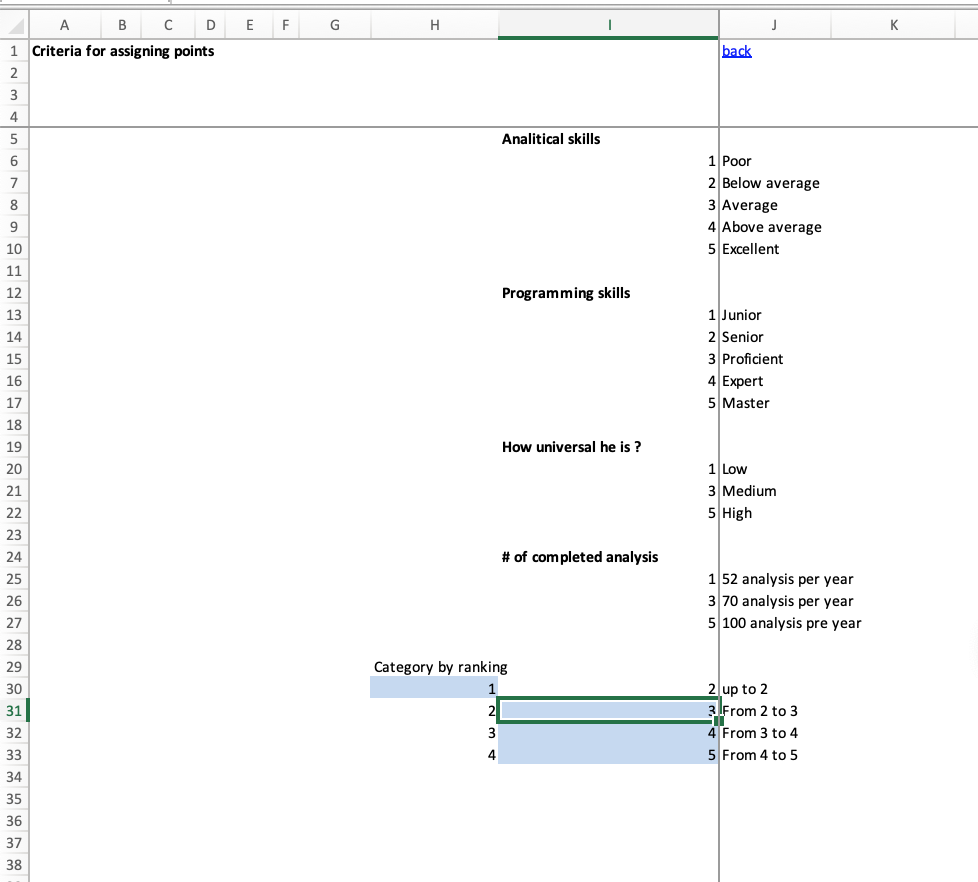
Ranking of Employees in Excel (Management Consulting Projects)
Ranking of Employees in Excel (Management Consulting Projects)
Expert in performance improvement and restructuring with significant experienceFollow 444
