Stock Seasonality Analysis Google Sheets Model
Originally published: 11/06/2018 11:44
Last version published: 11/06/2018 11:47
Publication number: ELQ-57531-2
View all versions & Certificate
certified

Stock Seasonality Analysis Google Sheets Model

Displays stock price as an overlay of successive years

Description
This worksheet generates the five-year history of a stock ticker. It calculates the year price trend of the stocks and overlays with successive years to visualize seasonality trends.

Tabs:
- Inputs
- Stock Price History
- Seasonality Chart

PS: You Need Google Drive to Open the attached file or you can simply access the Google Sheet link in the step-by-step methodology.

This Best Practice includes
Google Sheets

Zim offers you this Best Practice for free!

download for free

Add to bookmarks

Discuss

Further information

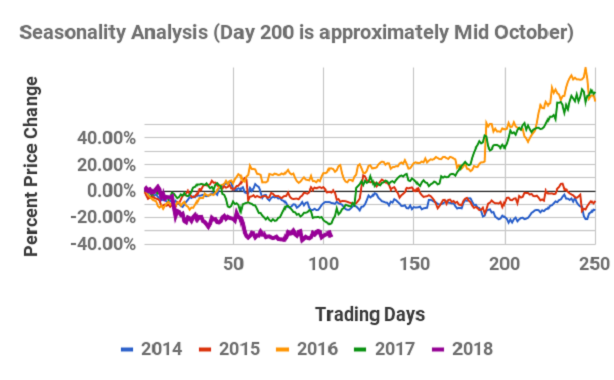
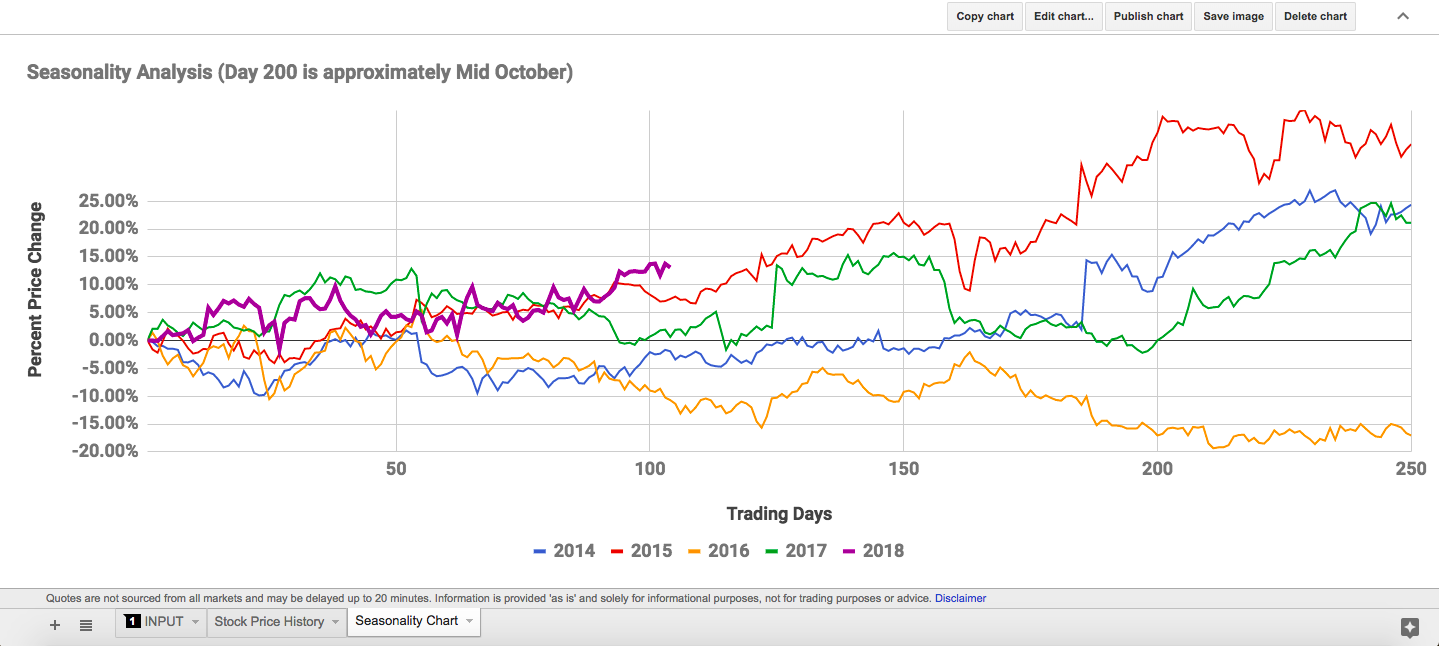
Calculate stock seasonality

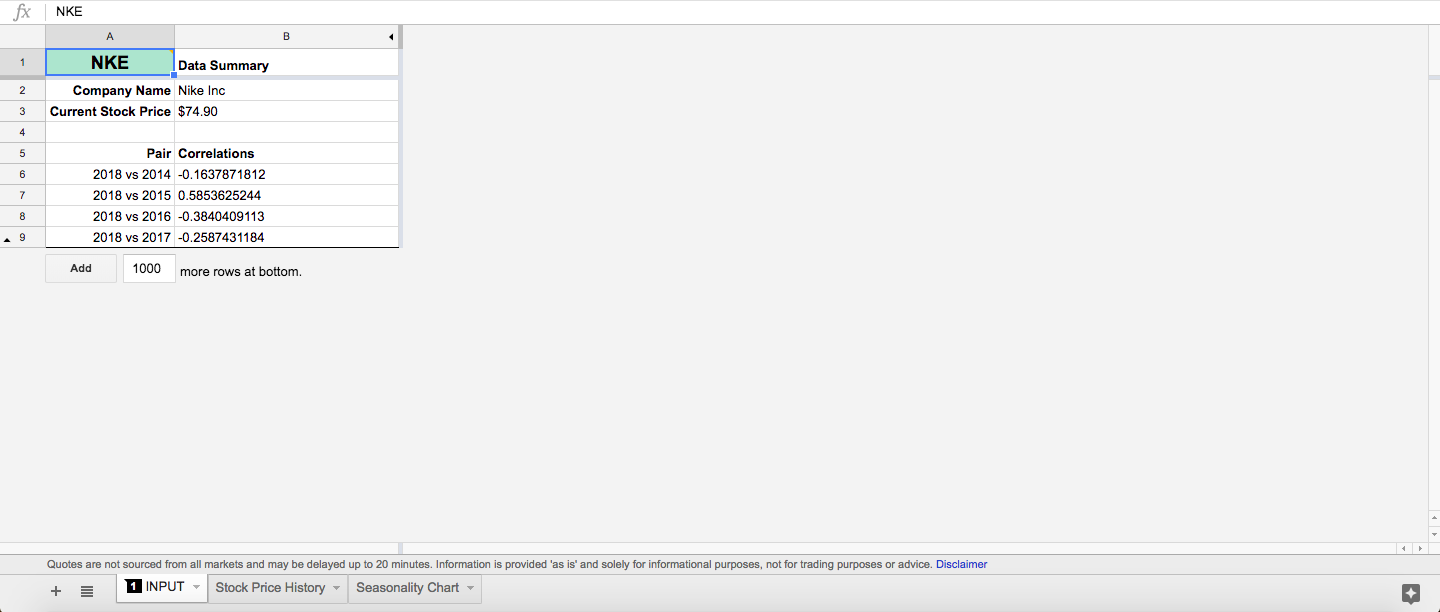
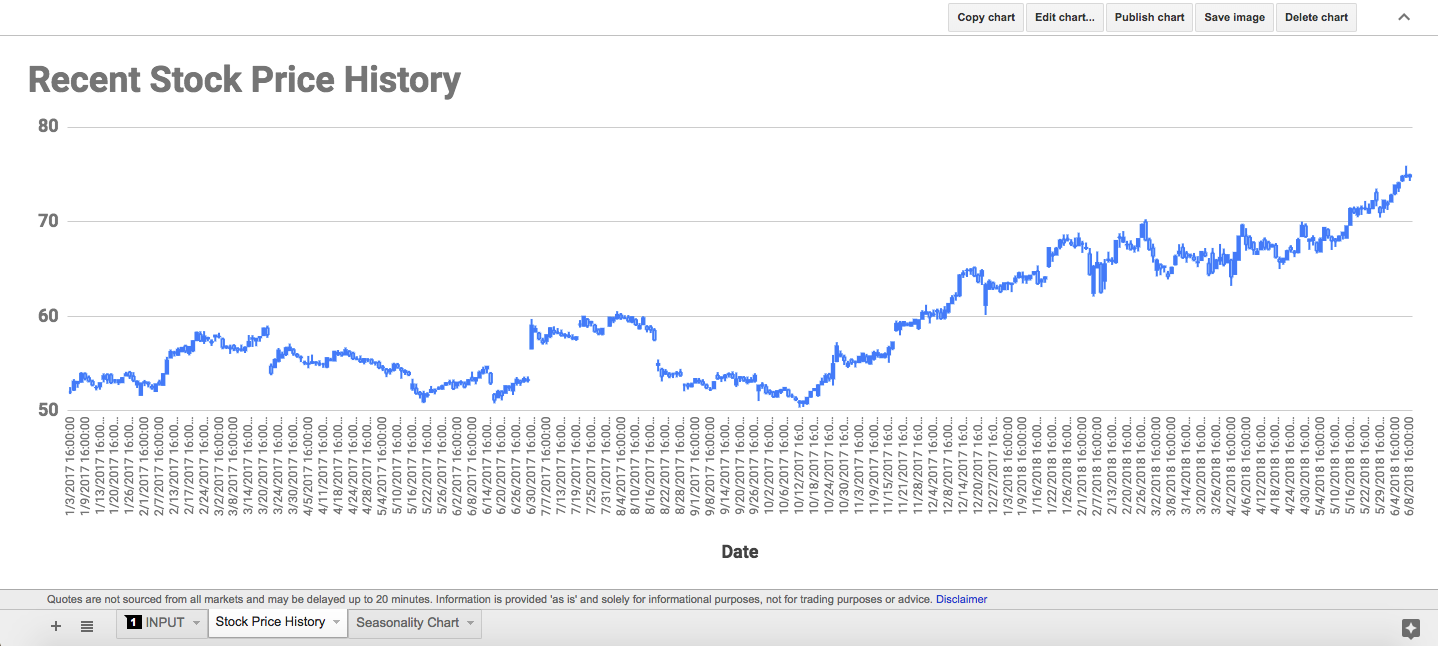
Stock with at least five-year price history

Stocks ticker symbols that do not generate price history using Google Sheet finance codes


3.4 / 5 (5 votes)

please wait...