Originally published: 09/02/2018 14:52
Last version published: 02/03/2018 14:41
Publication number: ELQ-15870-2
View all versions & Certificate
certified

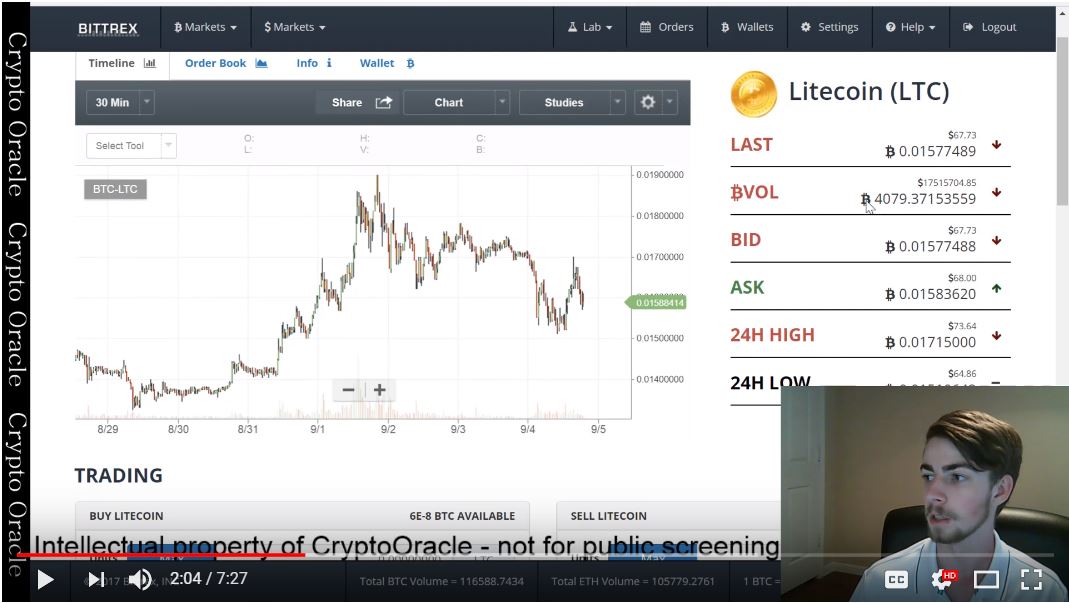
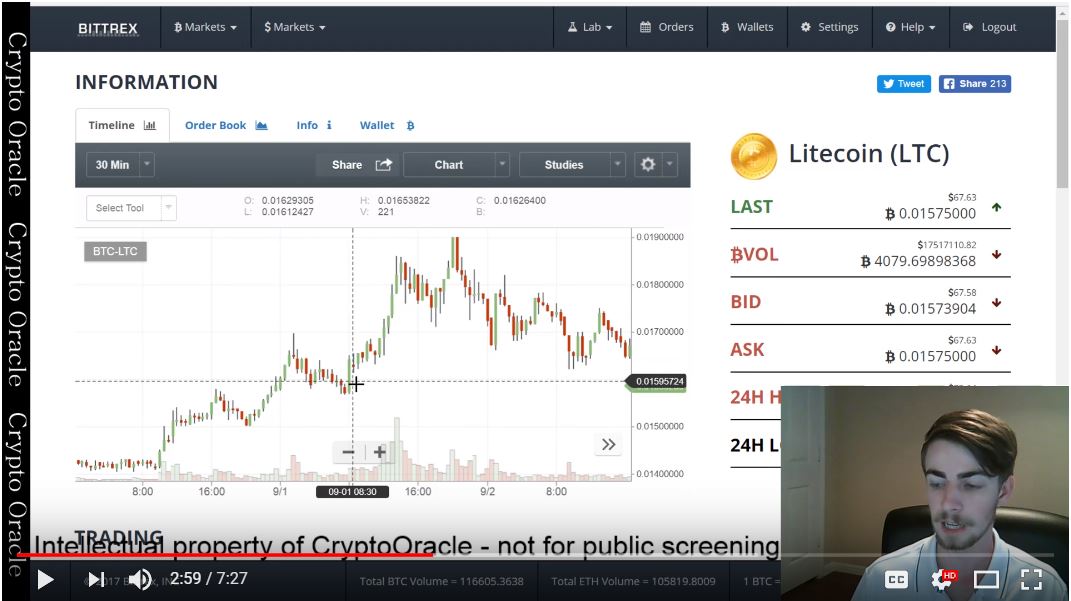
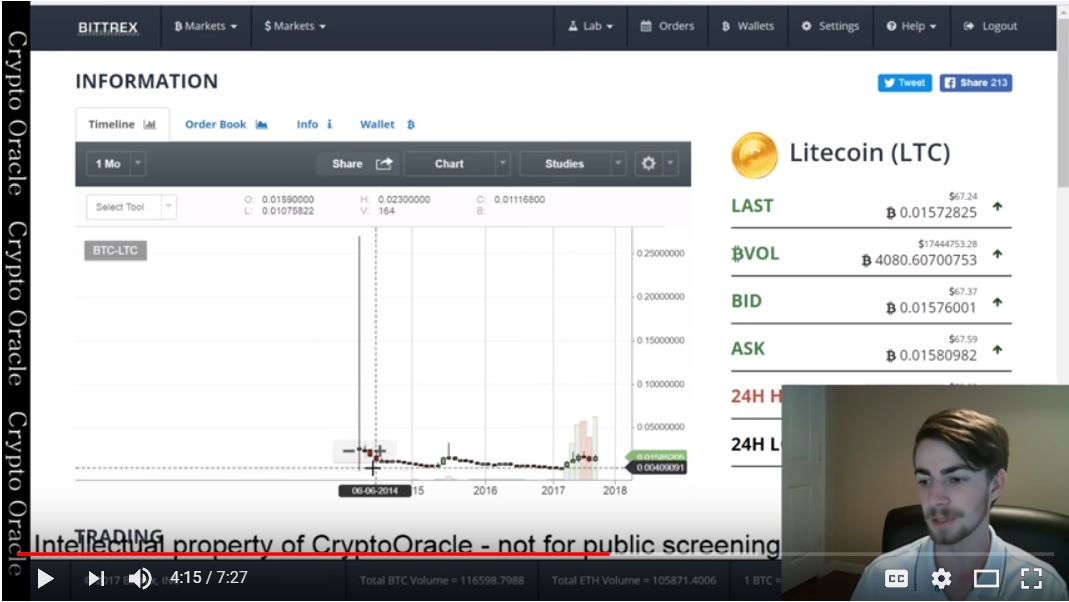
Beginner's Guide to Technical Analysis for Trading Cryptocurrencies

An introduction to technical analysis with regards to cryptocurrency.

Description
This is the absolute beginner's guide to technical analysis. This is skirting over everything; going over terms and such.

An absolute introduction to technical analysis starts with the chart. It doesn't matter what chart it is, as long as it has a candlestick pattern, it's going to apply. Techincal analysis applies to cryptocurrency charts, it applies to forex charts, and of course the actual stock market. Obviously this video only refers to it in terms of cryptocurrency.

This video starts by showing an over-time graph of the price of the coin. The X-axis shows the time starting by day and getting more specific as you zoom in. The price goes on the Y-axis, showing the price from .012 to .019. It goes all the way down to 0 and all the way up to infinity. The table on the right hand side shows the price of the coins at what they were last sold at.

Watch this video to continue receiving an explanation of cryptocurrency technical analysis through a screen-sharing method.

This Best Practice includes
1 Video File

Add to bookmarks

Did Crypto Oracle's Best Practice help you? You can make a small financial contribution to support the author.

helpSupport


0.0 / 5 (0 votes)

please wait...