

Originally published: 26/11/2024 13:16
Publication number: ELQ-68826-1
View all versions & Certificate
Publication number: ELQ-68826-1
View all versions & Certificate

Digital Adverting Agency Financial Model with MRR Billing
A comprehensive editable 5 Year 3 Statement, MS Excel spreadsheet for tracking a Digital Advertising Agency's finances.
AllFinancialModels offer a curated selection of high-quality yet financial model templates designed to support a wide range of business needs.Follow
Description
This financial model provides a detailed framework to assess the financial health and performance of a Digital Advertising Agency. It incorporates the Income Statement, Cash Flow Statement, Balance Sheet, and Monthly Recurring Revenue (MRR) and Annual Recurring Revenue (ARR) Tracking.
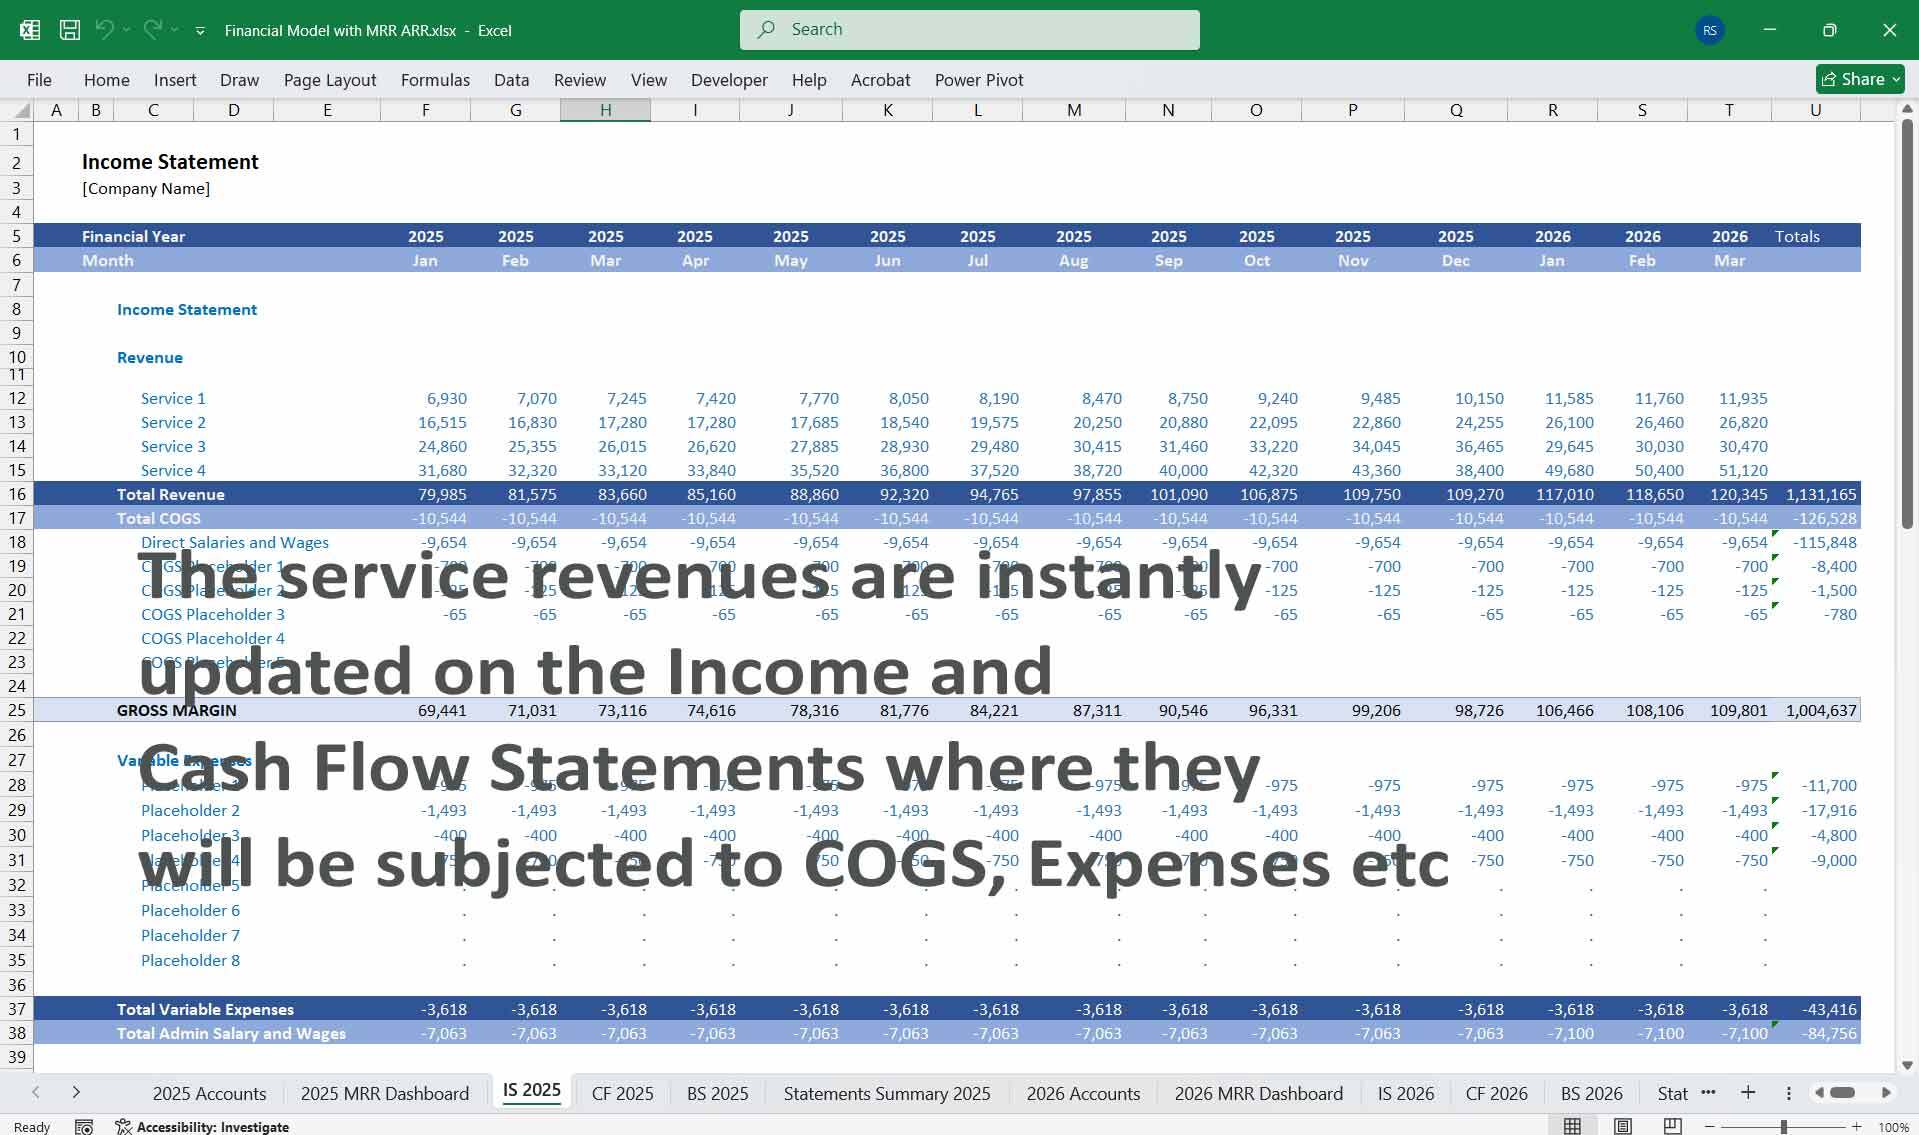
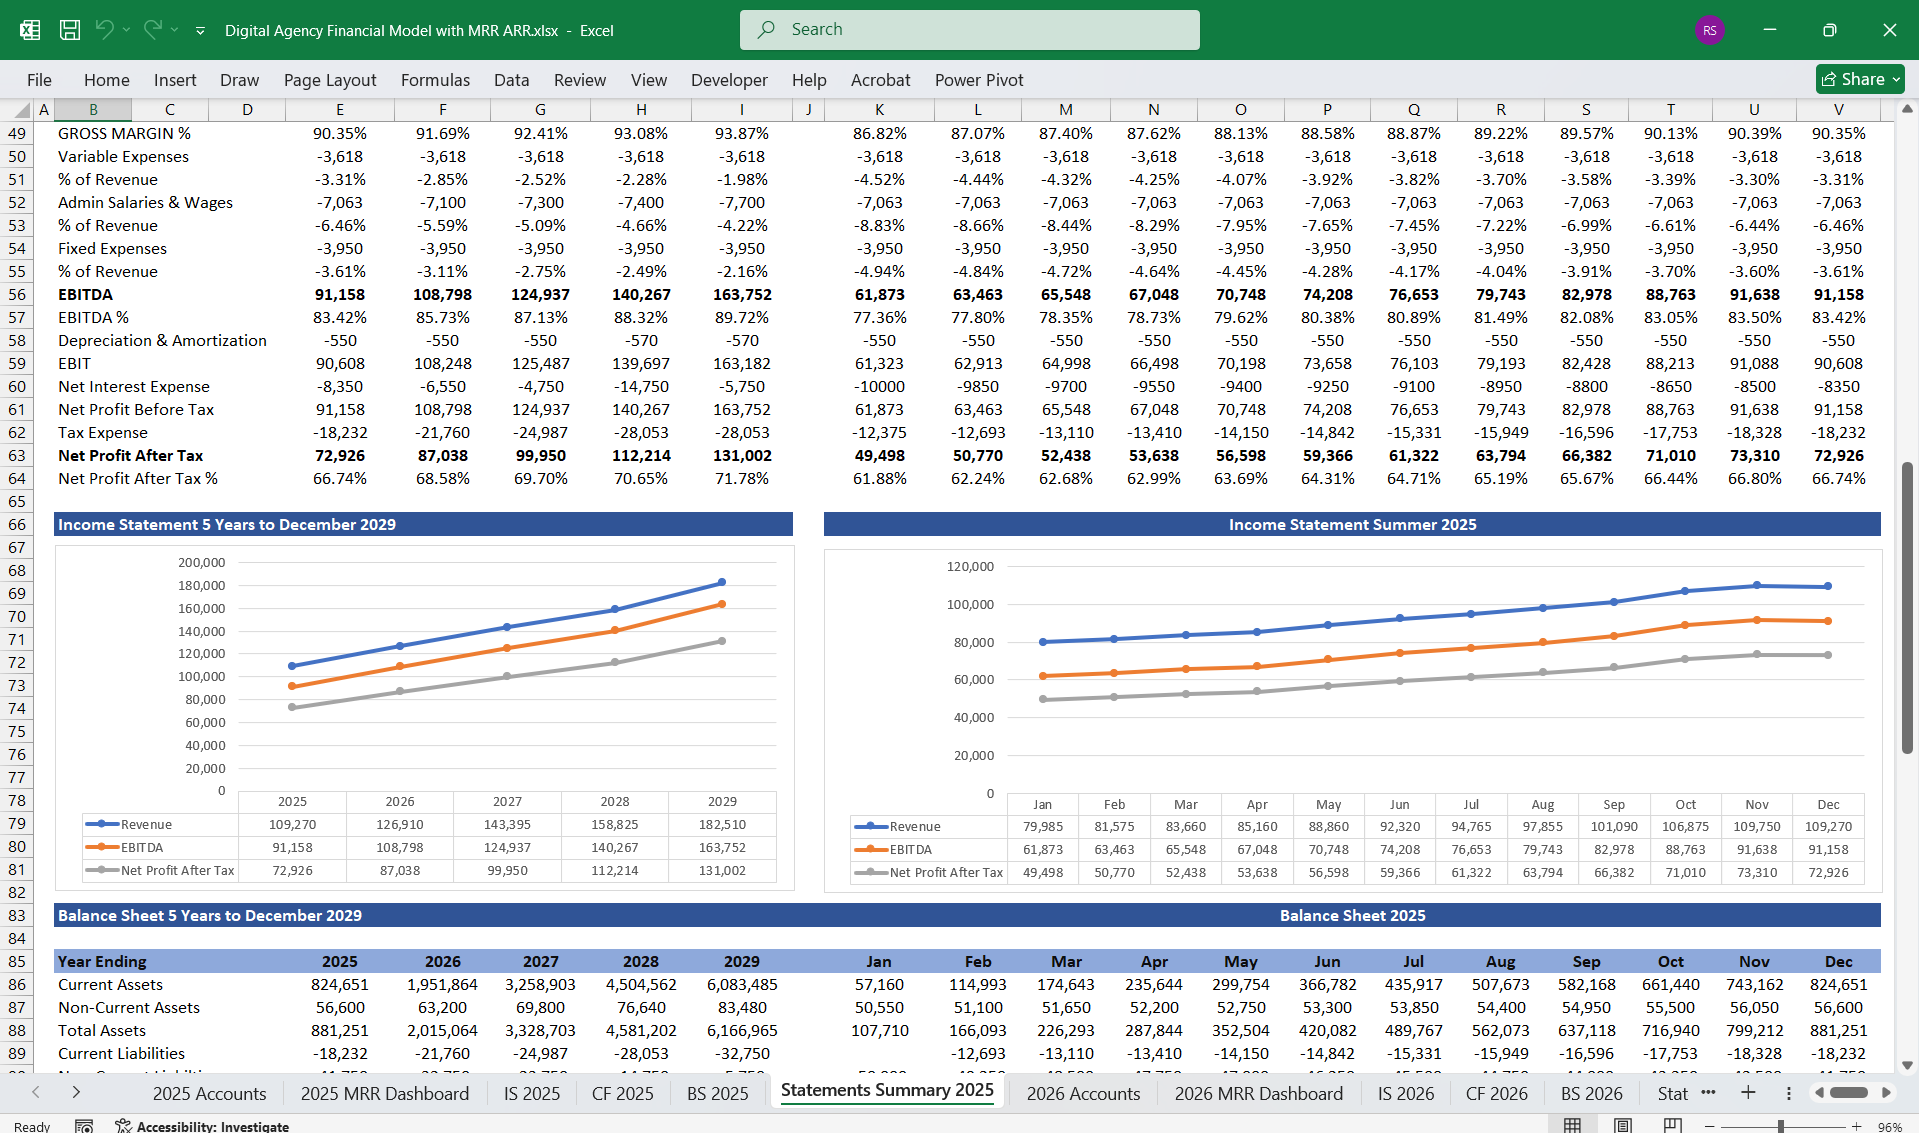
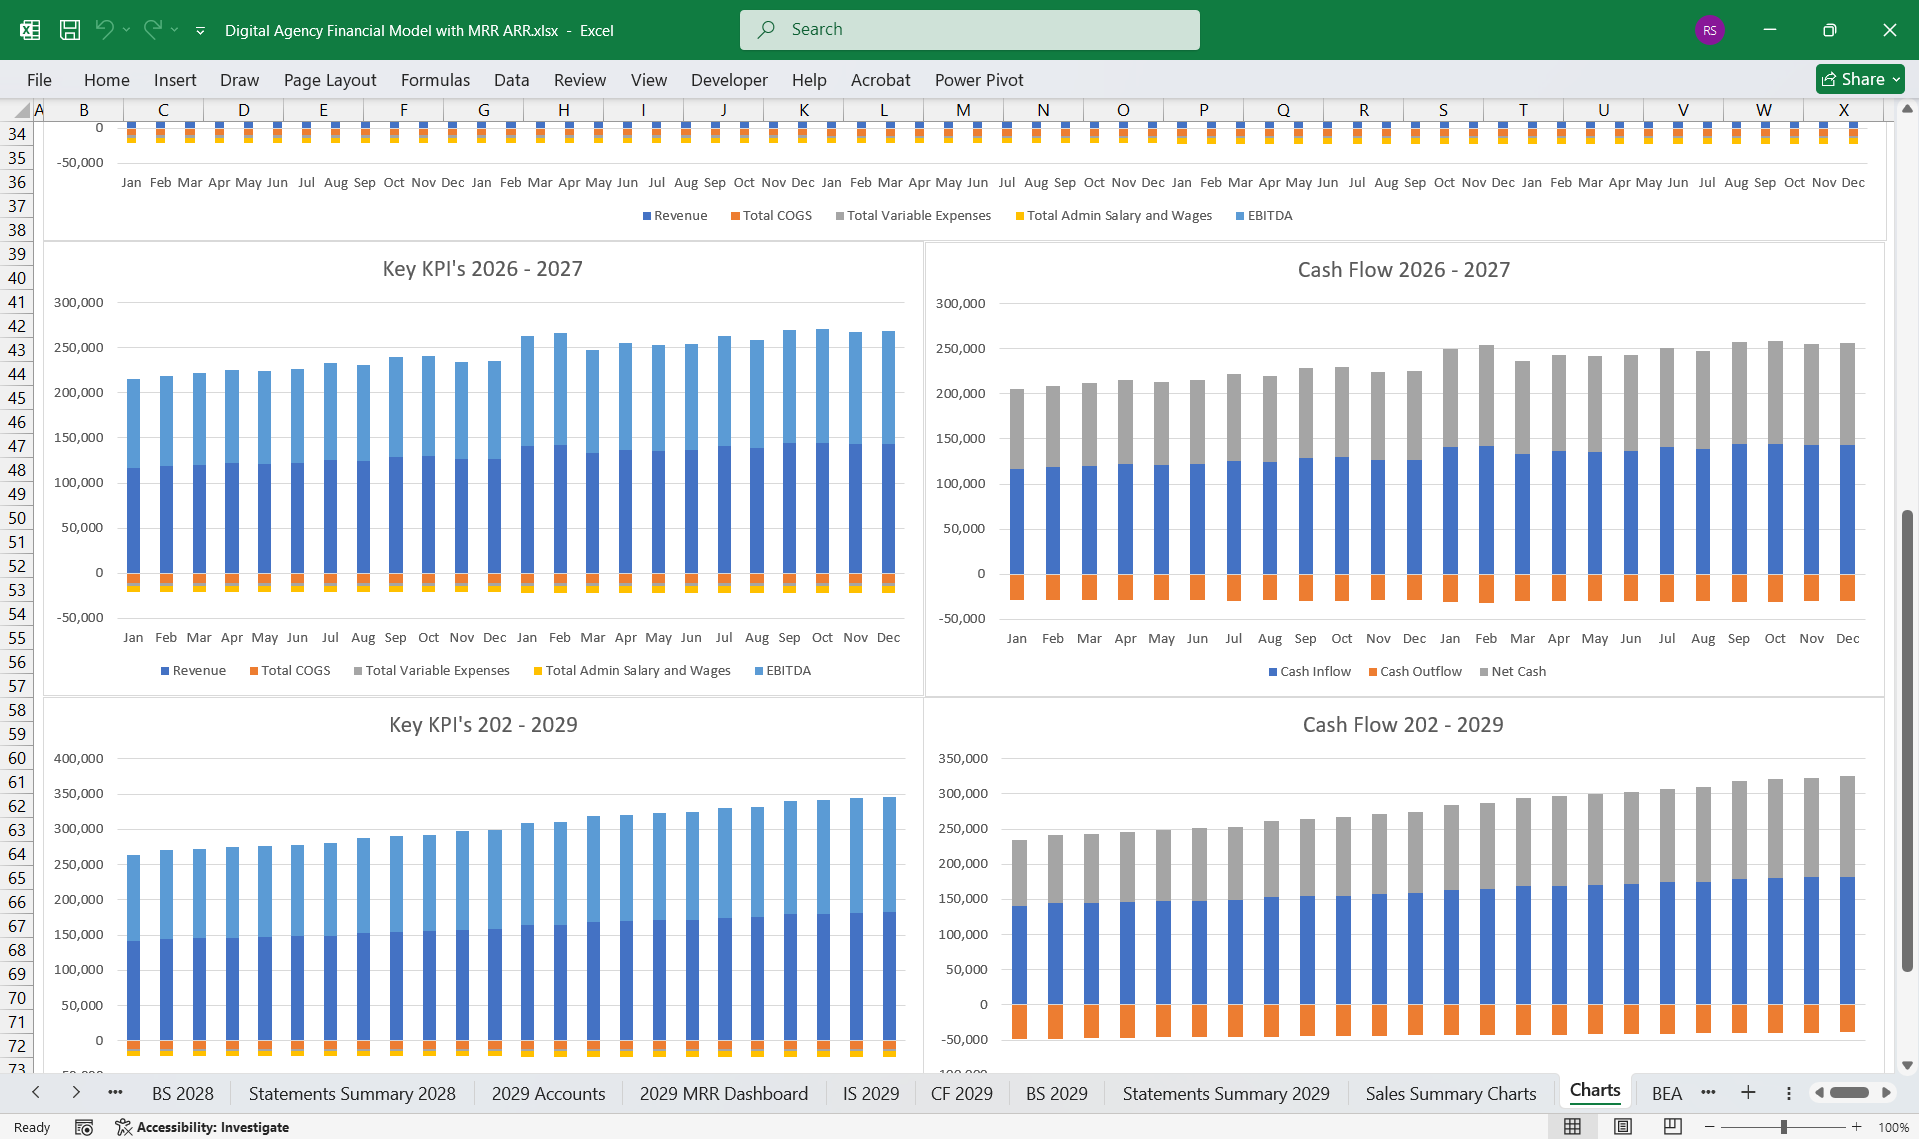
1. Income StatementThis statement outlines the profitability of a Digital Advertising Agency over a given period.
Revenue
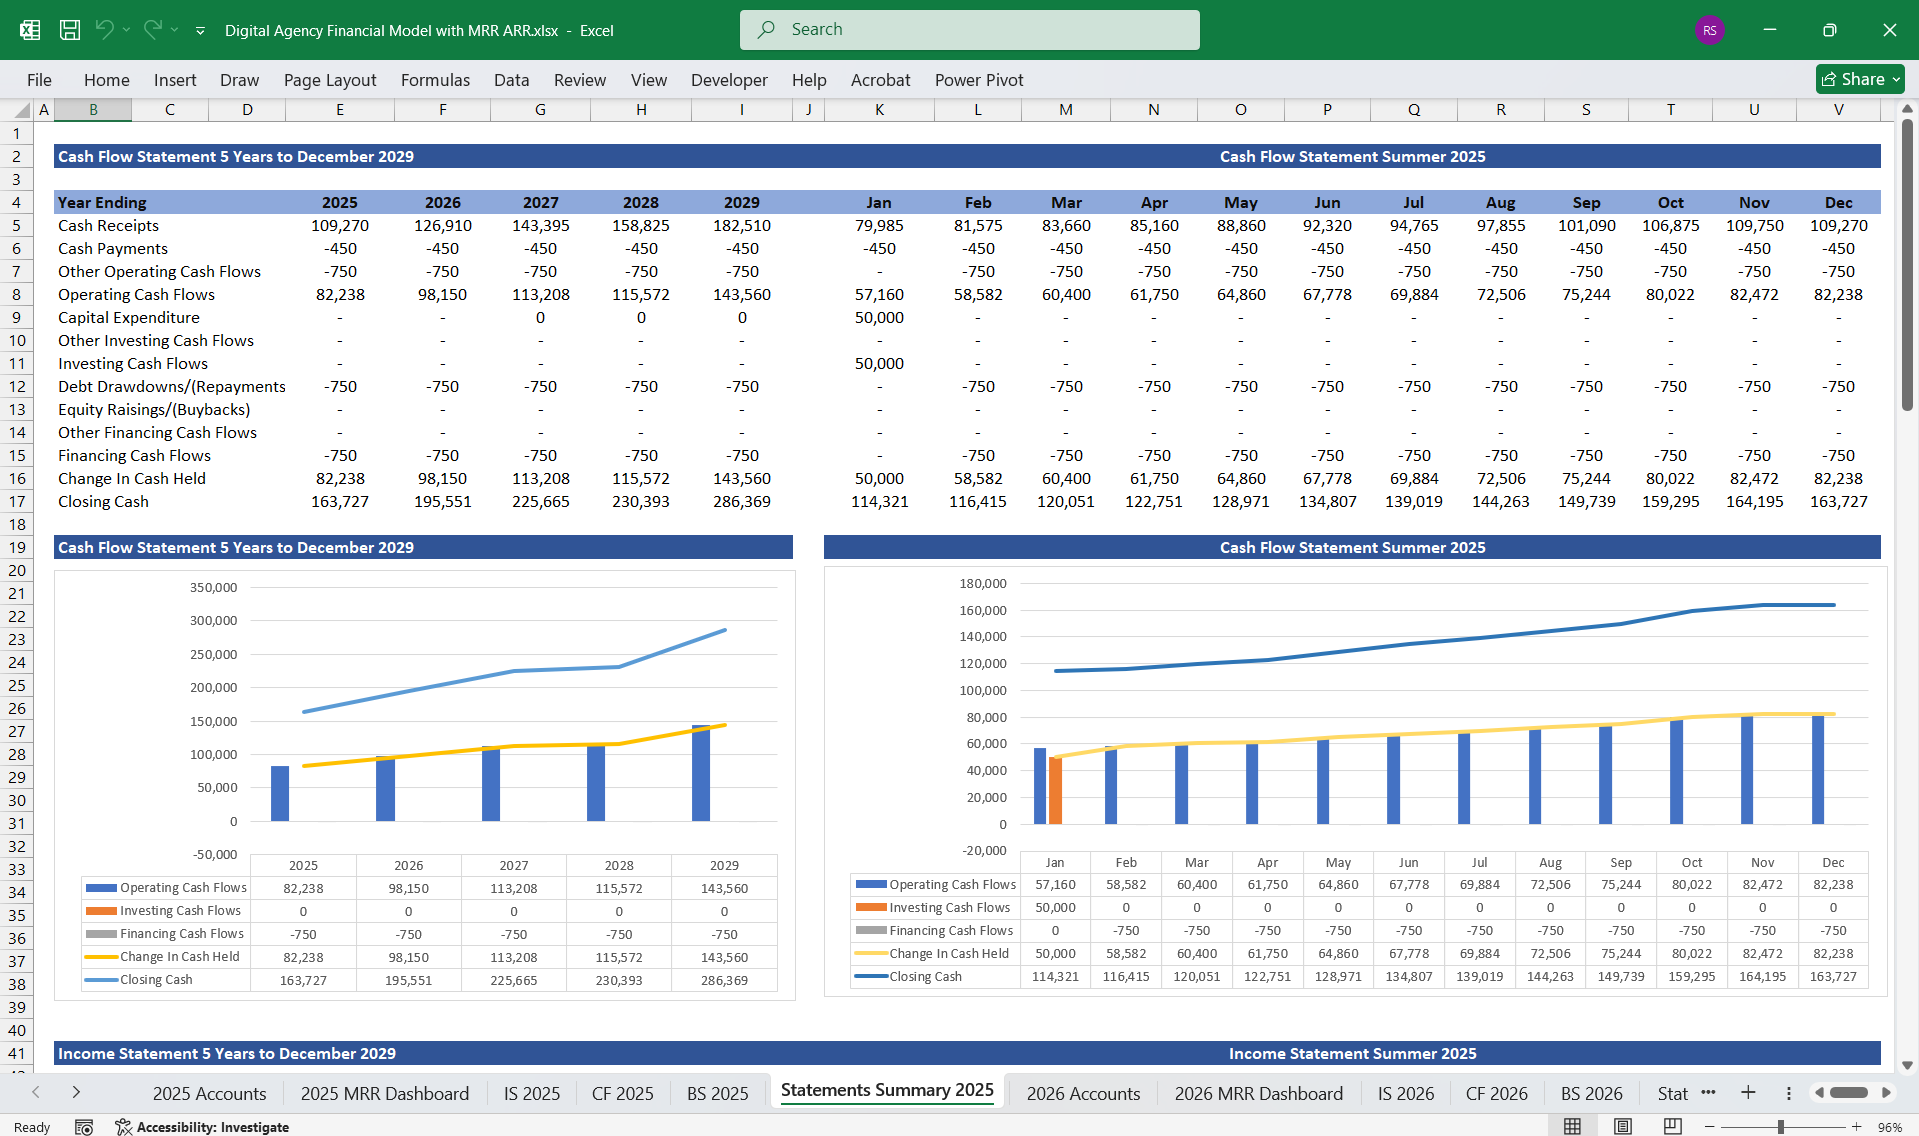
2. Cash Flow Statement
This statement provides insight into cash inflows and outflows, categorized into three activities.
Operating Activities
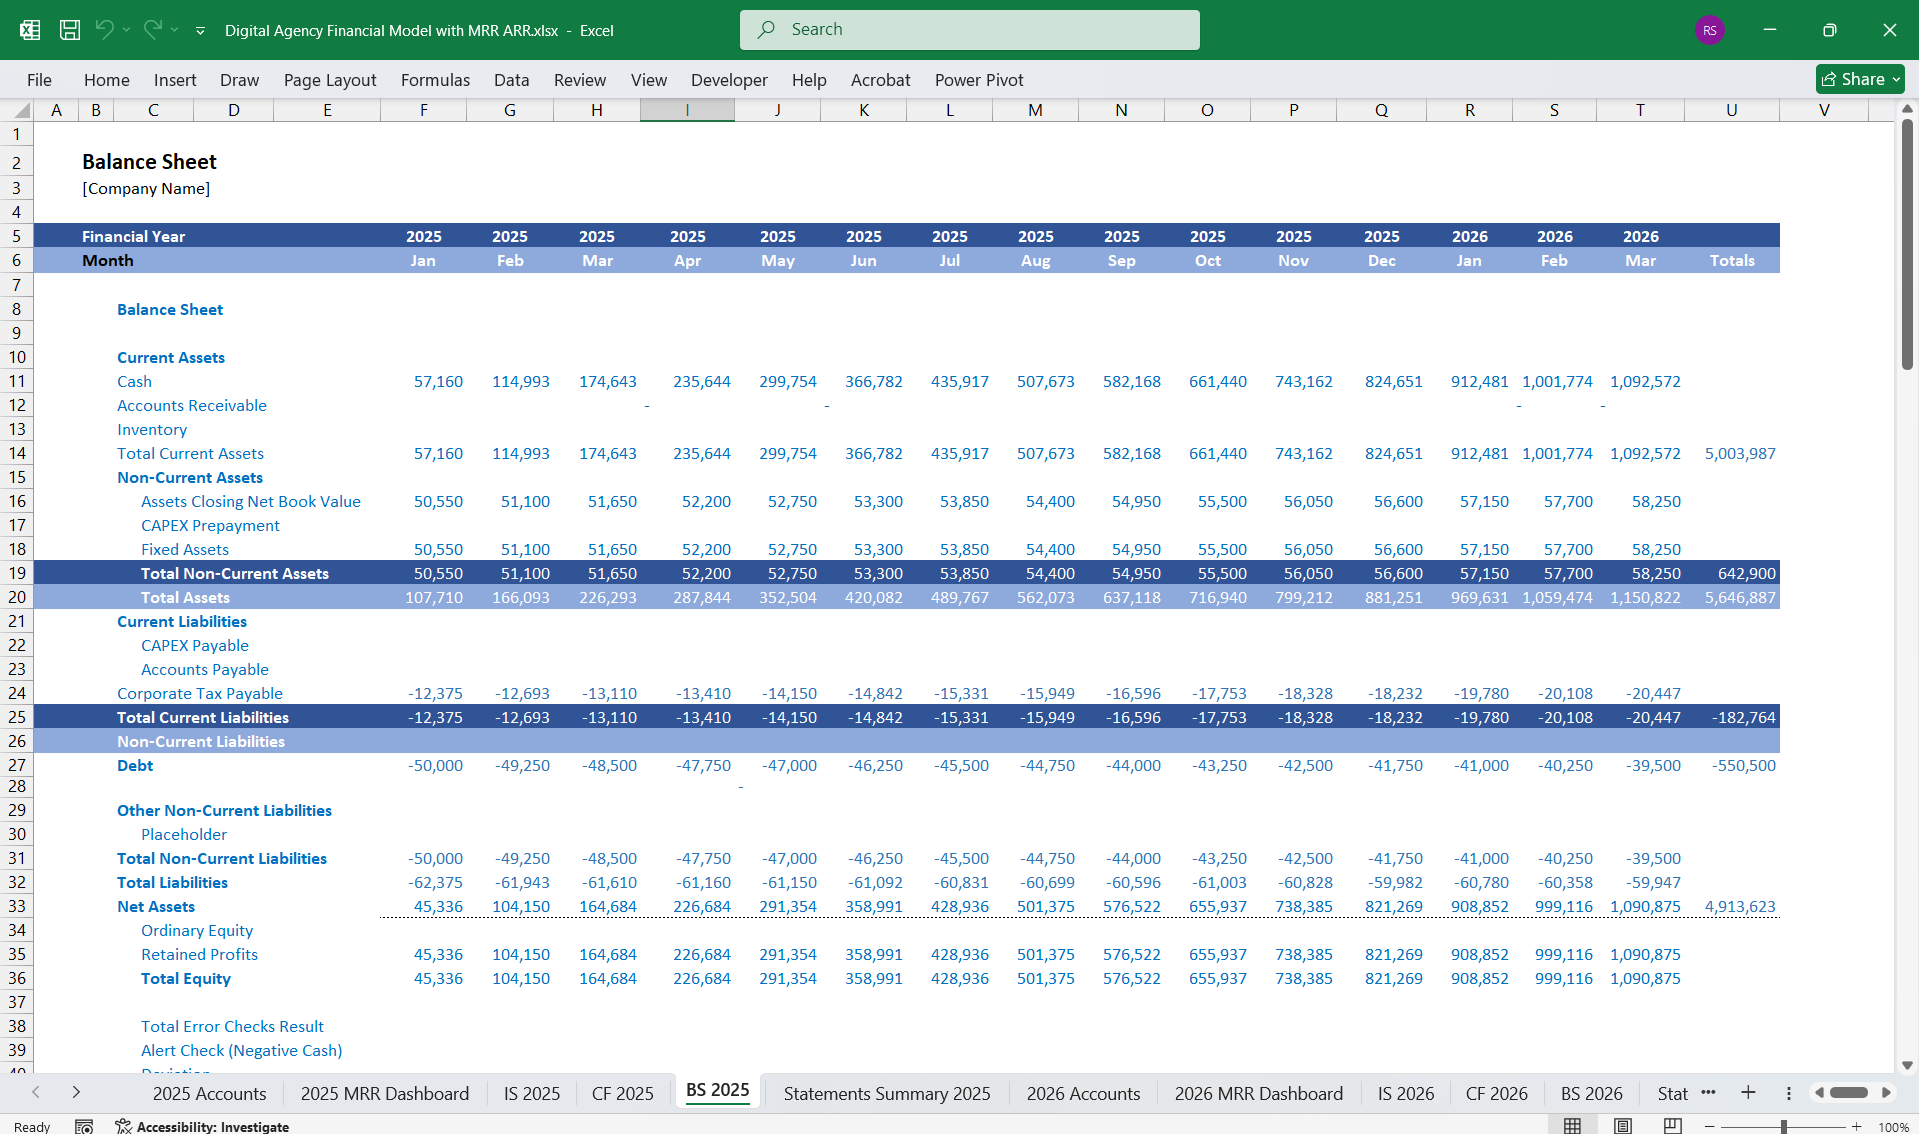
3. Balance Sheet
The balance sheet captures the financial position of the company at a given point in time.
Assets
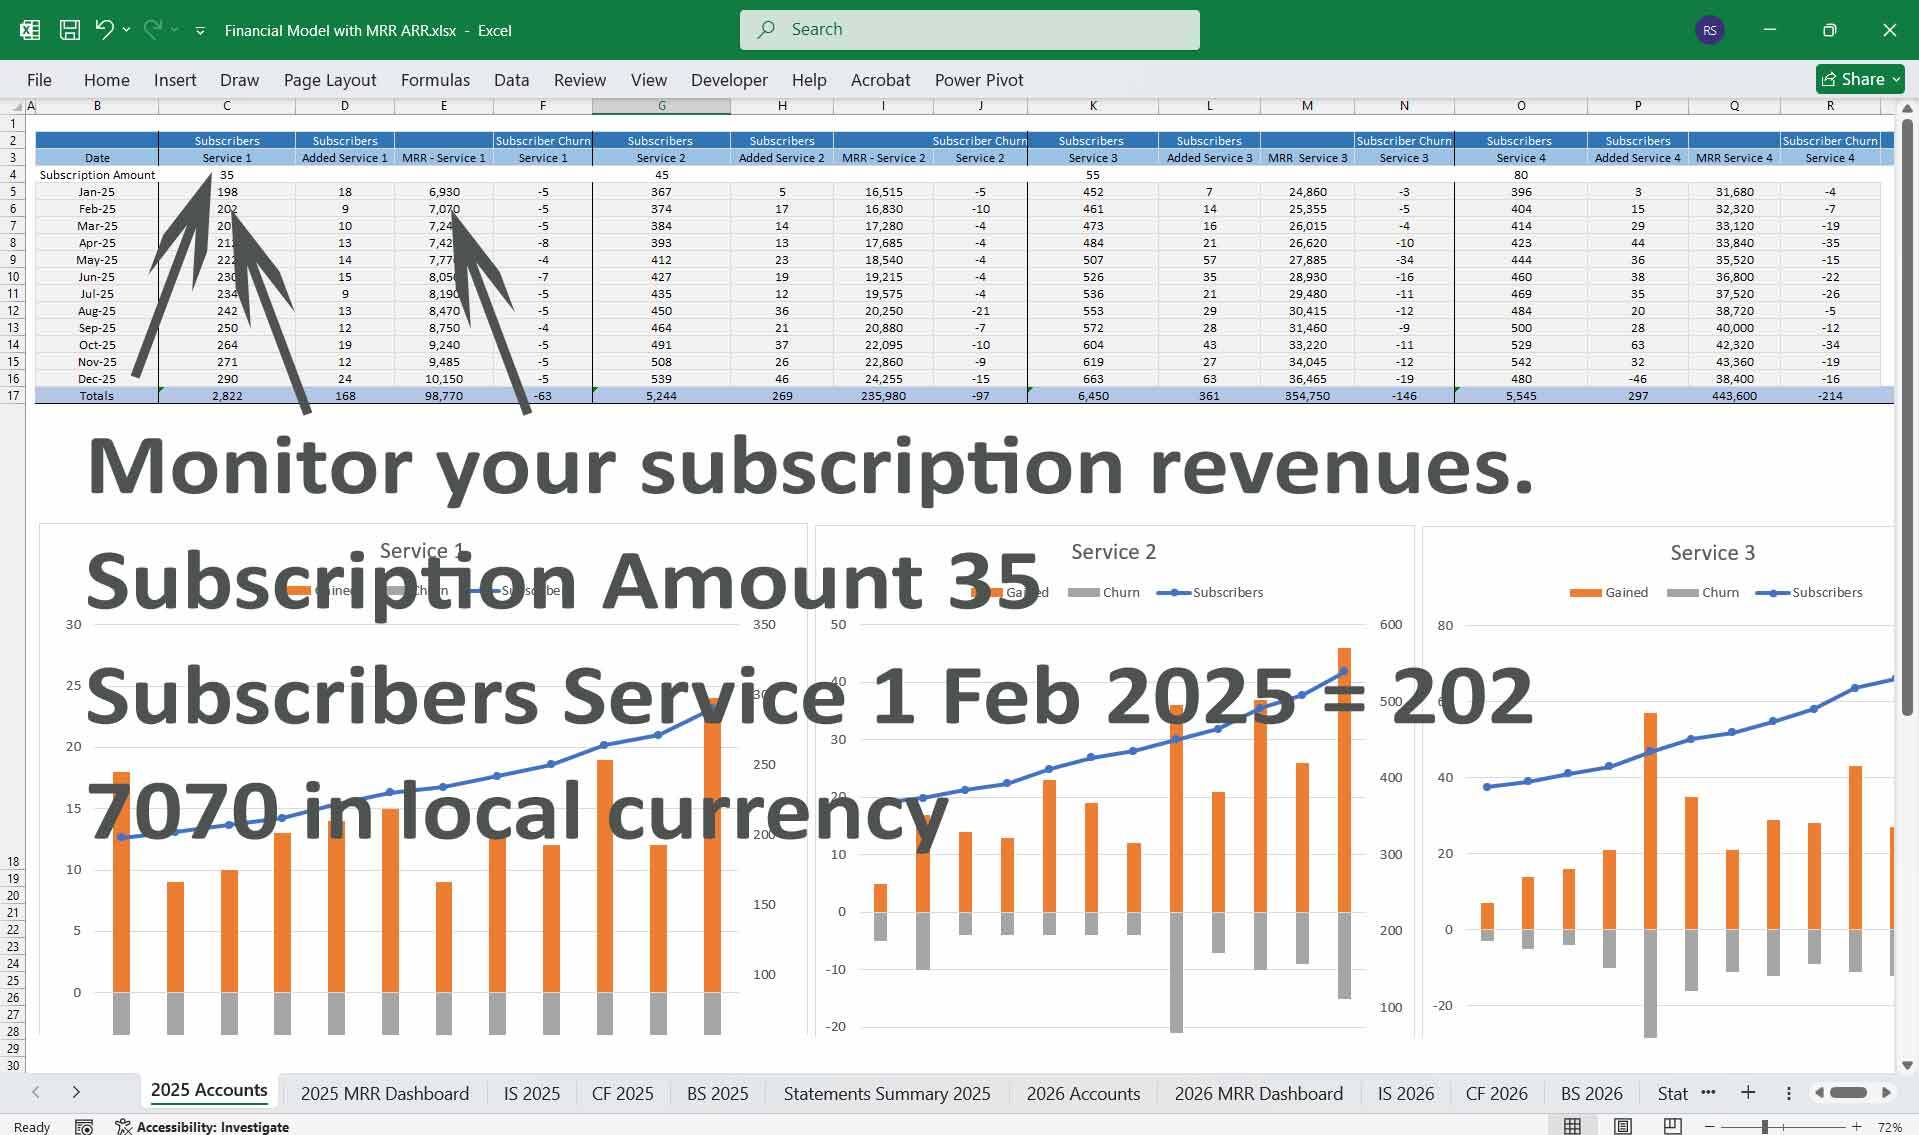
4. MRR and ARR Revenue Tracking
Focuses on tracking the recurring revenue that forms the backbone of a subscription-based business.
This financial model provides a detailed framework to assess the financial health and performance of a Digital Advertising Agency. It incorporates the Income Statement, Cash Flow Statement, Balance Sheet, and Monthly Recurring Revenue (MRR) and Annual Recurring Revenue (ARR) Tracking.
1. Income StatementThis statement outlines the profitability of a Digital Advertising Agency over a given period.
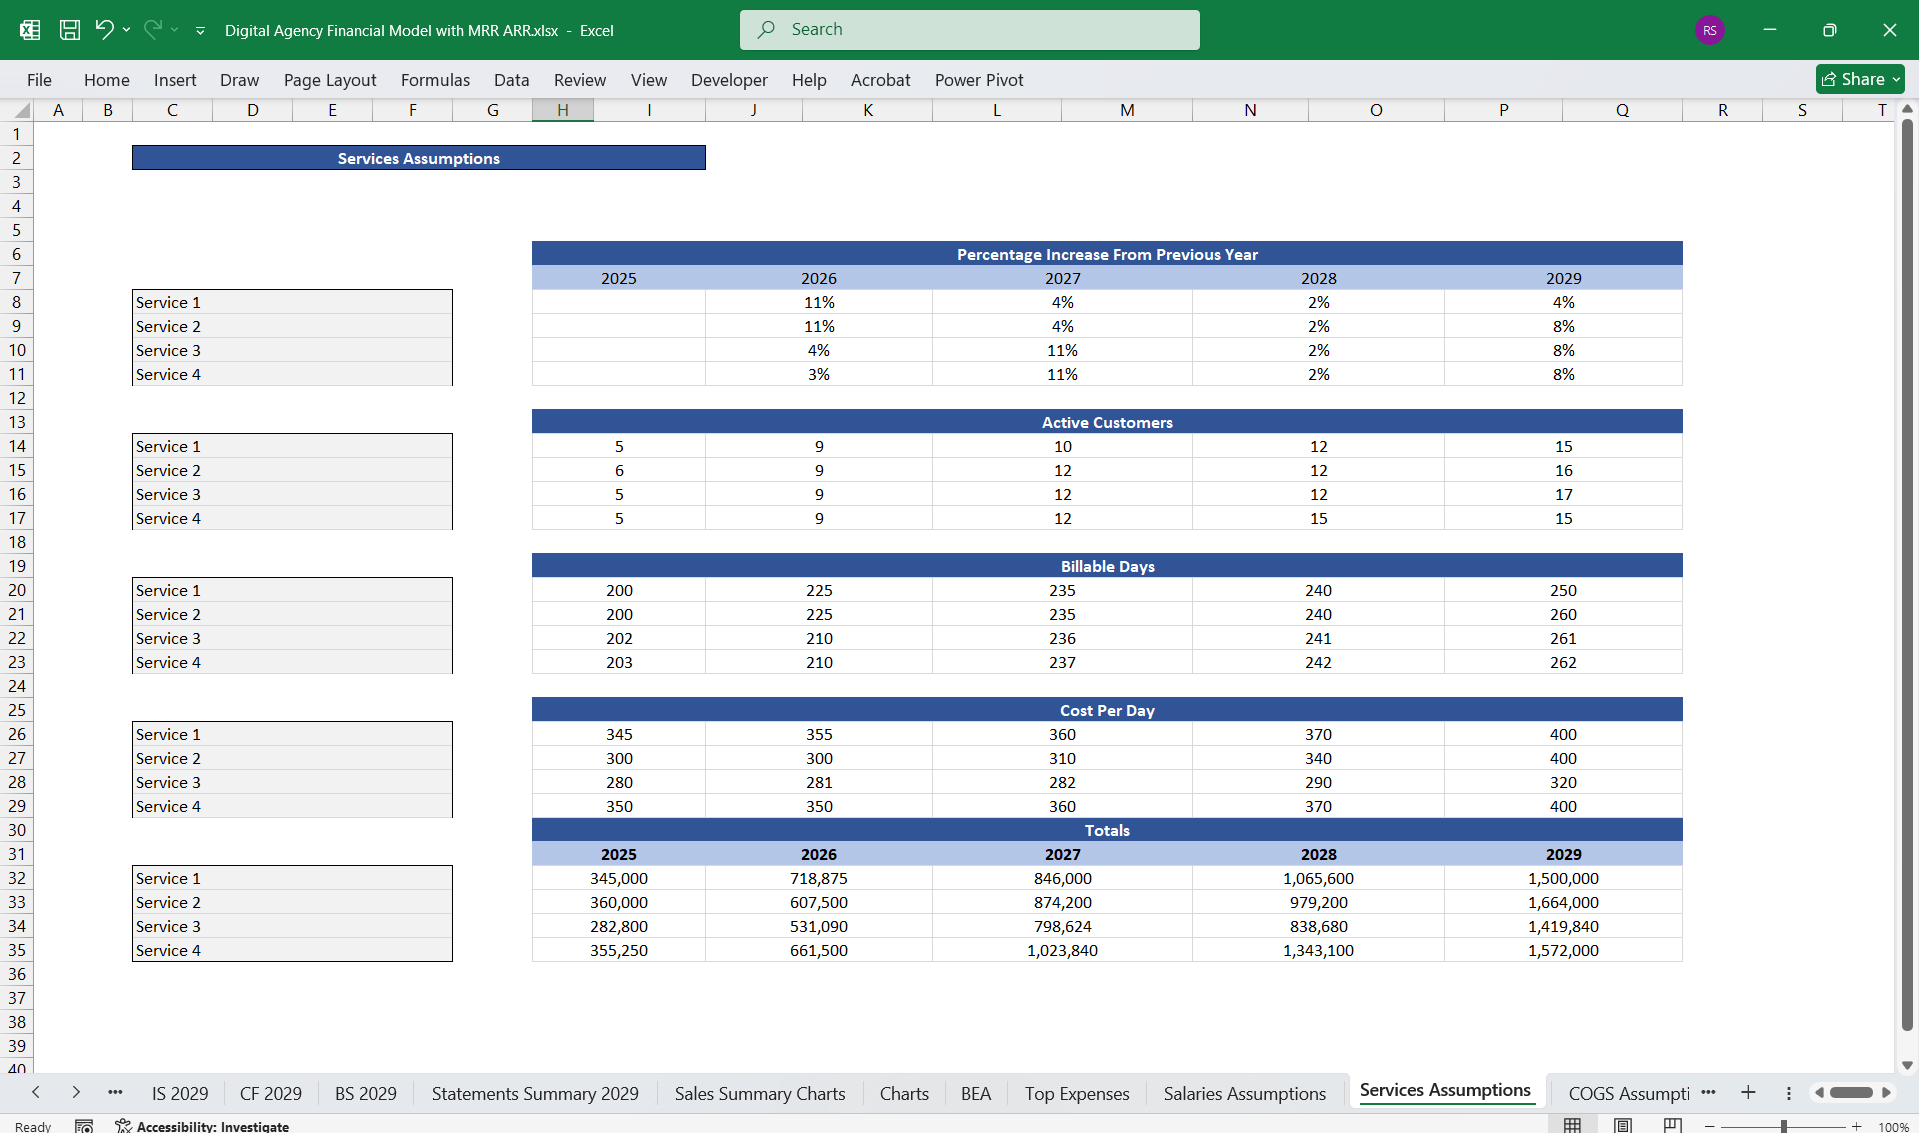
Revenue
- Subscription Revenue:
- Monthly subscriptions = MRR × Number of active subscribers.
- Yearly subscriptions = ARR-driven revenue (discounted annual plans).
- Ad Revenue (if applicable):
- Ad-based tier revenue = Ads viewed × CPM (cost per thousand impressions).
- Affiliate Revenue: Generated through partnerships and cross-promotions.
- Cost of Revenue:
- Content Licensing: Payments for licensed content, amortized over time.
- Content Production: In-house creation of exclusive shows/movies.
- Hosting and Delivery: Cloud services for bandwidth. (Optional)
- Customer Support: Costs of handling customer inquiries and issues.
- Operating Expenses:
- Marketing and Sales: Paid ads, influencer collaborations, and SEO costs.
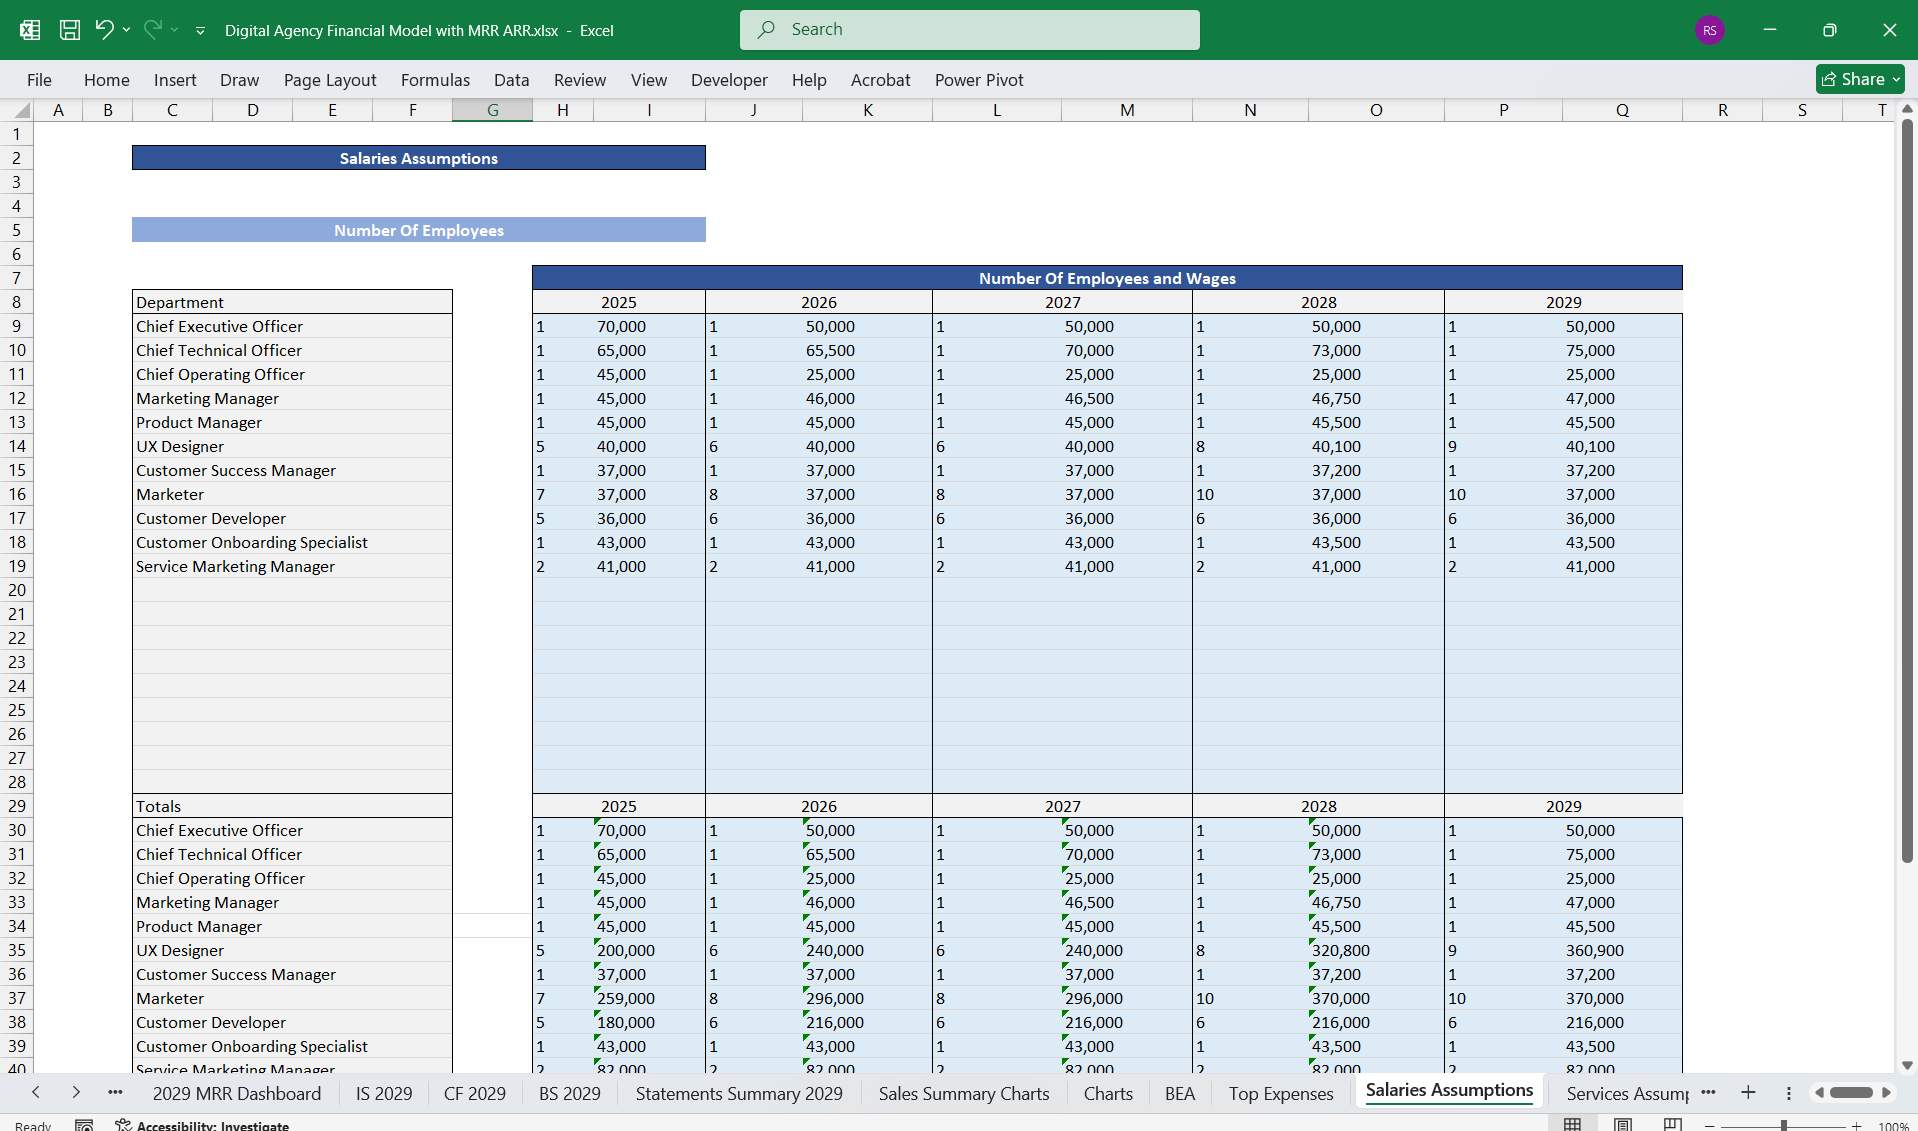
- General and Administrative: Salaries, office expenses, and other overheads.
- Research and Development: Investments in platform improvements and technology.
- Depreciation and Amortization: This is for production equipment and intangible assets like exclusive content rights.
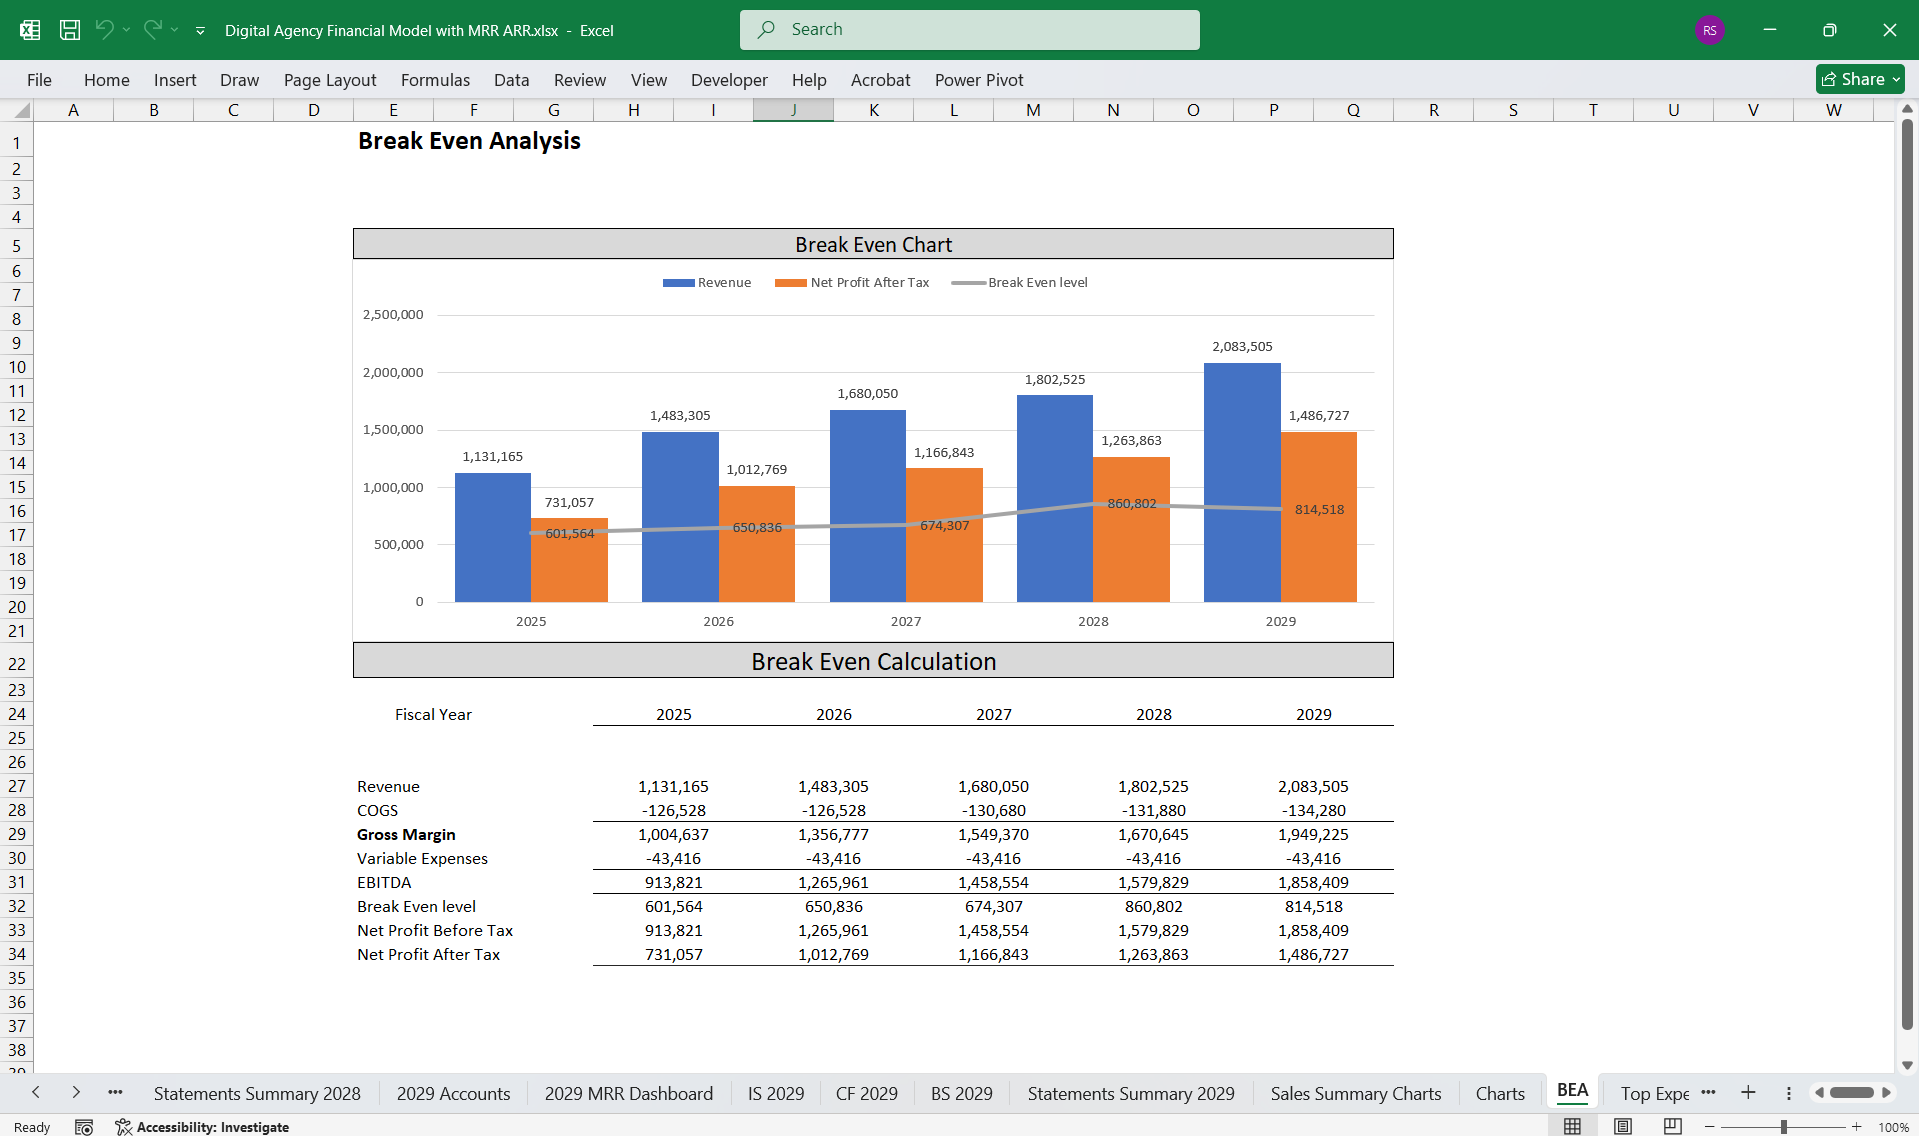
- Gross Profit = Revenue - Cost of Revenue.
- Operating Profit = Gross Profit - Operating Expenses.
- Net Profit = Operating Profit - Taxes.
2. Cash Flow Statement
This statement provides insight into cash inflows and outflows, categorized into three activities.
Operating Activities
- Cash Inflows:
- Subscription receipts (monthly/annual).
- Ad revenue payments received.
- Cash Outflows:
- Payments for content licensing and production.
- Salaries and wages.
- Marketing campaigns.
- Technology expenses (hosting, infrastructure).
- Cash Inflows:
- Sale of assets (if applicable).
- Investment returns.
- Cash Outflows:
- Purchases of new content assets.
- Investments in platform infrastructure and technology.
- Cash Inflows:
- Proceeds from investors (venture capital, IPO, etc.).
- Debt financing.
- Cash Outflows:
- Dividend payments (if any).
- Loan repayments.
- Free Cash Flow = Net Cash from Operating Activities - Capital Expenditures.
- Burn Rate (for early-stage companies): Monthly cash usage rate.
3. Balance Sheet
The balance sheet captures the financial position of the company at a given point in time.
Assets
- Current Assets:
- Cash and cash equivalents.
- Accounts receivable (e.g., from advertisers or affiliates).
- Prepaid expenses (e.g., prepaid hosting fees).
- Non-Current Assets:
- Content Library:
- Licensed Content (value amortized over time).
- Produced Content (in-house creation costs capitalized).
- Property, Plant, and Equipment (e.g., production equipment).
- Intangible Assets (e.g., patents, trademarks).
- Content Library:
- Current Liabilities:
- Accounts payable (e.g., owed to content producers).
- Deferred Revenue (e.g., annual subscriptions prepaid but not yet earned).
- Accrued Expenses (e.g., unpaid salaries, marketing expenses).
- Non-Current Liabilities:
- Long-term debt or loans.
- Common stock.
- Retained earnings.
- Current Ratio = Current Assets / Current Liabilities.
- Debt-to-Equity Ratio = Total Liabilities / Total Equity.
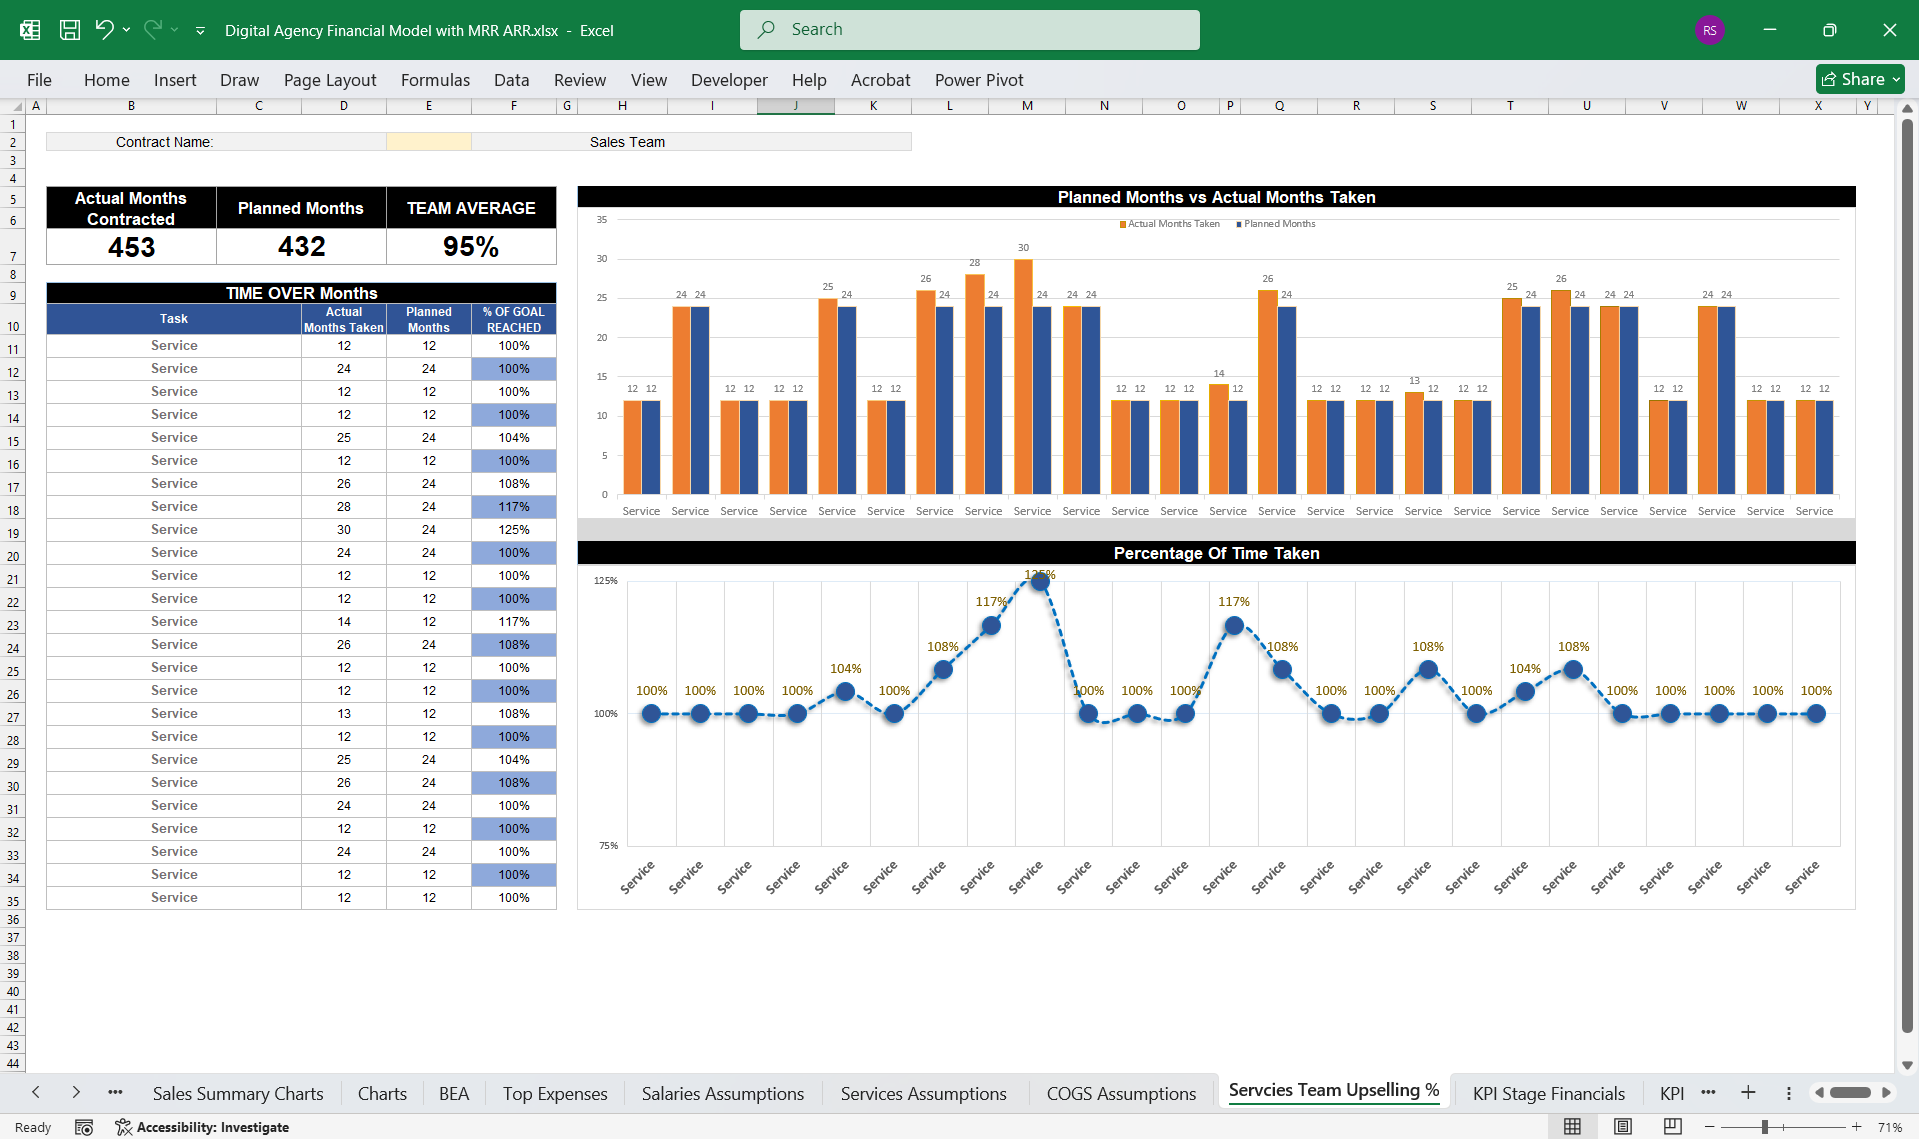
4. MRR and ARR Revenue Tracking
Focuses on tracking the recurring revenue that forms the backbone of a subscription-based business.
- Monthly Recurring Revenue (MRR): Total monthly revenue generated from active subscriptions.
- MRR = (Number of subscribers in each tier × Tier price).
- Annual Recurring Revenue (ARR): Total expected revenue over a year from recurring subscriptions.
- ARR = MRR × 12.
- Subscriber Growth Rate:
- (New Subscribers - Cancellations) / Starting Subscribers.
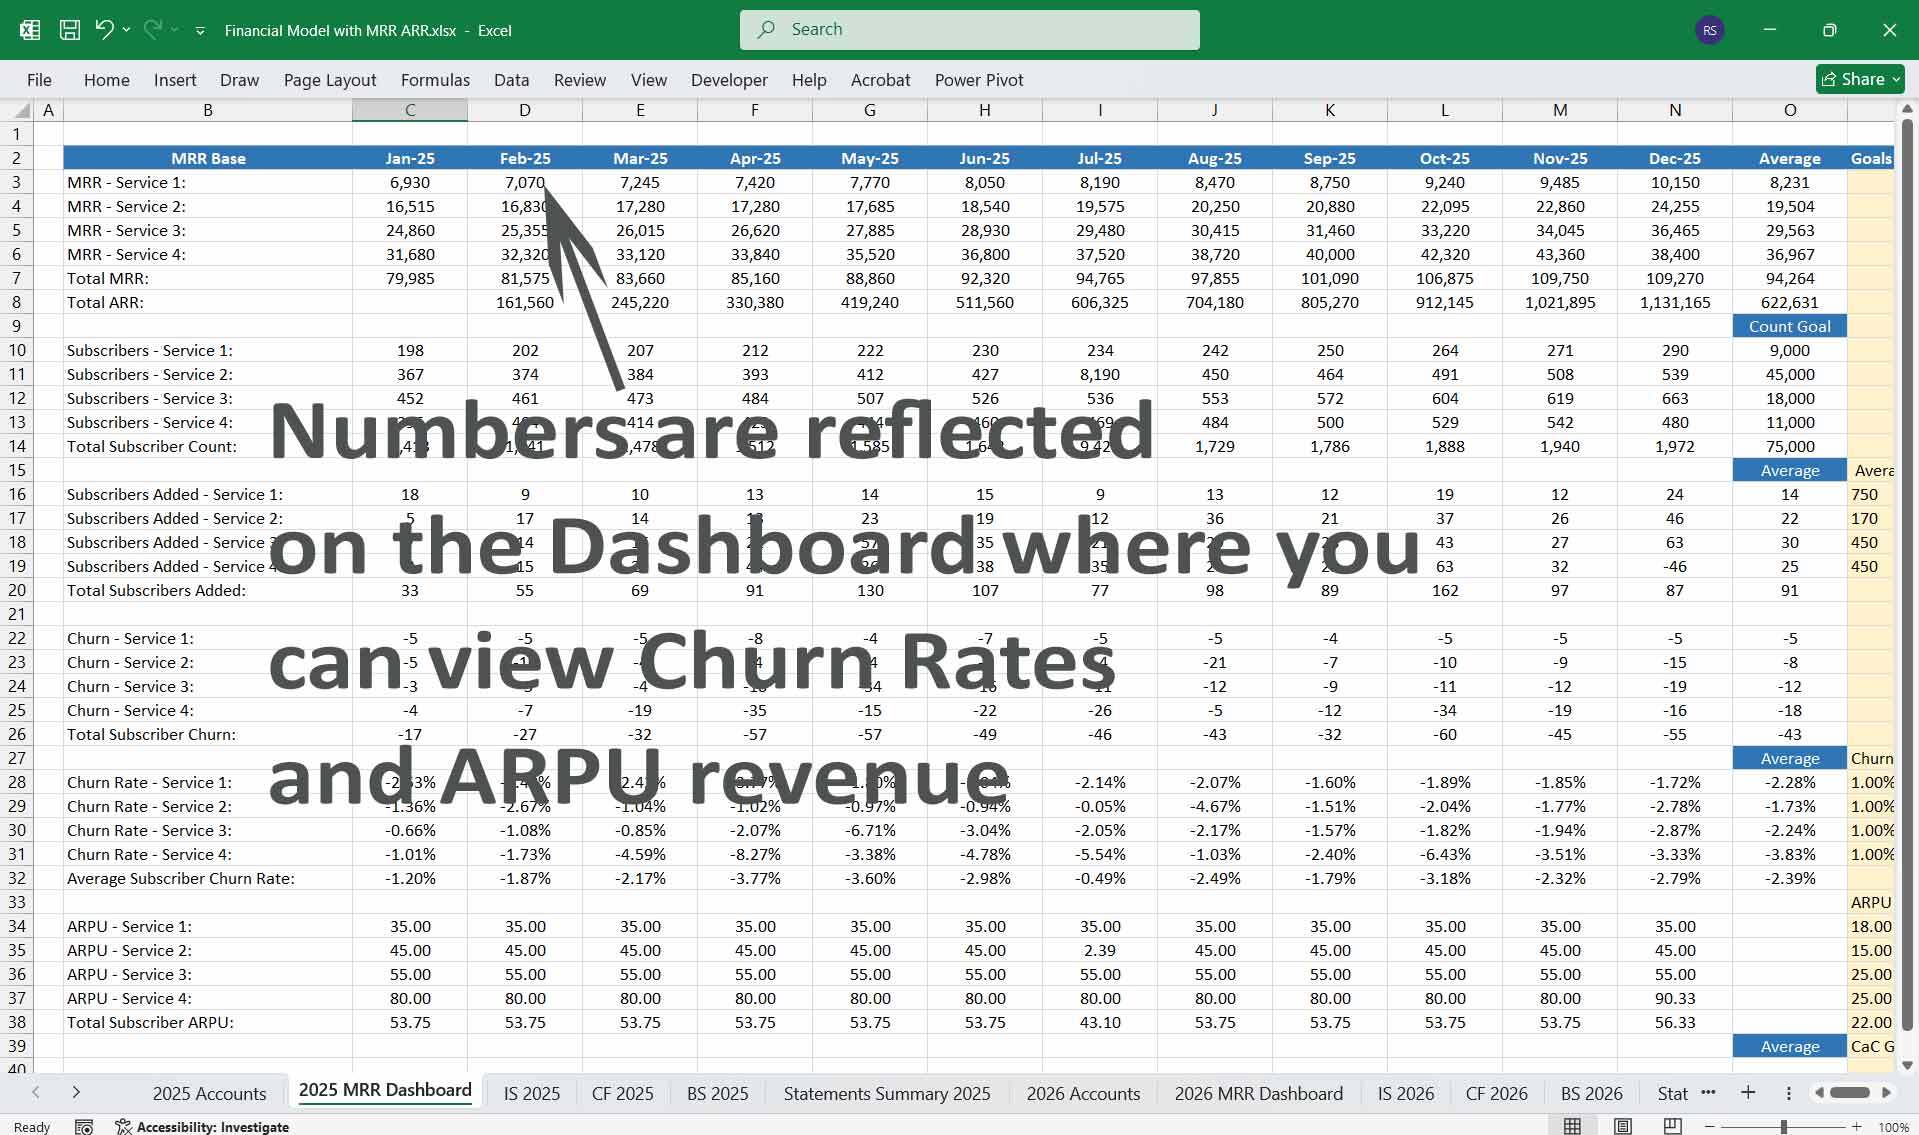
- Churn Rate:
- (Number of Cancellations / Starting Subscribers).
- Lifetime Value (LTV):
- Average Revenue Per User (ARPU) × Average Subscriber Lifetime.
- Customer Acquisition Cost (CAC):
- Total Sales & Marketing Costs / Number of New Subscribers.
- LTV/CAC Ratio:
- Indicates the ROI on customer acquisition.
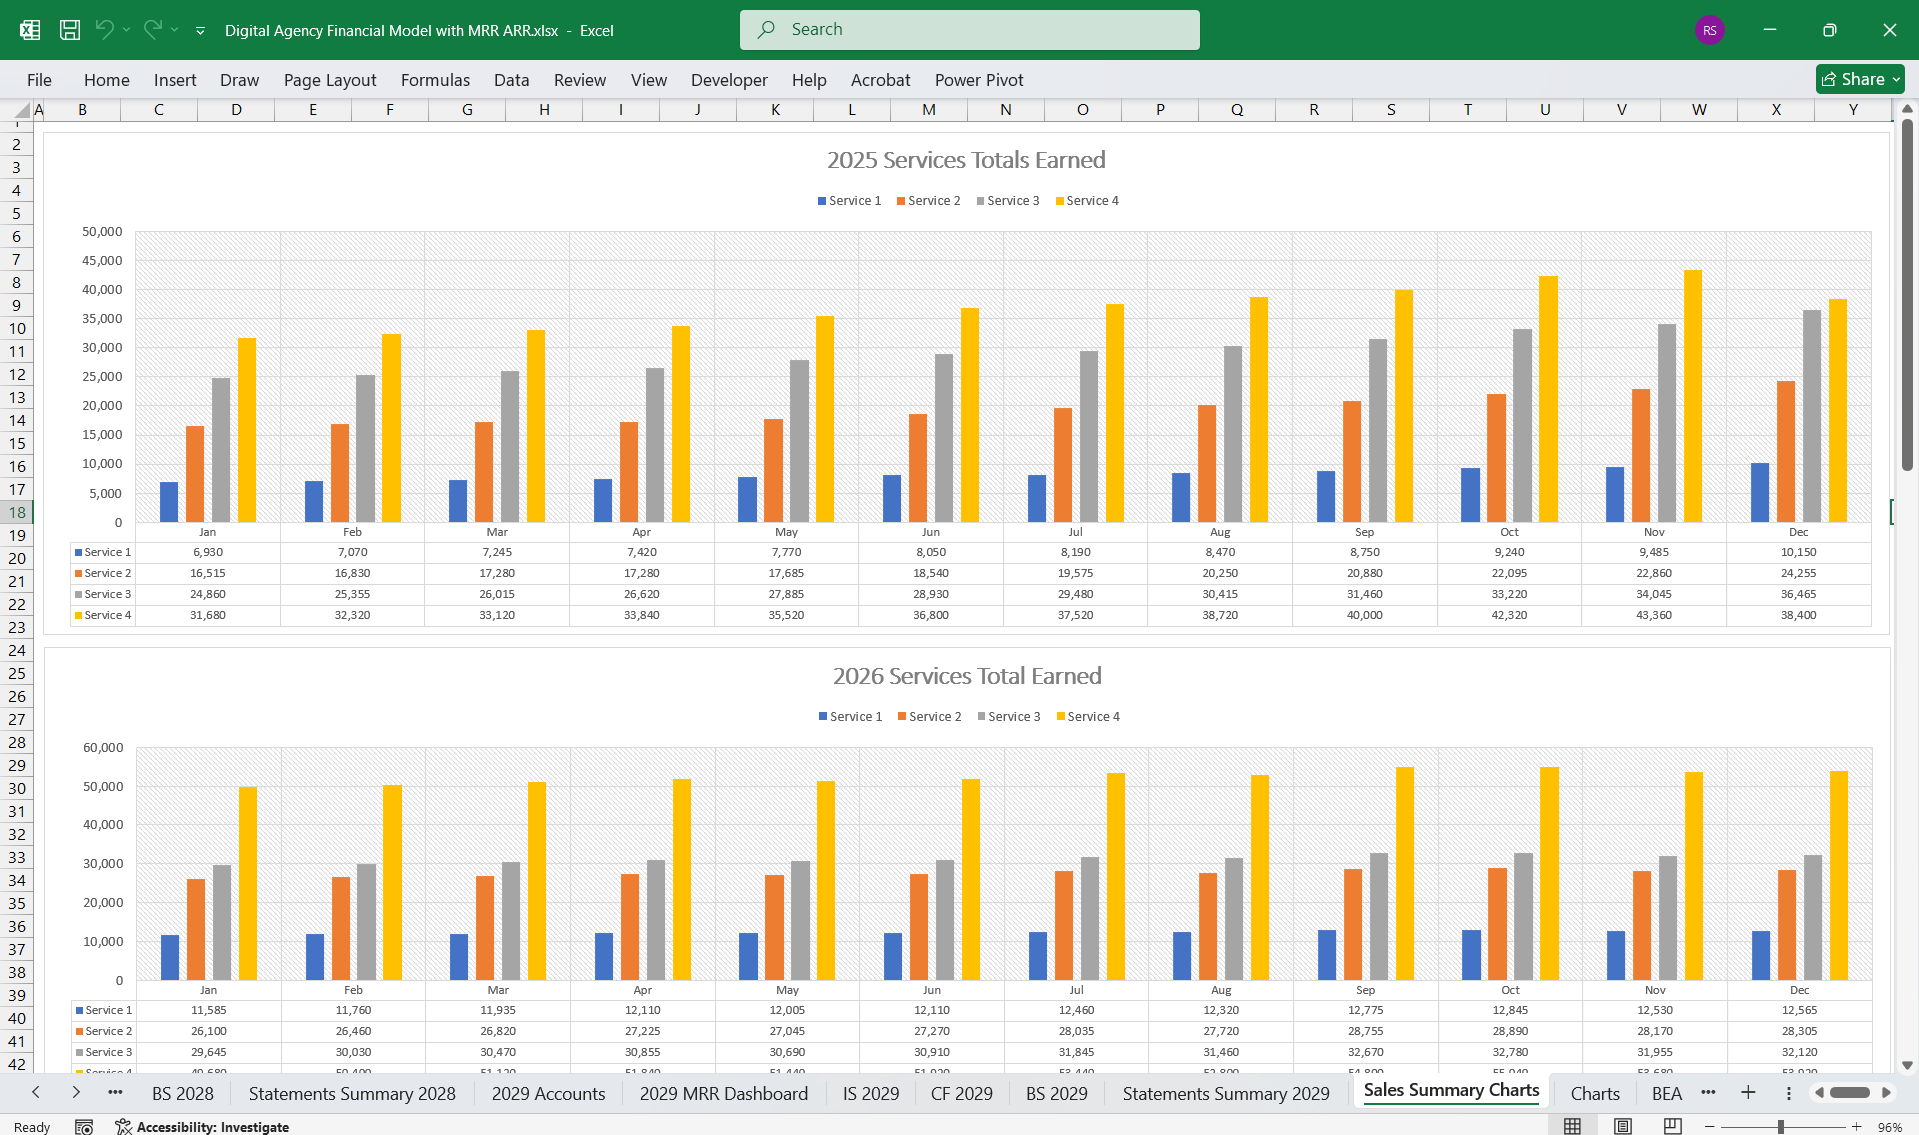
- MRR by Tier:
- Breakdown of MRR across different subscription plans (e.g., Basic, Standard, Premium).
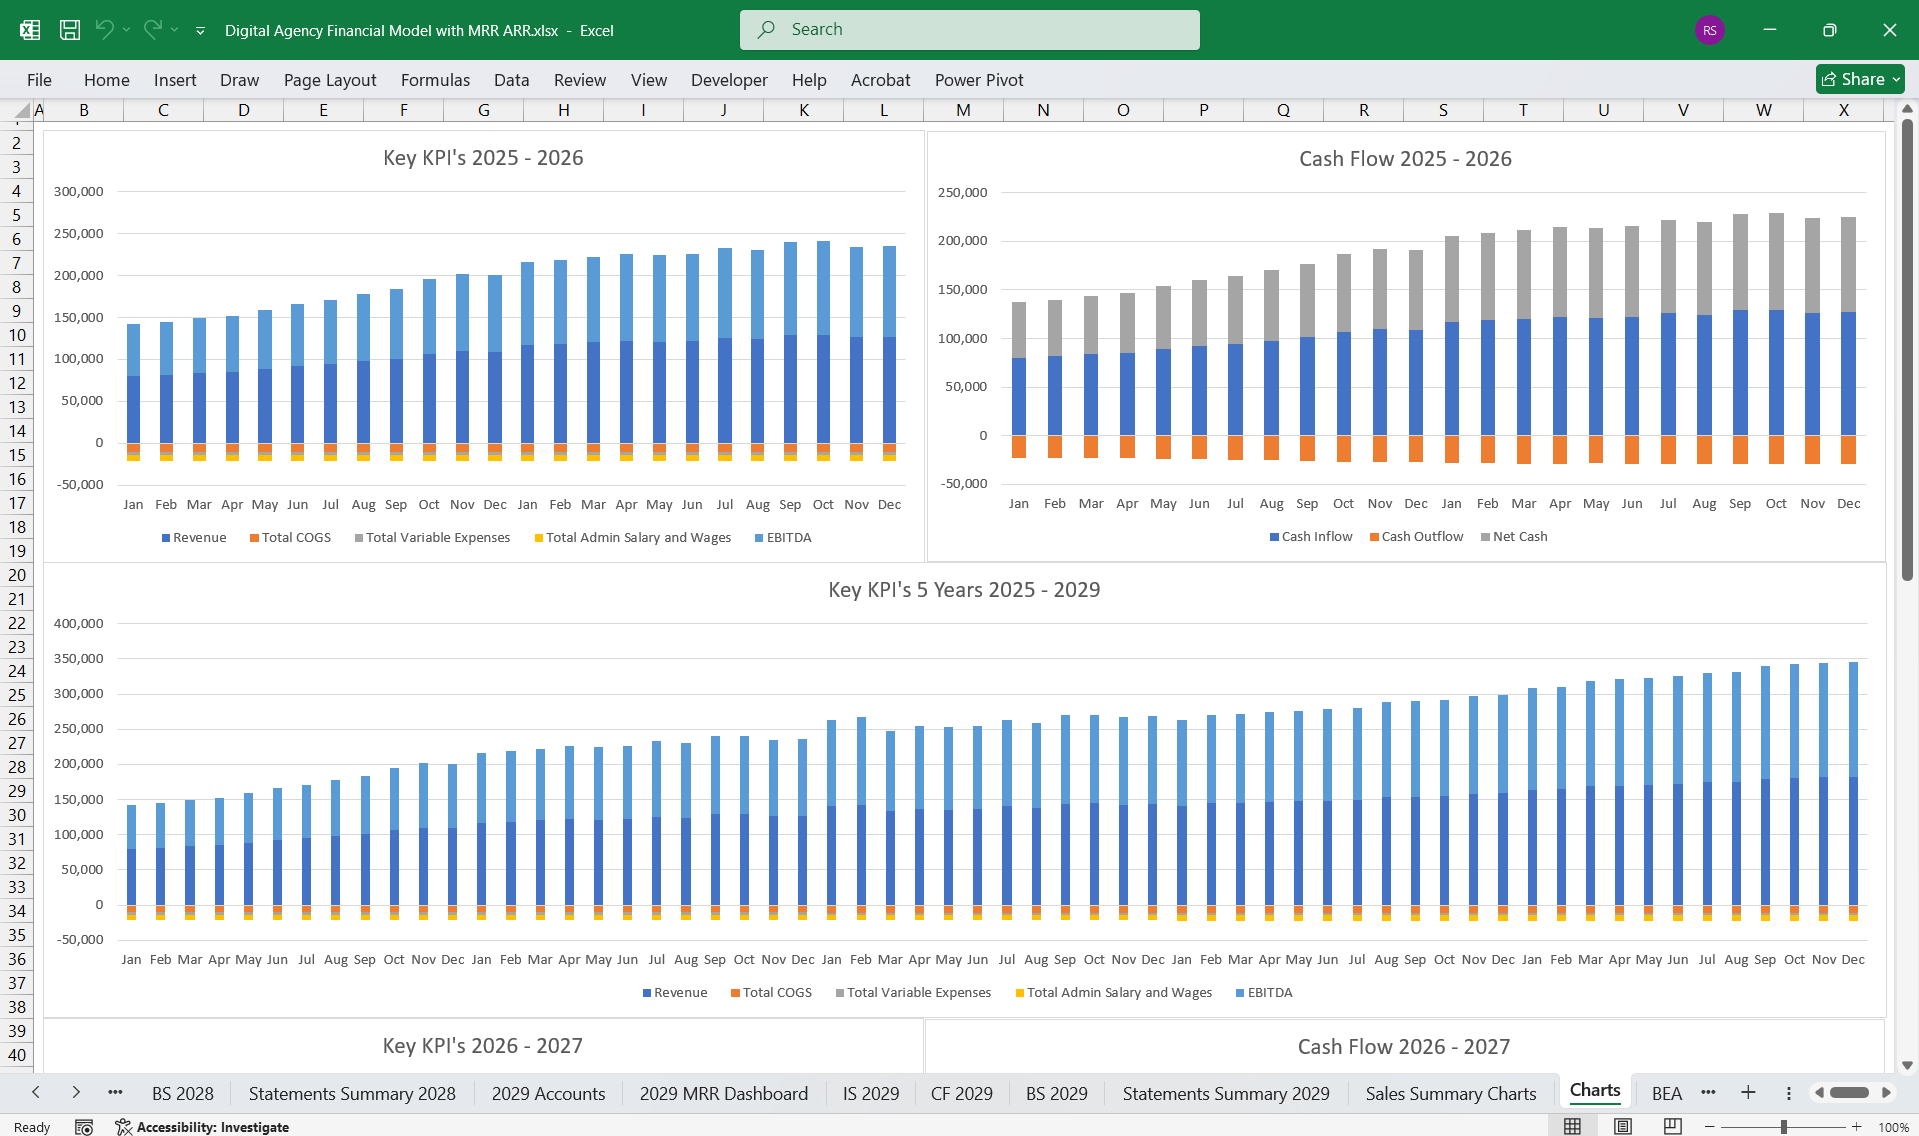
- MRR Growth:
- Month-over-month MRR change percentage.
- Churn Analysis:
- Identify patterns or reasons for subscriber cancellations.
- ARR Projections:
- Forecast ARR based on historical MRR trends and growth rates.
This Best Practice includes
1 Excel Financial Model
Further information
Eliminates the need to create network upgrade cost trackers from scratch and includes all common digital agency finance actual and projection components.
