
Originally published: 19/12/2022 12:29
Last version published: 21/12/2022 10:54
Publication number: ELQ-81803-2
View all versions & Certificate
Last version published: 21/12/2022 10:54
Publication number: ELQ-81803-2
View all versions & Certificate

Employee Administration Dashboard Power BI Template
Simplify HR reporting in your organization with this simple and effective Employee Admin Dashboard in Power BI.
hrhr dashboardpower bi dashboardhr power bi reportsadmin dashboardhr admin reporthr templateshr admin dashboard
Description
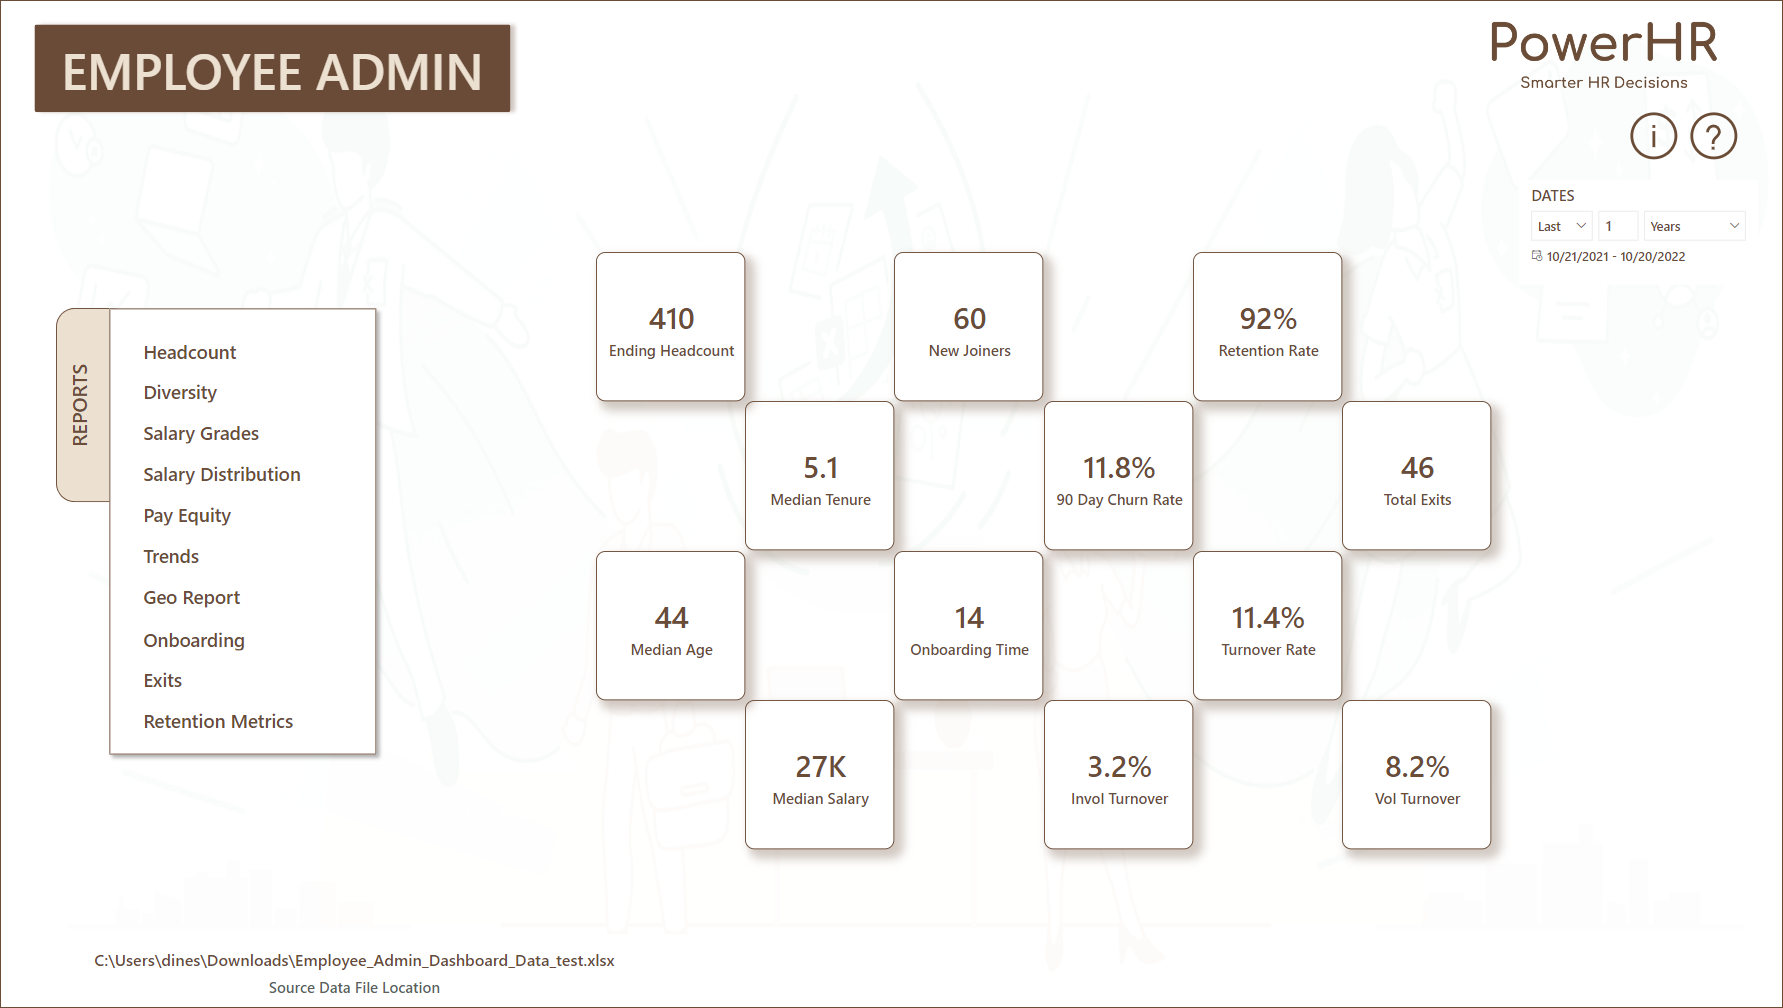
Would you like to have automated reports on Headcount, Retention, Diversity, Pay Equity, Onboarding and more?
Want to have instant access to key HR metrics like Headcount, Turnover Rate, Avg. Onboarding Time, Median Salary, and Retention Rate?
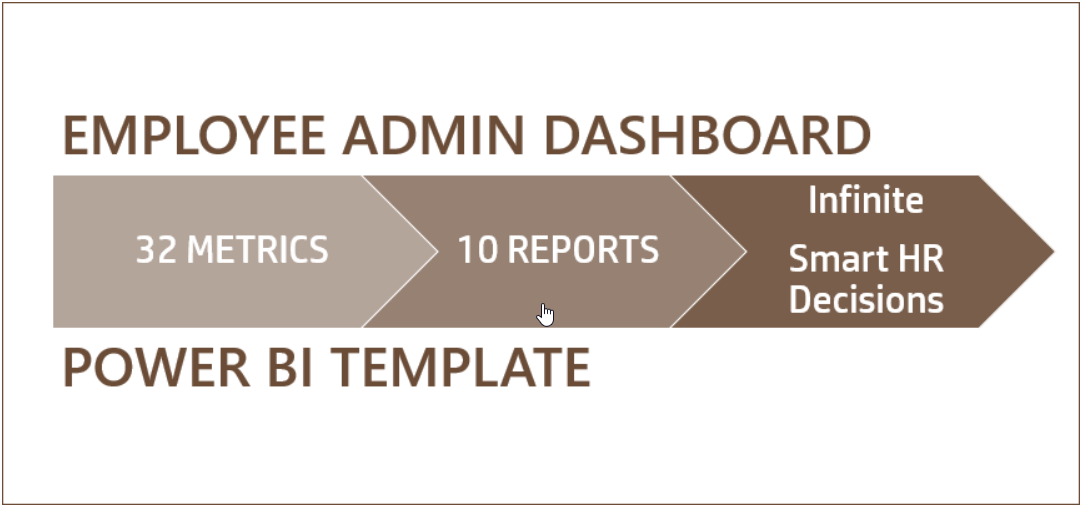
Get instant access to 32 relevant HR metrics in 10 actionable HR reports and take infinite smart HR decisions.
Given below are the reports and metrics included in the template:
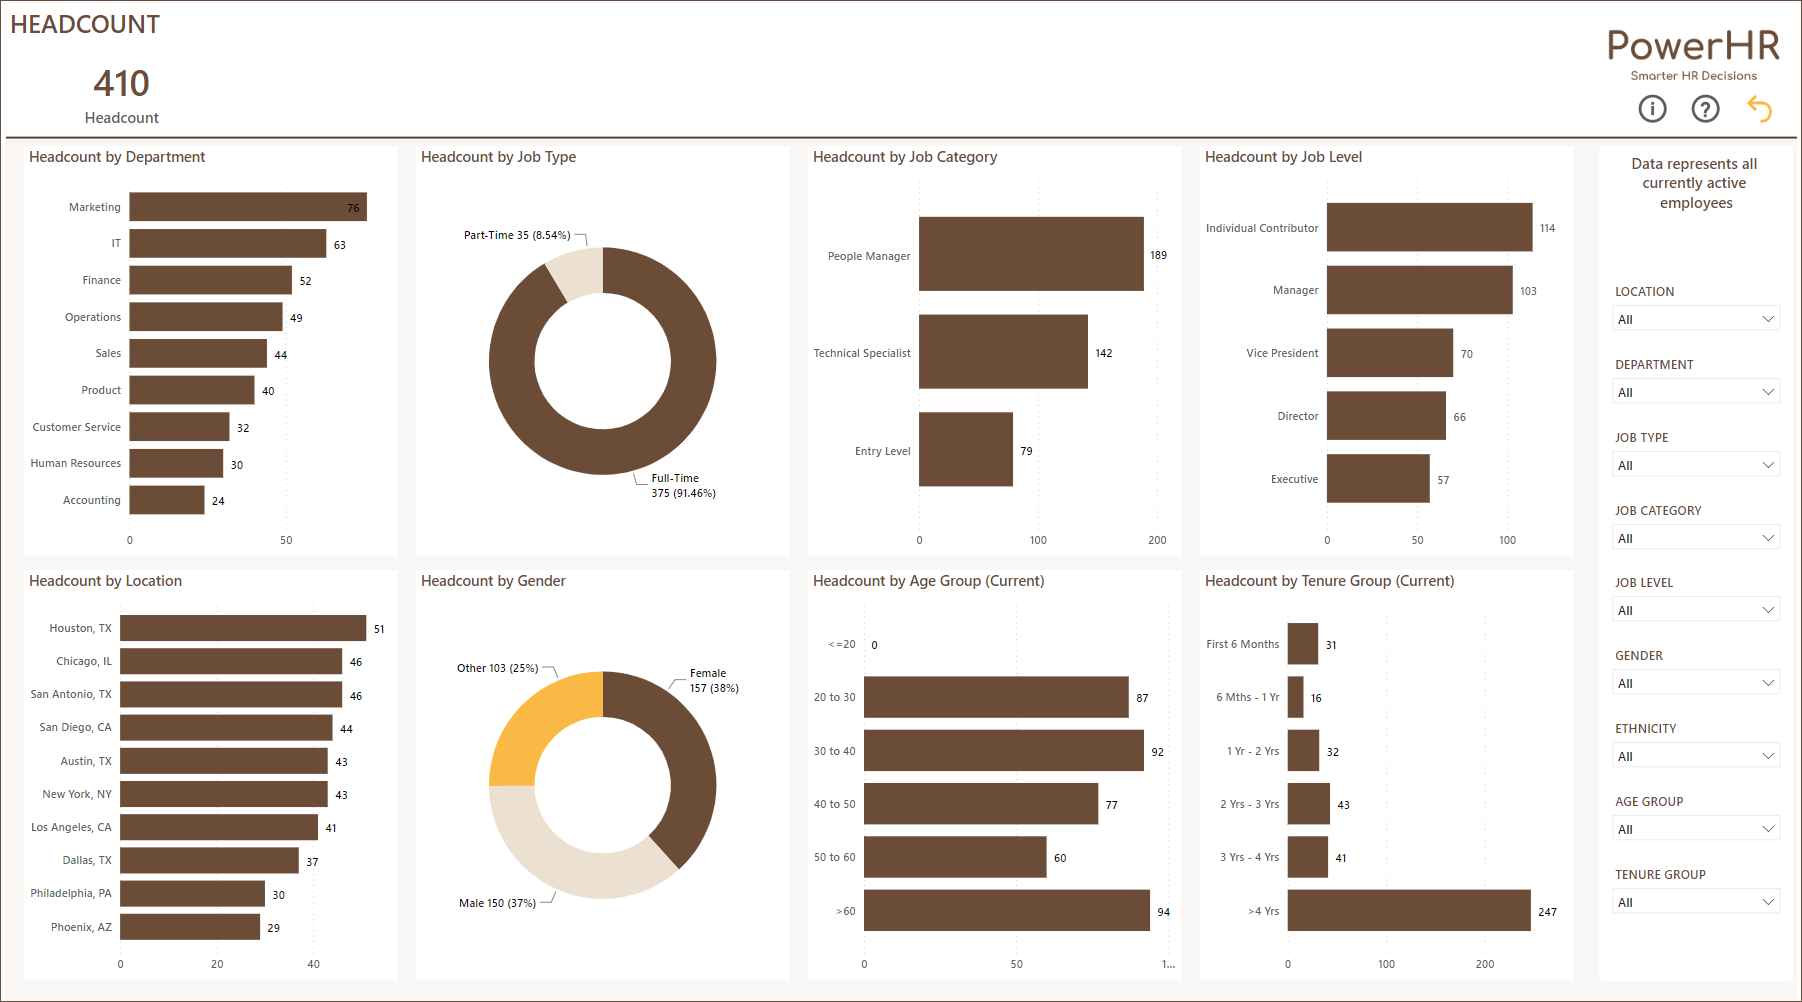
Headcount Report
Know exactly how many employees are active and where there are by Organizational and Employee groups.
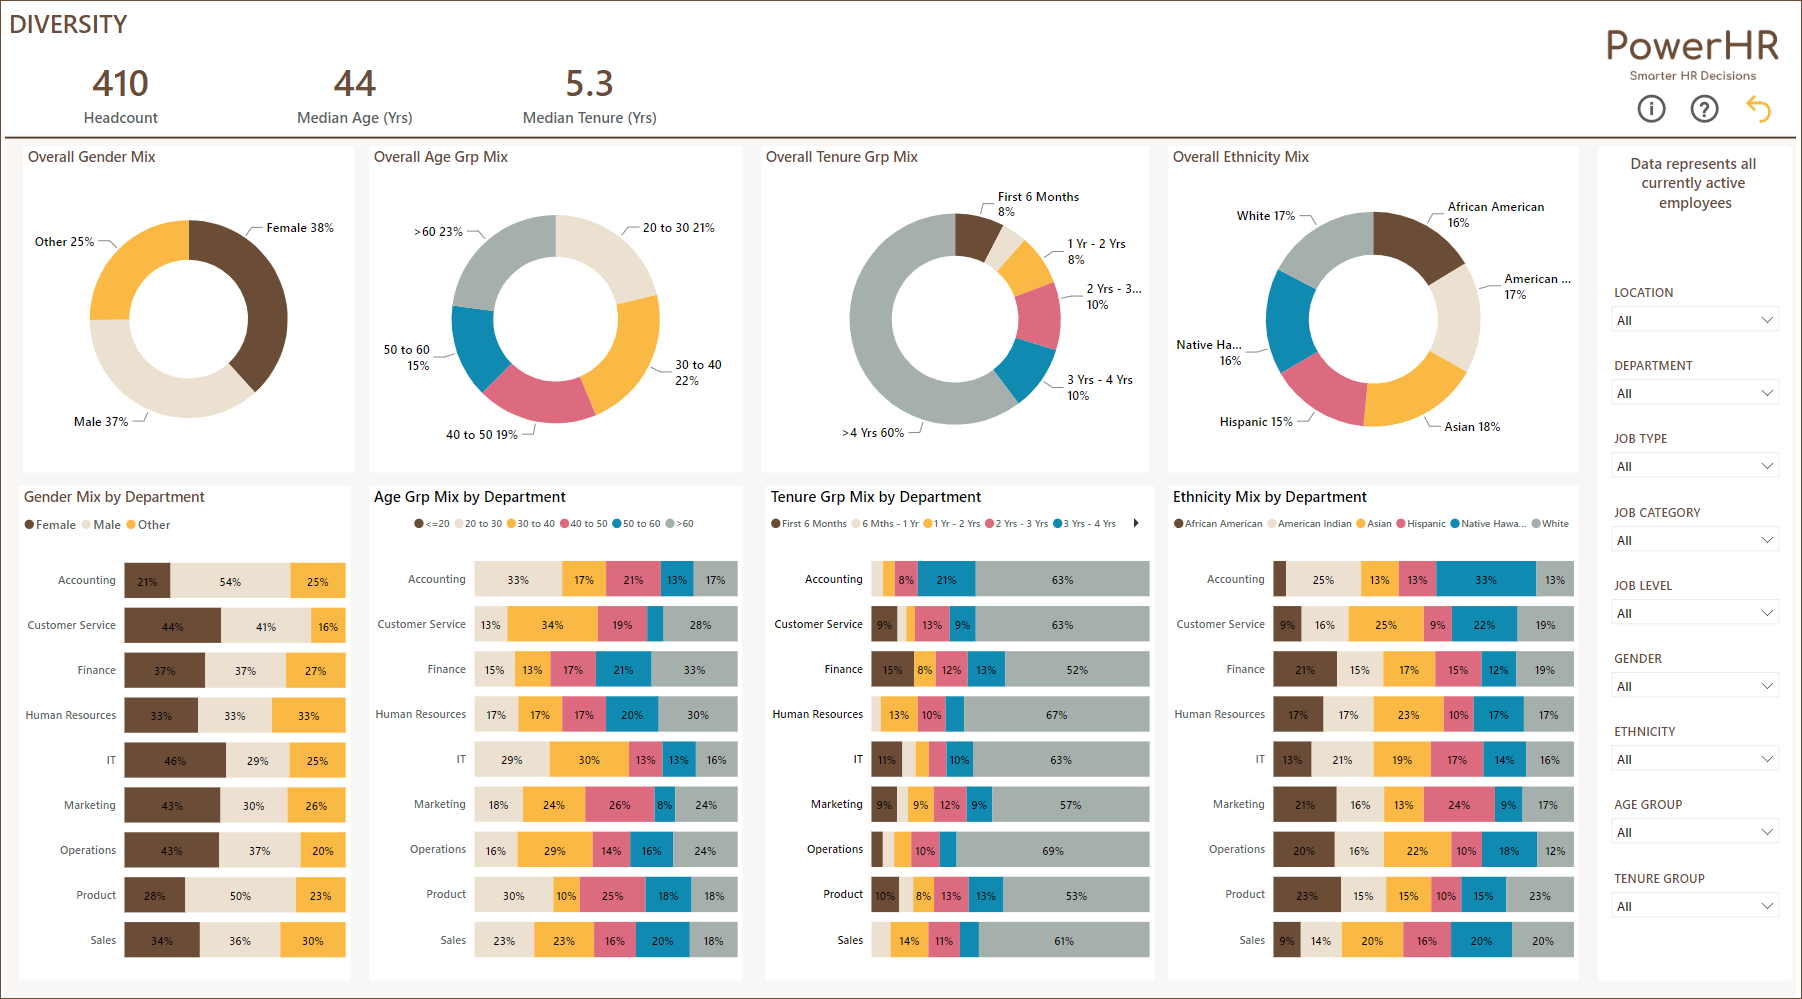
Diversity Report
Quickly see the Gender mix, Tenure mix, Age Group mix, and Ethnicity mix of employees.
Also, identify if the mix is skewed in any departments.
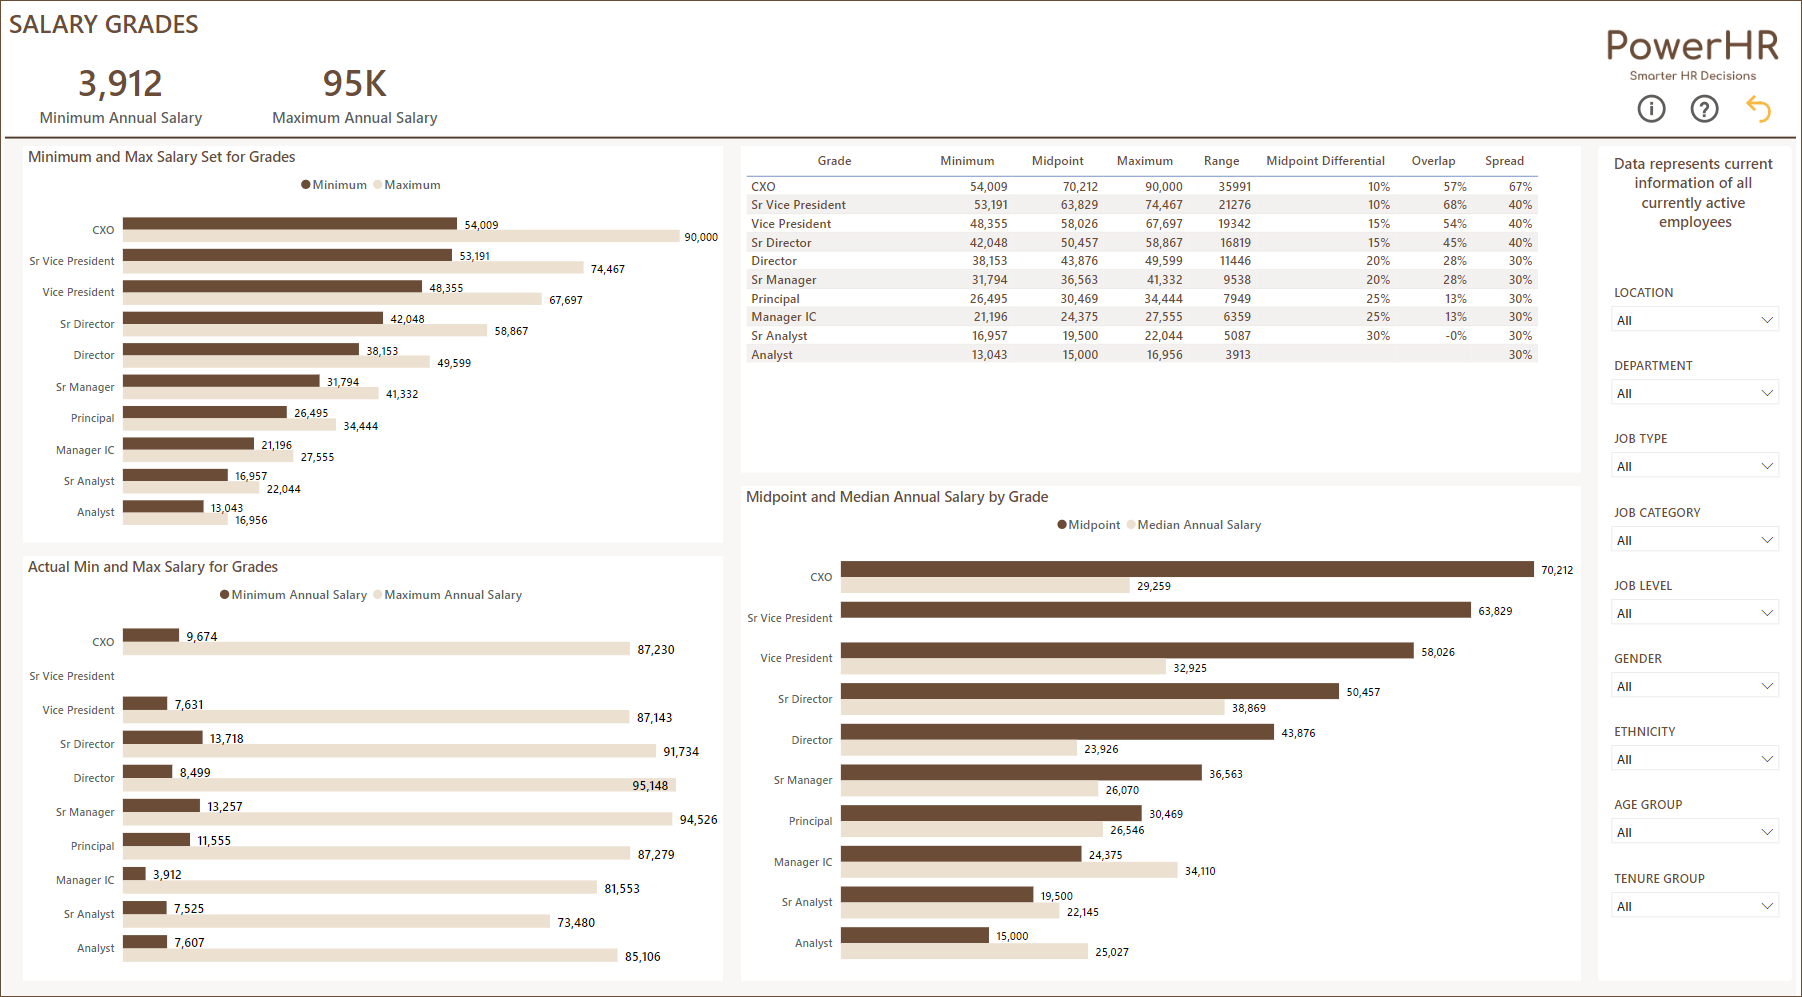
Salary Grade Report
View the actual salary range vs the expected salary range in each Salary Grade.
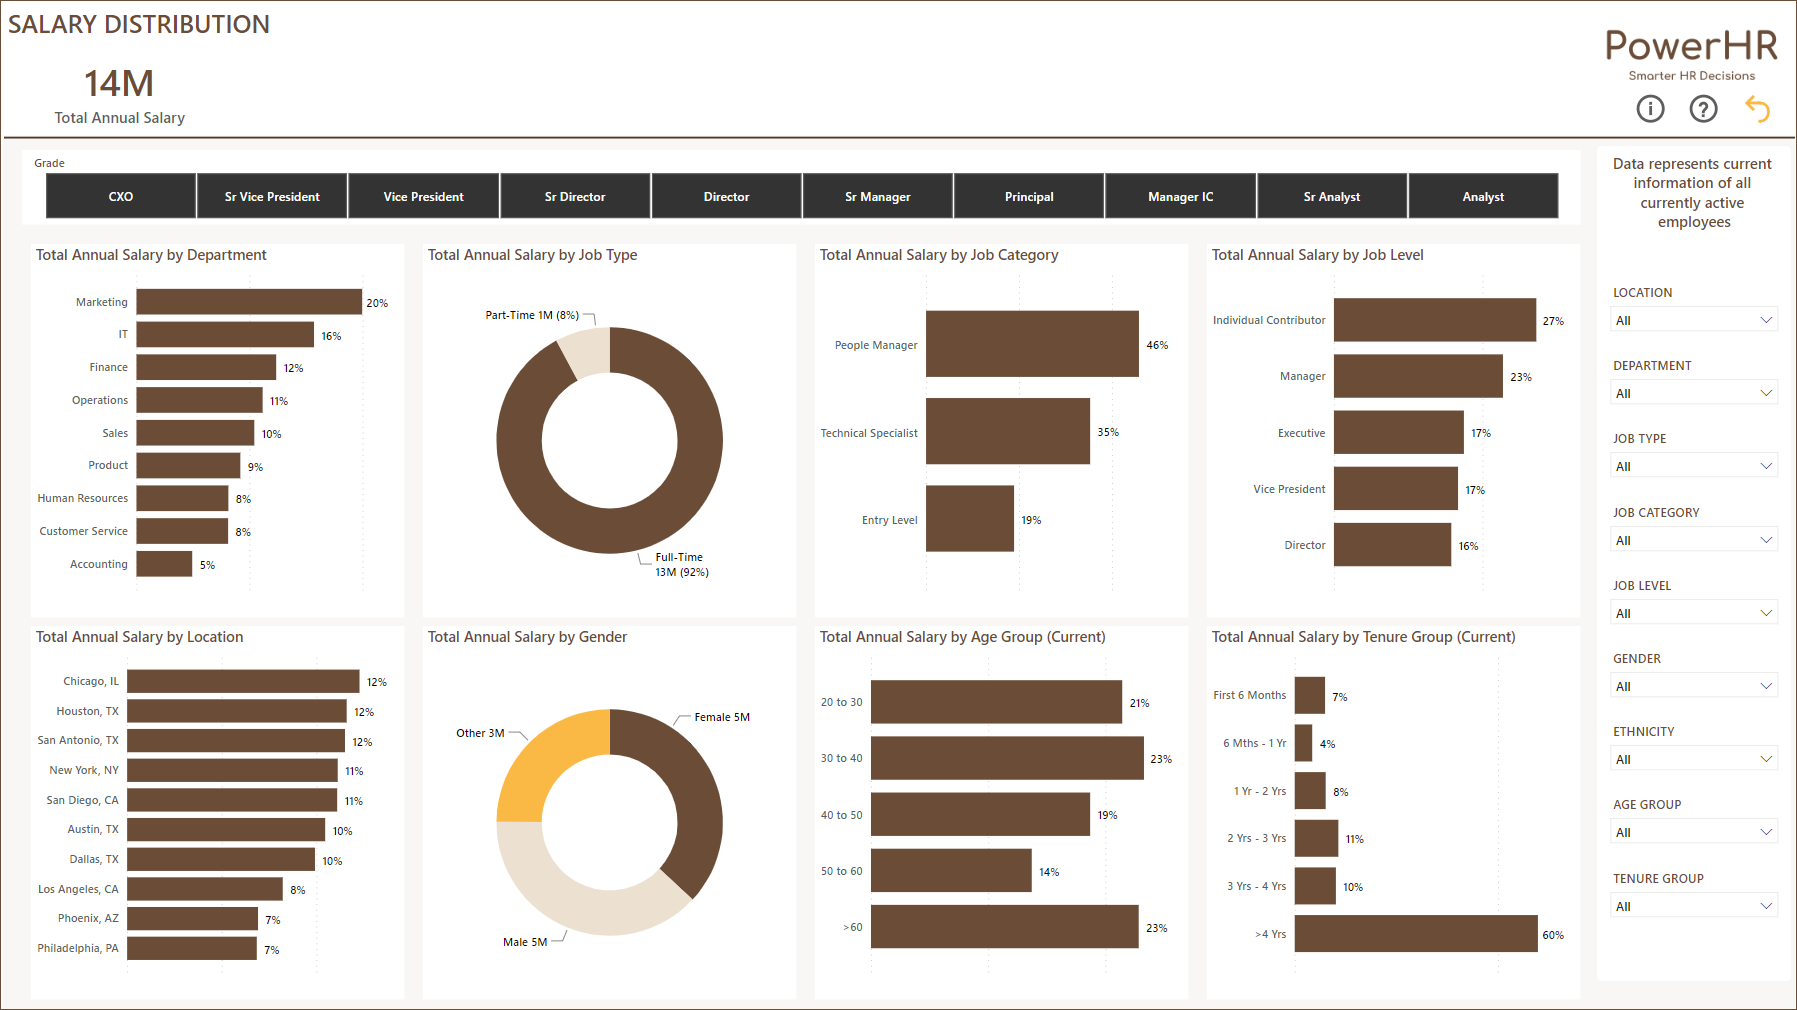
Salary Distribution Report
Gain insights into how the salary is distributed within the company by Employee and Organizational groups.
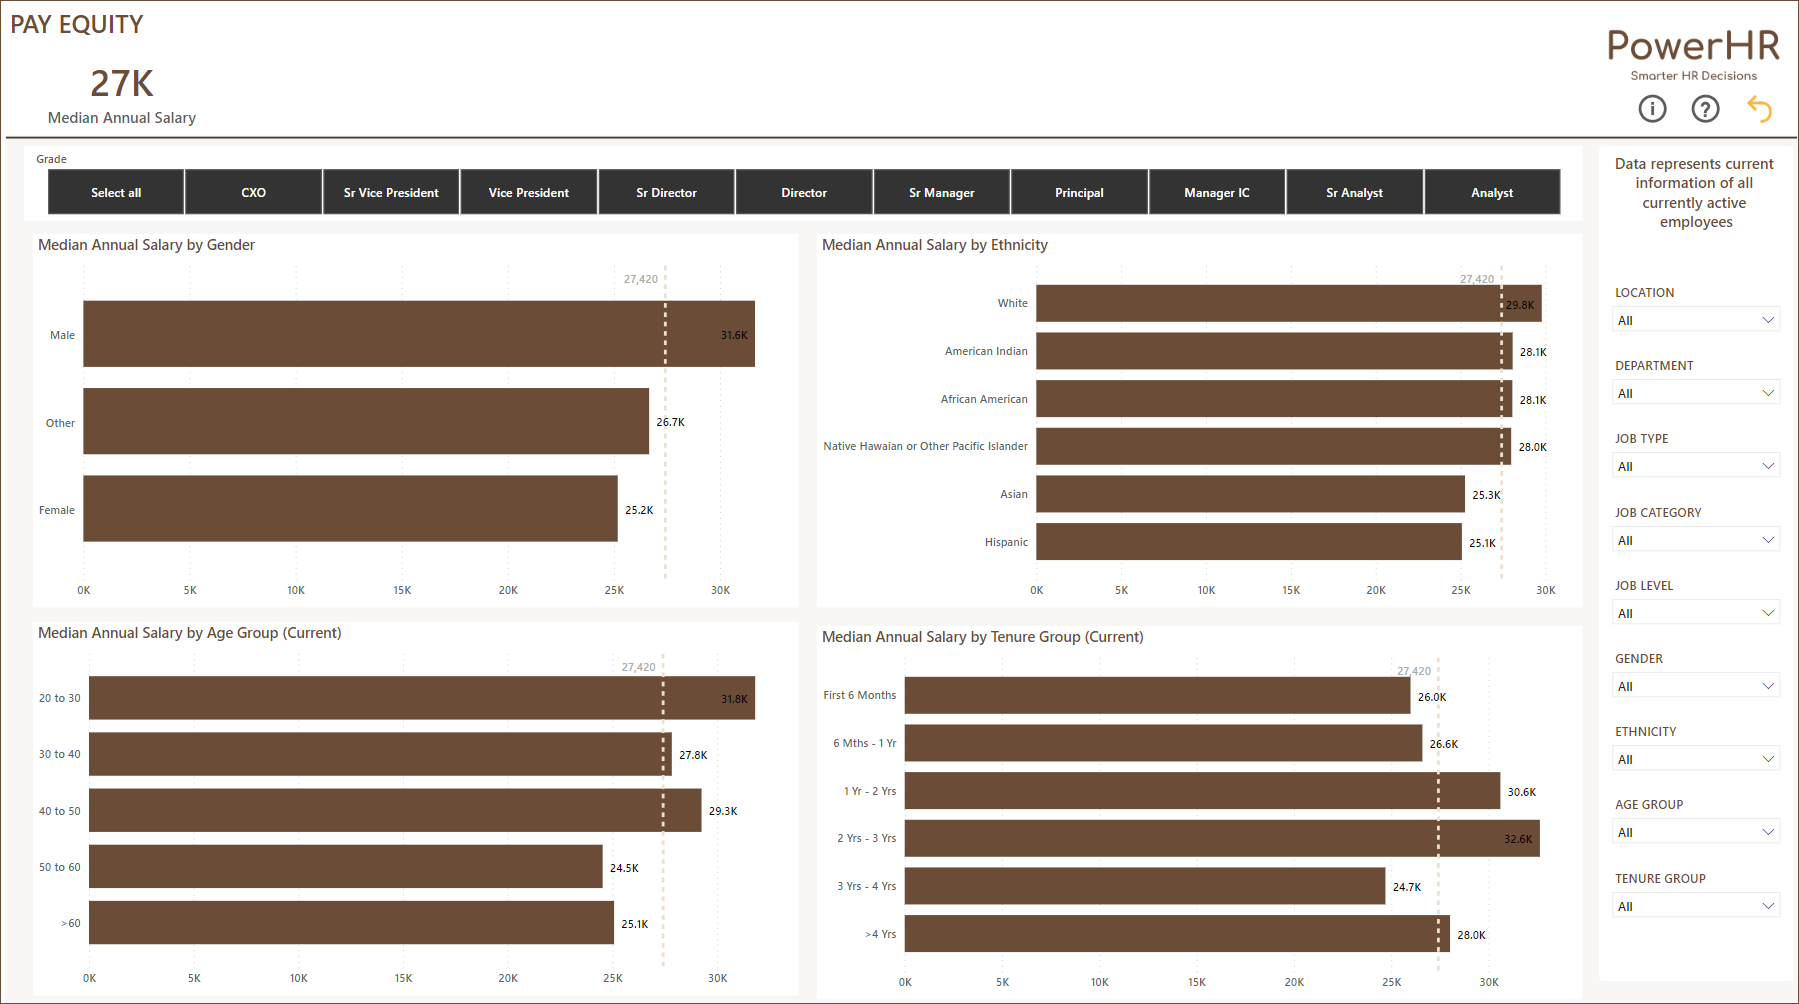
Pay Equity Report
Ensure that there is fairness in Pay among employee groups (by Gender, Age, Tenure, and Ethnicity).
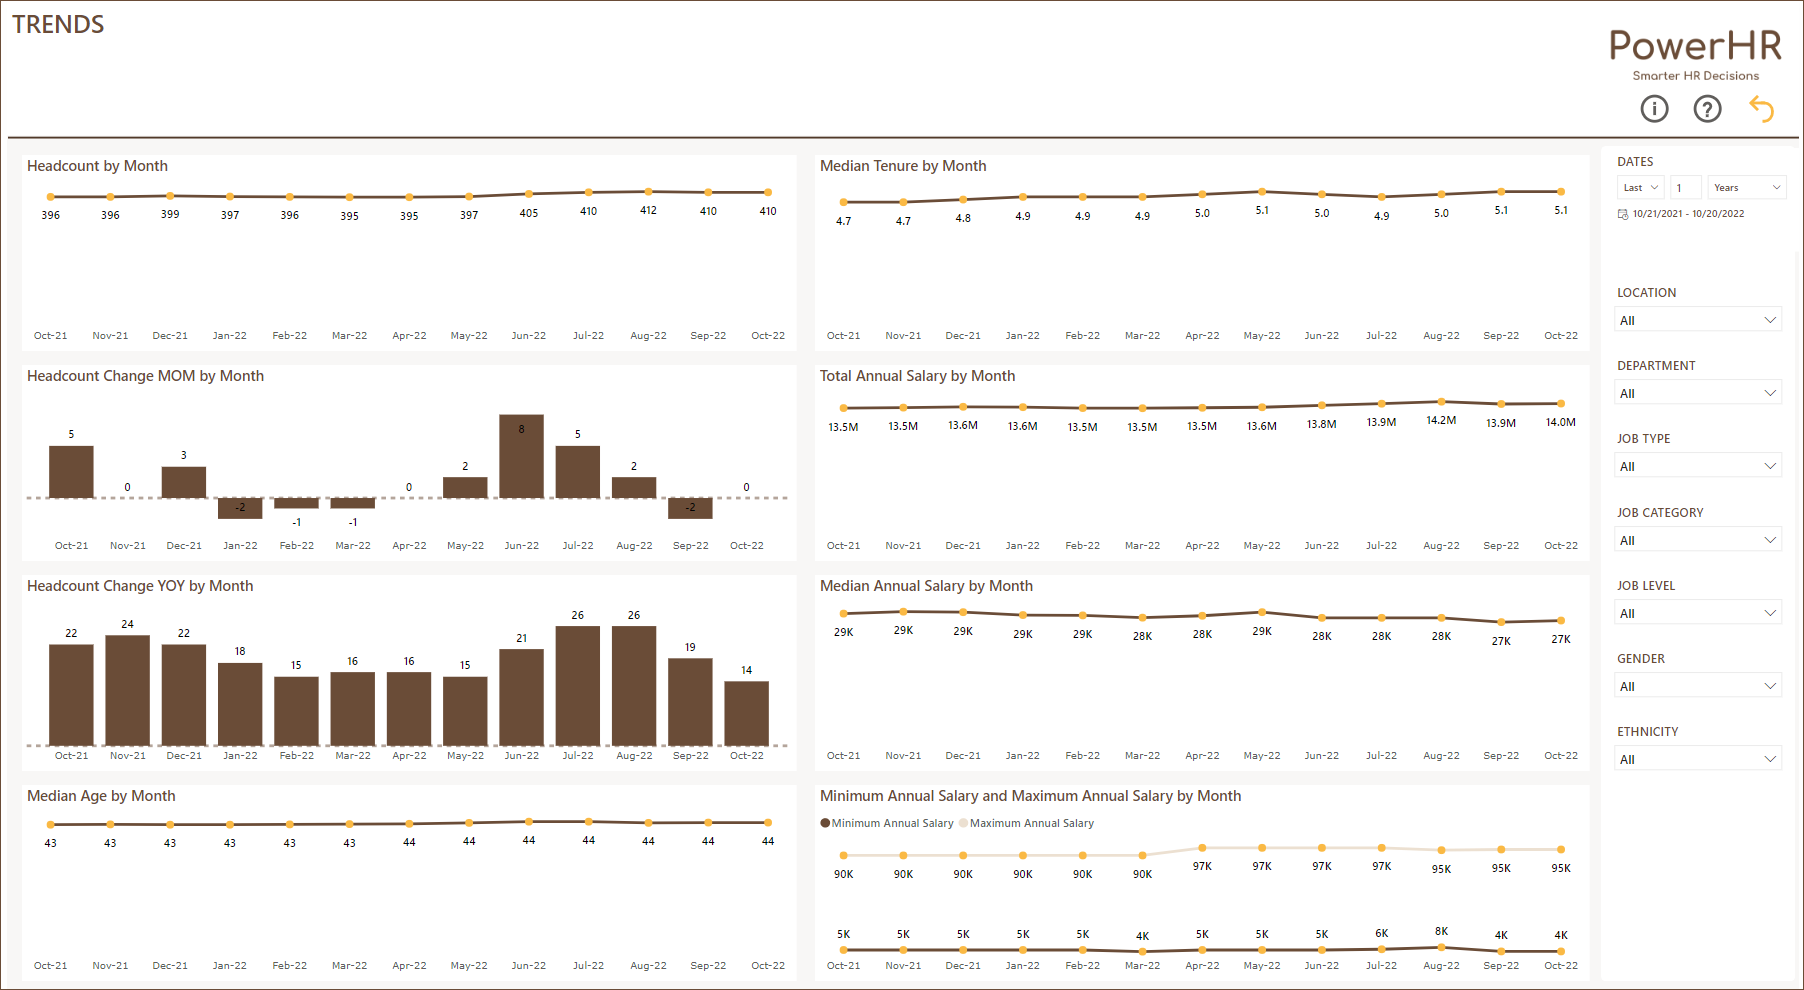
Trends Report
View metrics (Headcount, Median Age, Median Tenure, Median Salary, Min and Max Salaries) by month to understand the trends.
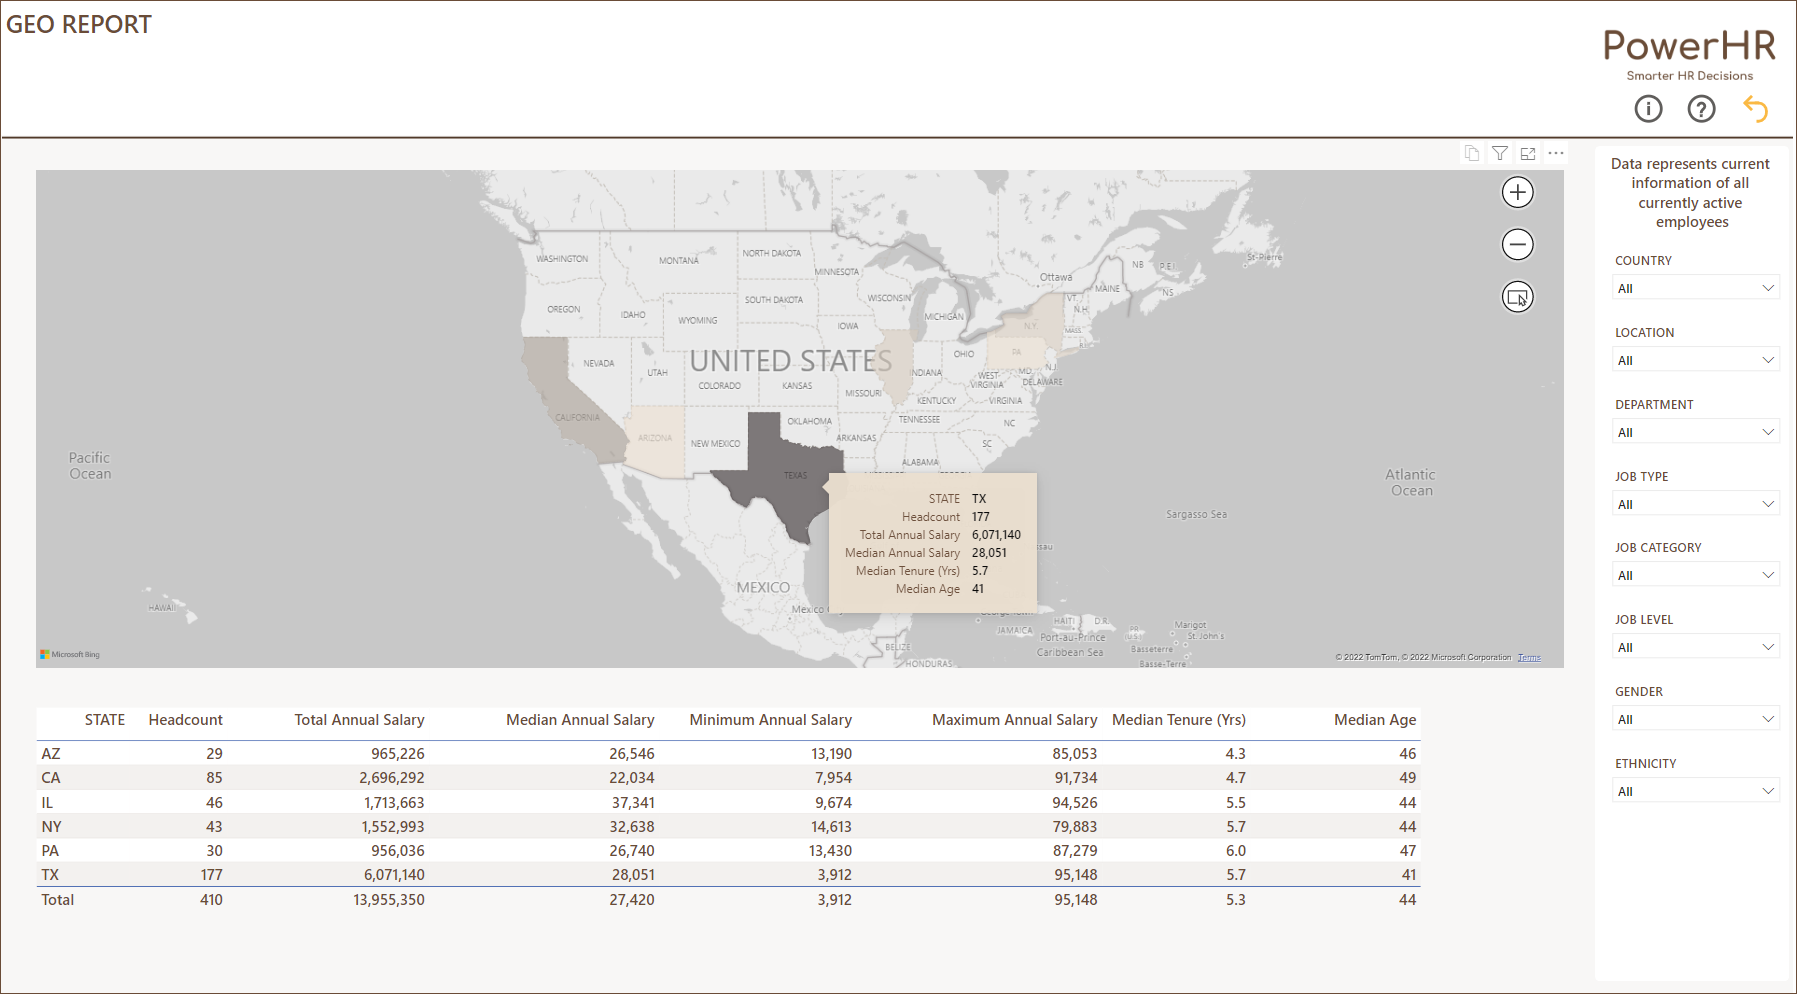
Geo Report
View HR metrics by Geolocation of the Offices on the Map visual.
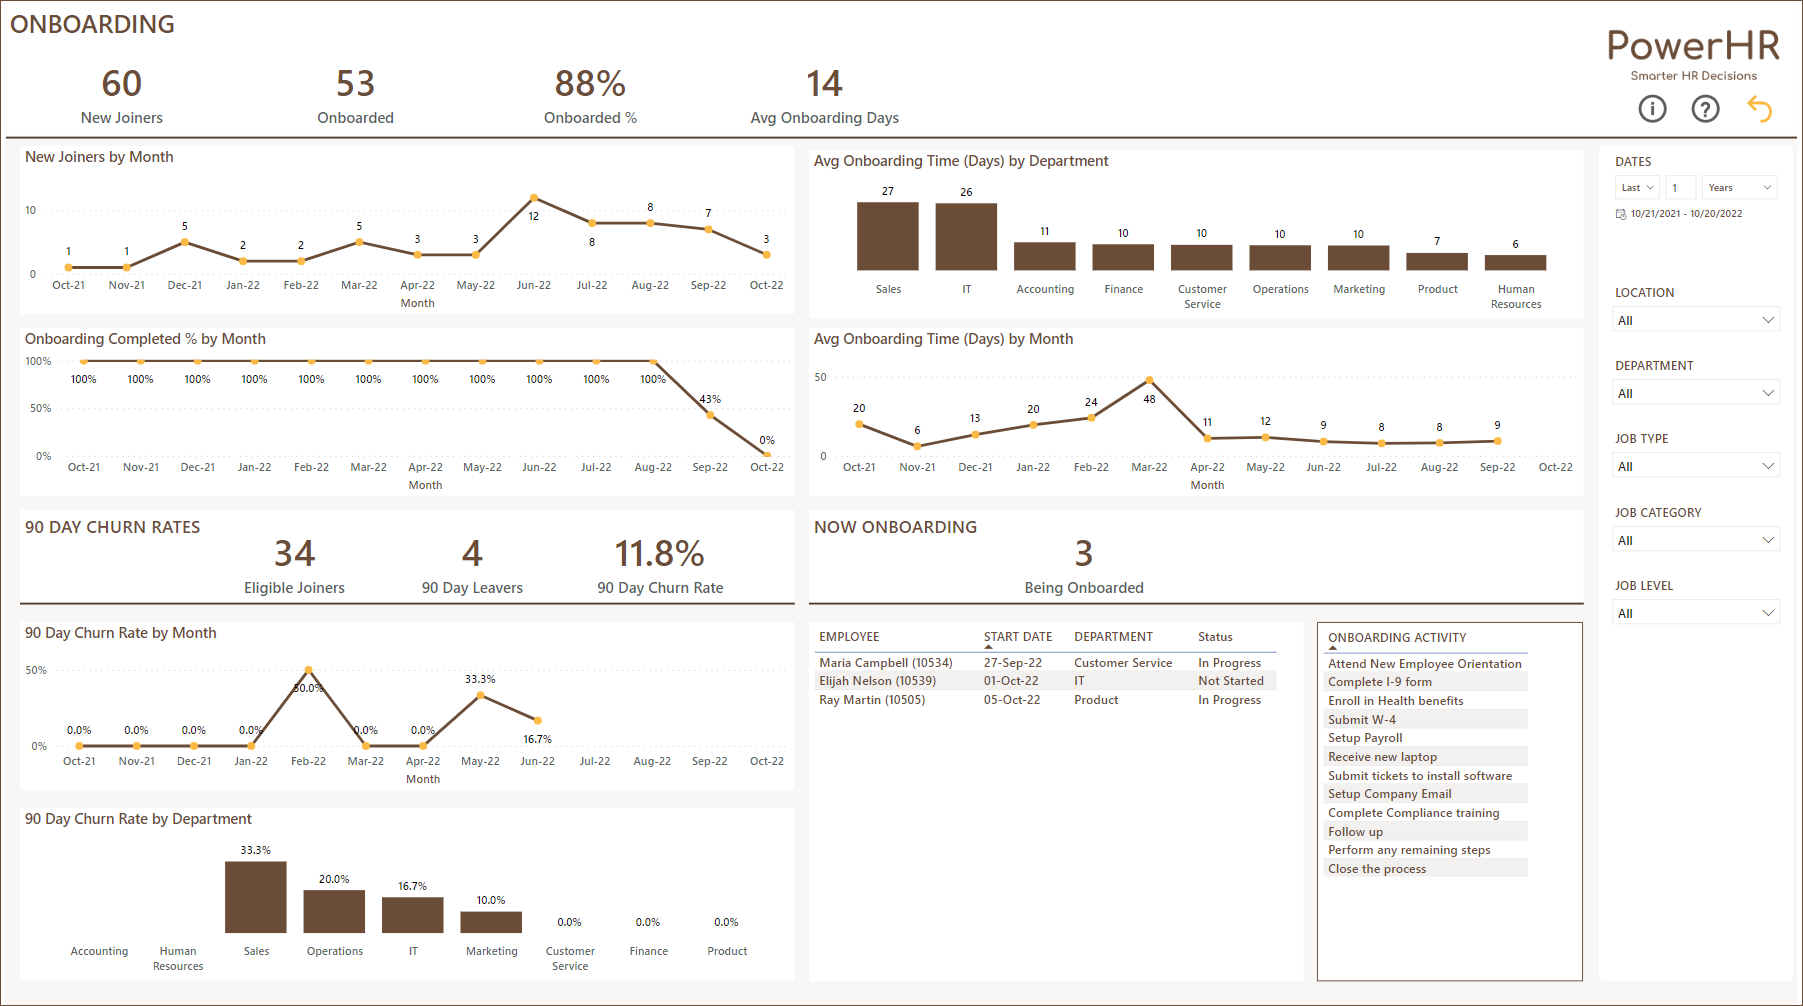
Onboarding Report
View Onboarding completion % and Avg. Onboarding time for new employees. You can also see the 90-day churn/leaver rates.
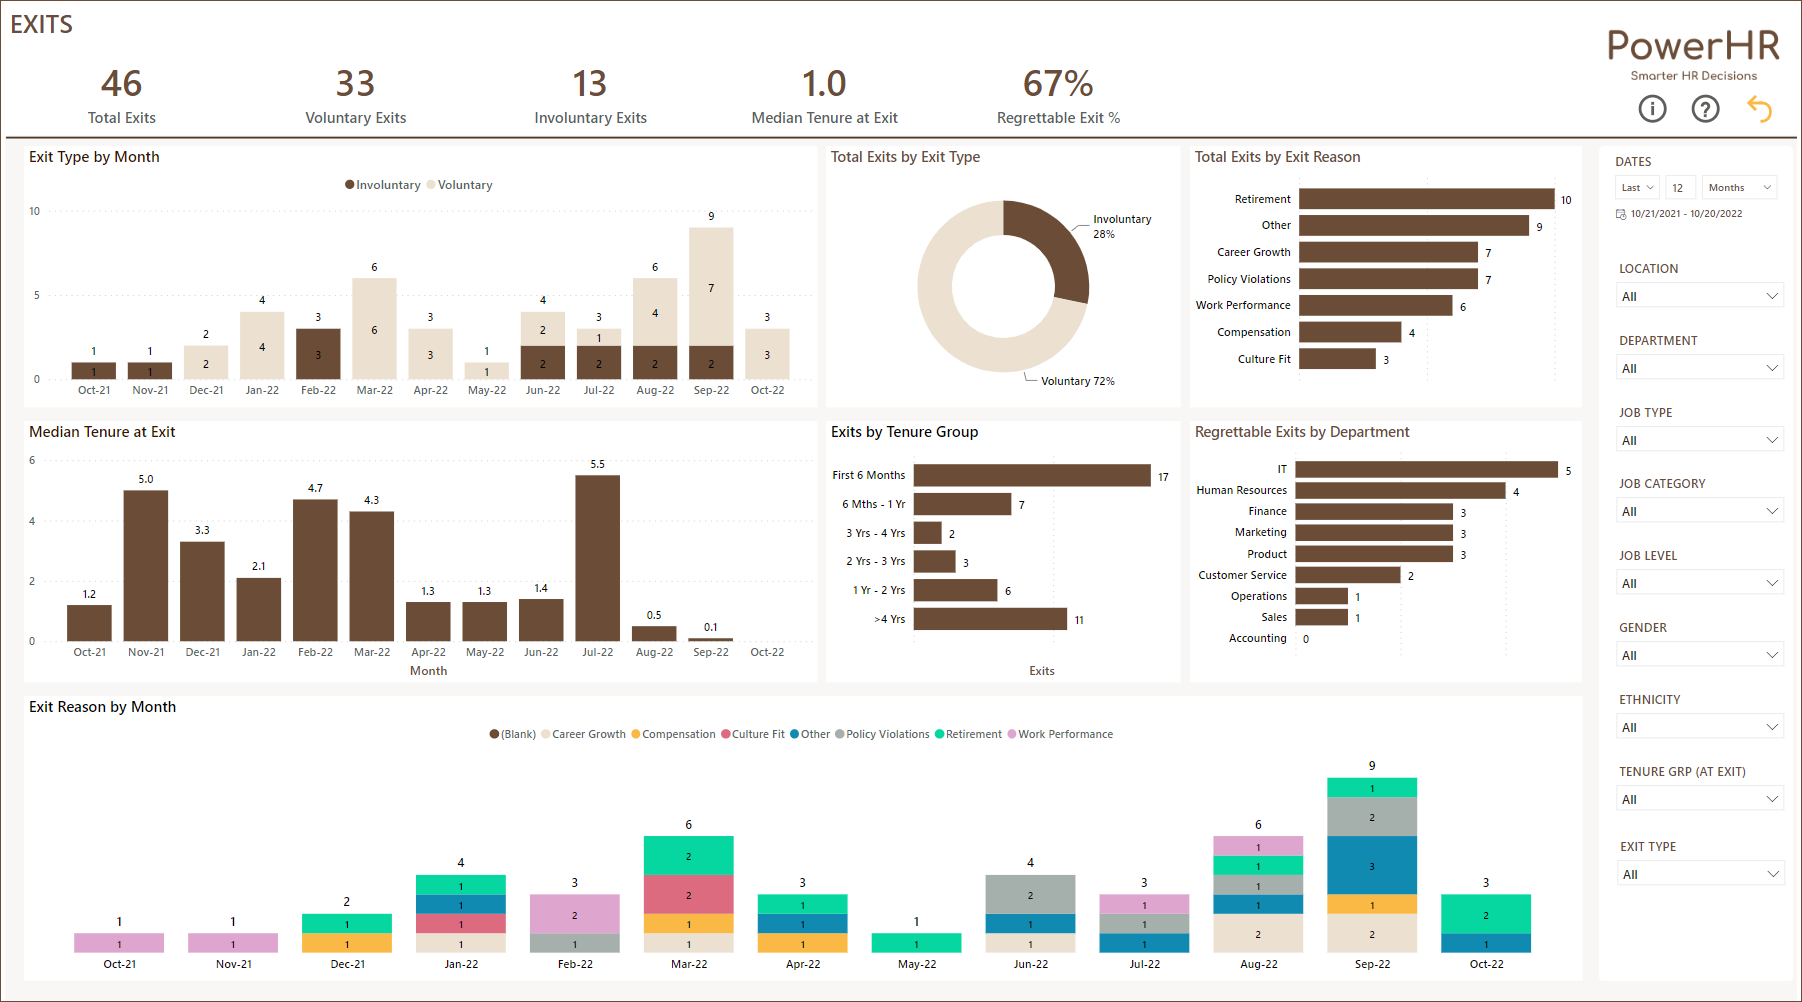
Exits Report
Important exit metrics including Voluntary and Involuntary exits, Median tenure at Exit, and Regrettable Exit % are captured in the Exits report.
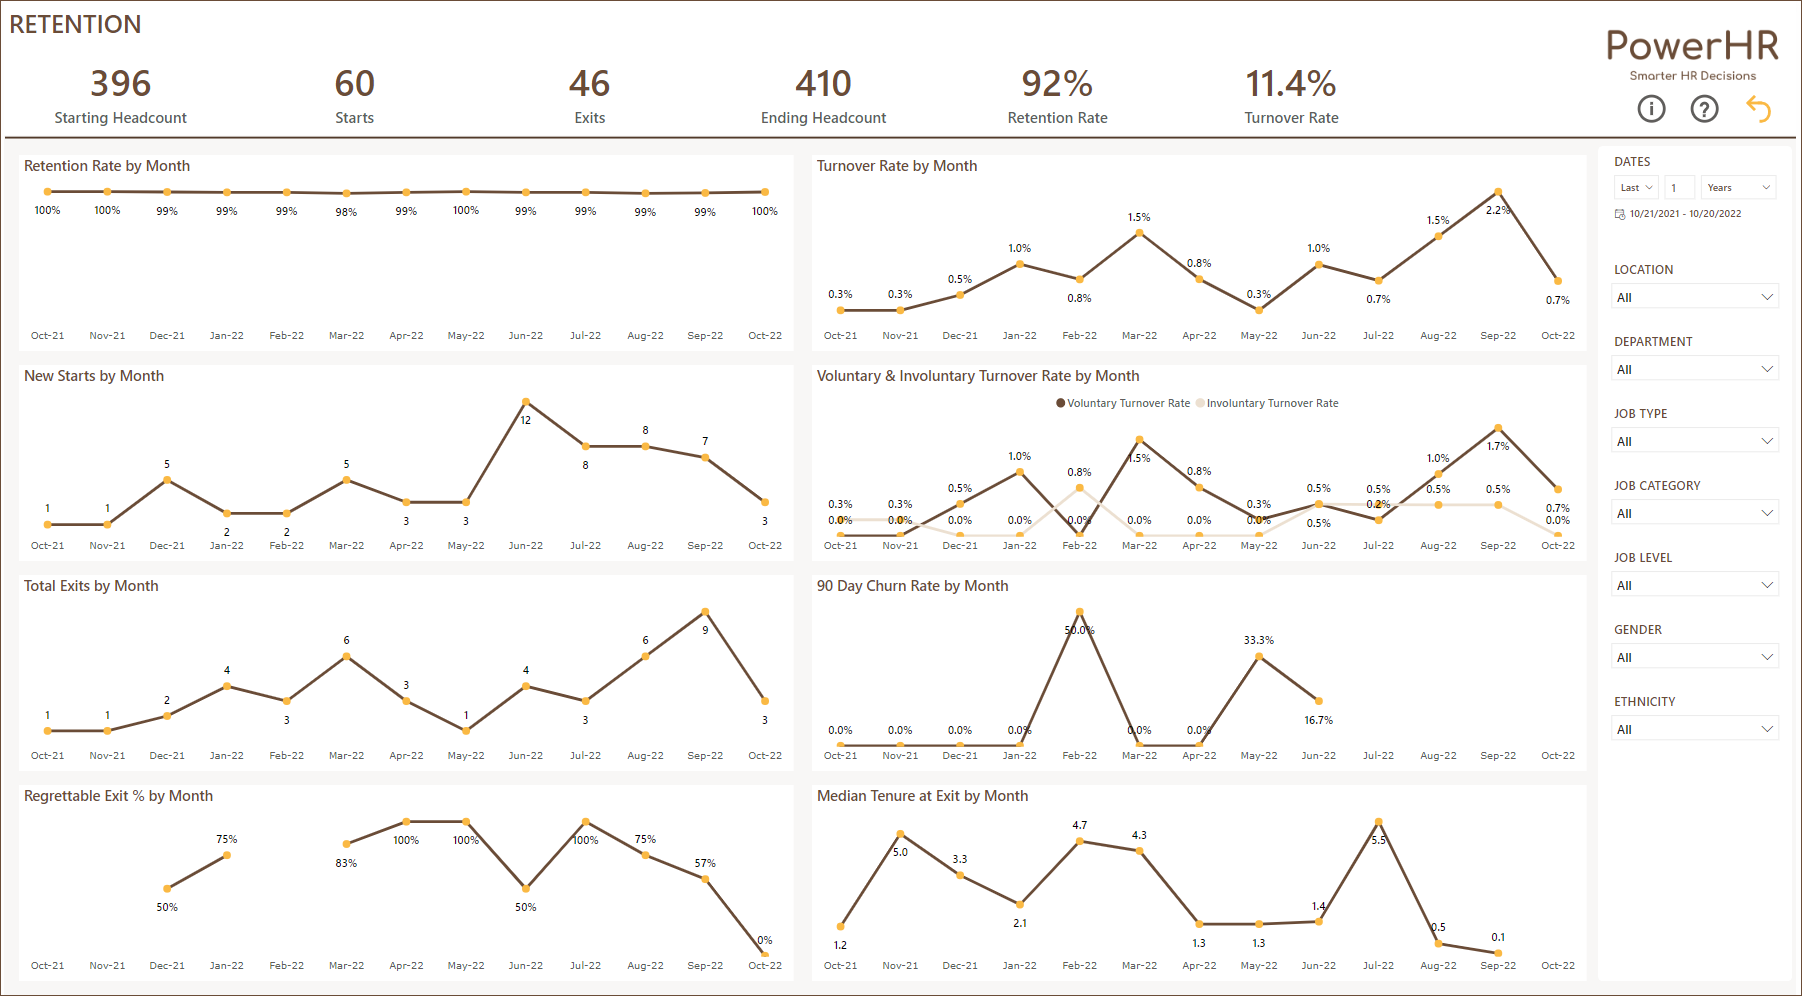
Retention Report
Retention Rate, Turnover Rates, and 90-day Churn rates are the focus of the Retention Report.
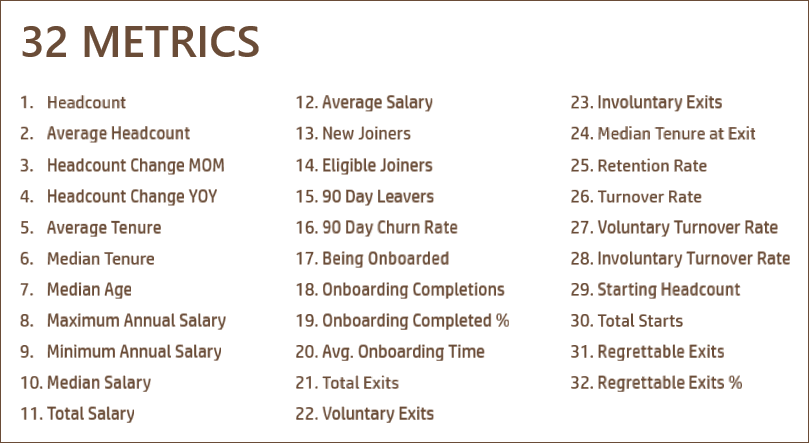
32 Metrics
You will have instant access to 32 HR metrics in the Power BI file. They are used in the 10 reports. You can also create your own reports and visuals using the metrics.
Interactive, Customizable & Expandable Reports
All the reports have filters that allow you to narrow down the data according to your needs.
You can easily customize the entire Power BI report by modifying the theme colors/fonts or customizing specific visuals individually.
If you have used Power BI before, you can add more reports in the Power BI file or modify existing reports easily.
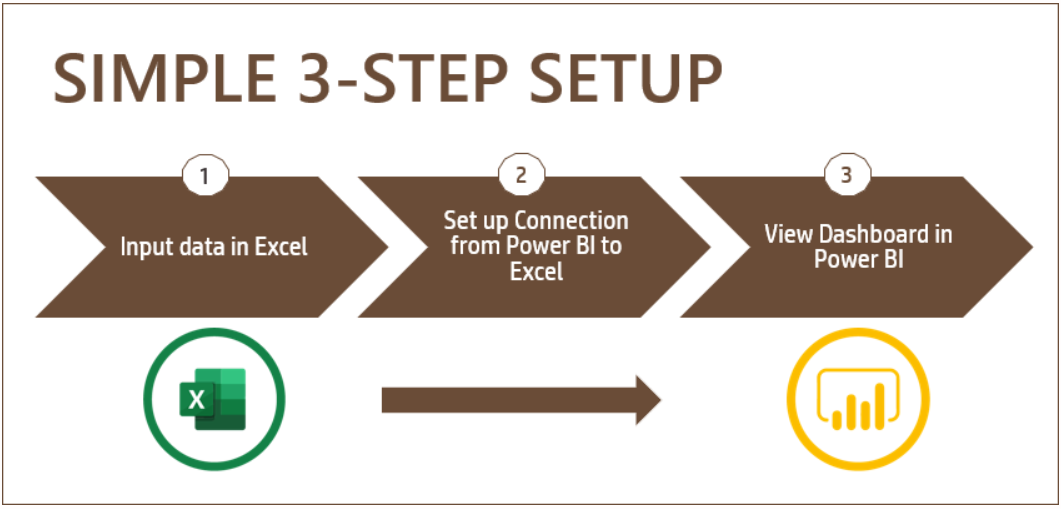
Simple 3-Step Setup
A simple 3-step process to get you started immediately and get instant reports.
You will receive a Power BI file and an Excel file when you purchase. You can download both and save them on your local desktop or on a cloud drive such as One Drive or SharePoint.
1. Enter input data in an Excel file (Use the sample Excel file for reference)
2. Set up the connection from the Power BI file to the Excel file.
3. View reports in Power BI
Our Promise
Our promise to you is that after downloading this Power BI template, within 15 minutes,
You will have a clear and simple streamlined process to enter and manage employee data and instant access to crucial metrics and reports.
You will have insights about your employee data that you can use to take strategic and tactical decisions.
Would you like to have automated reports on Headcount, Retention, Diversity, Pay Equity, Onboarding and more?
Want to have instant access to key HR metrics like Headcount, Turnover Rate, Avg. Onboarding Time, Median Salary, and Retention Rate?
Get instant access to 32 relevant HR metrics in 10 actionable HR reports and take infinite smart HR decisions.
Given below are the reports and metrics included in the template:
Headcount Report
Know exactly how many employees are active and where there are by Organizational and Employee groups.
Diversity Report
Quickly see the Gender mix, Tenure mix, Age Group mix, and Ethnicity mix of employees.
Also, identify if the mix is skewed in any departments.
Salary Grade Report
View the actual salary range vs the expected salary range in each Salary Grade.
Salary Distribution Report
Gain insights into how the salary is distributed within the company by Employee and Organizational groups.
Pay Equity Report
Ensure that there is fairness in Pay among employee groups (by Gender, Age, Tenure, and Ethnicity).
Trends Report
View metrics (Headcount, Median Age, Median Tenure, Median Salary, Min and Max Salaries) by month to understand the trends.
Geo Report
View HR metrics by Geolocation of the Offices on the Map visual.
Onboarding Report
View Onboarding completion % and Avg. Onboarding time for new employees. You can also see the 90-day churn/leaver rates.
Exits Report
Important exit metrics including Voluntary and Involuntary exits, Median tenure at Exit, and Regrettable Exit % are captured in the Exits report.
Retention Report
Retention Rate, Turnover Rates, and 90-day Churn rates are the focus of the Retention Report.
32 Metrics
You will have instant access to 32 HR metrics in the Power BI file. They are used in the 10 reports. You can also create your own reports and visuals using the metrics.
Interactive, Customizable & Expandable Reports
All the reports have filters that allow you to narrow down the data according to your needs.
You can easily customize the entire Power BI report by modifying the theme colors/fonts or customizing specific visuals individually.
If you have used Power BI before, you can add more reports in the Power BI file or modify existing reports easily.
Simple 3-Step Setup
A simple 3-step process to get you started immediately and get instant reports.
You will receive a Power BI file and an Excel file when you purchase. You can download both and save them on your local desktop or on a cloud drive such as One Drive or SharePoint.
1. Enter input data in an Excel file (Use the sample Excel file for reference)
2. Set up the connection from the Power BI file to the Excel file.
3. View reports in Power BI
Our Promise
Our promise to you is that after downloading this Power BI template, within 15 minutes,
You will have a clear and simple streamlined process to enter and manage employee data and instant access to crucial metrics and reports.
You will have insights about your employee data that you can use to take strategic and tactical decisions.
This Best Practice includes
1 Zip file with 1 Power BI file and 2 Excel Files (Sample and empty template)
