
Originally published: 31/01/2025 08:36
Publication number: ELQ-79106-1
View all versions & Certificate
Publication number: ELQ-79106-1
View all versions & Certificate

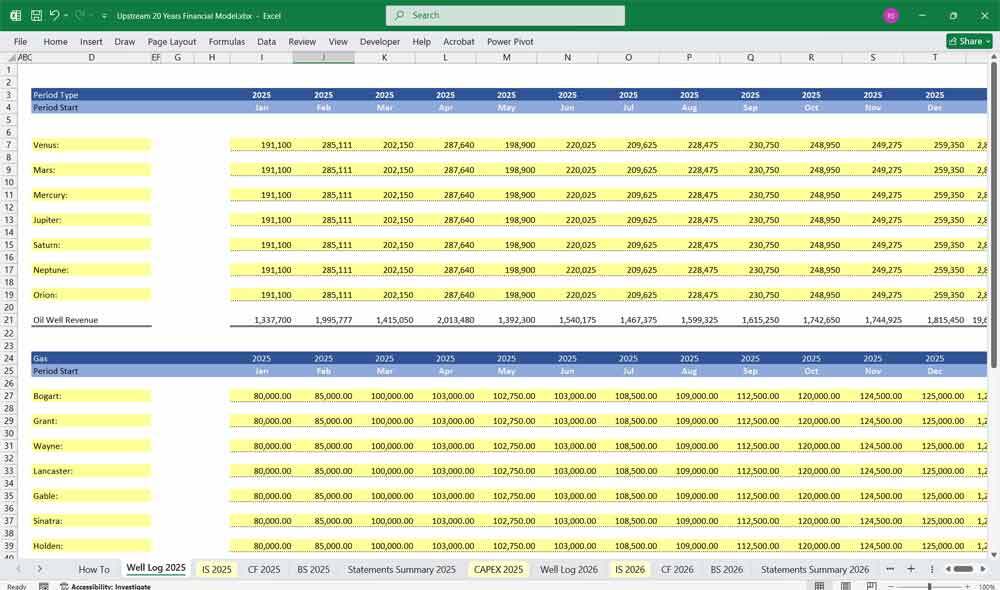
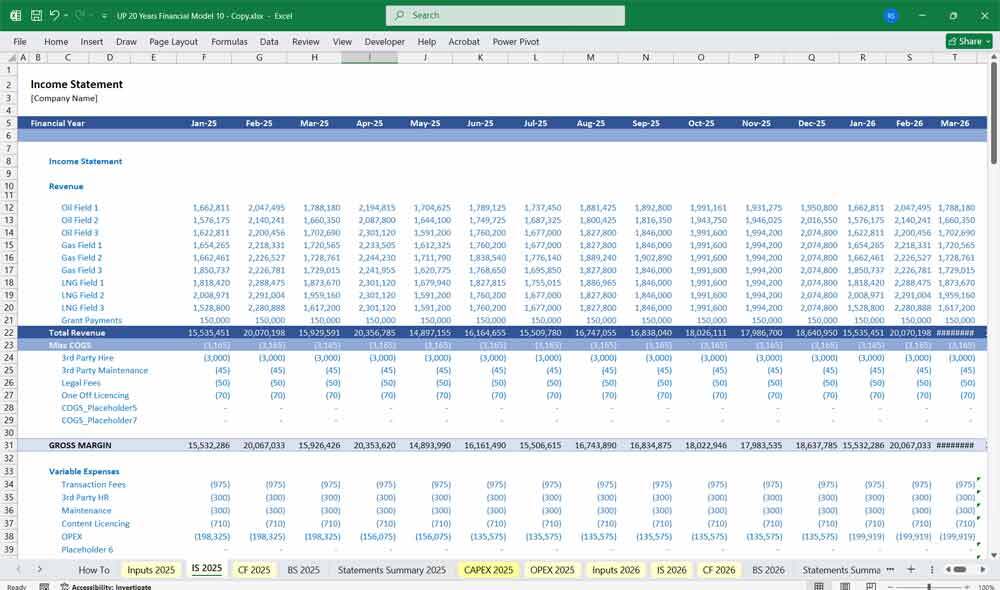
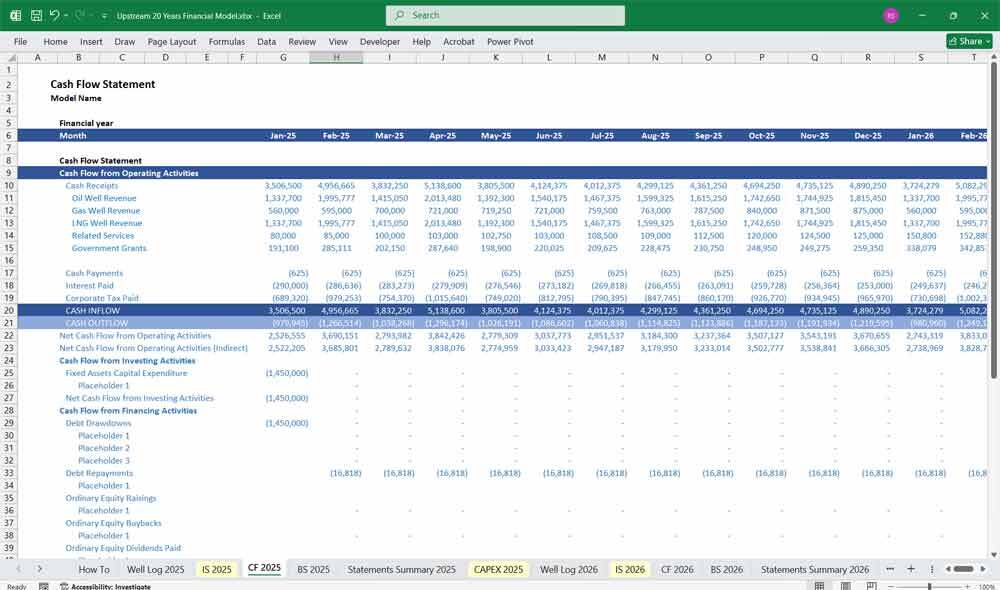
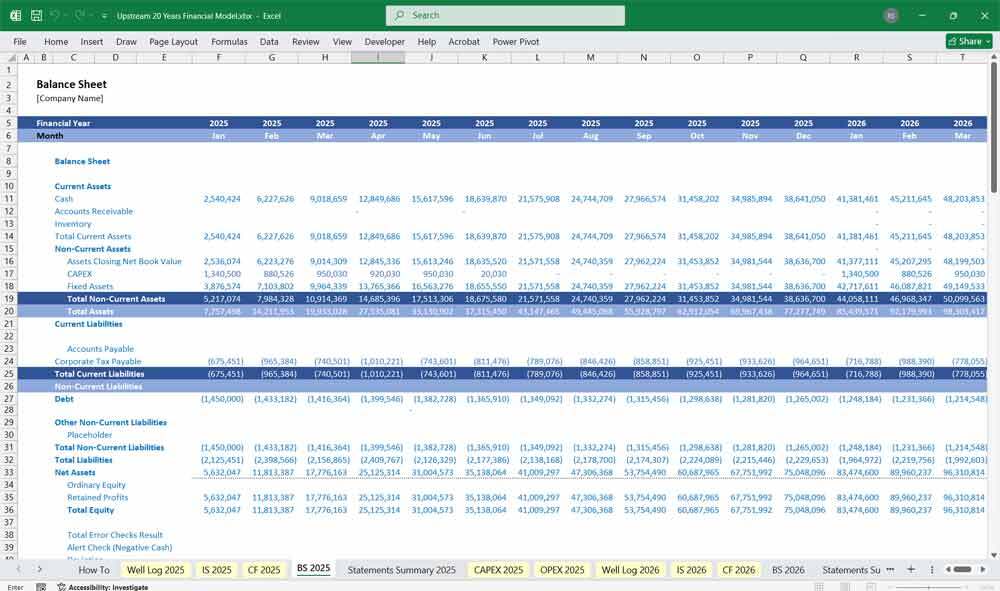
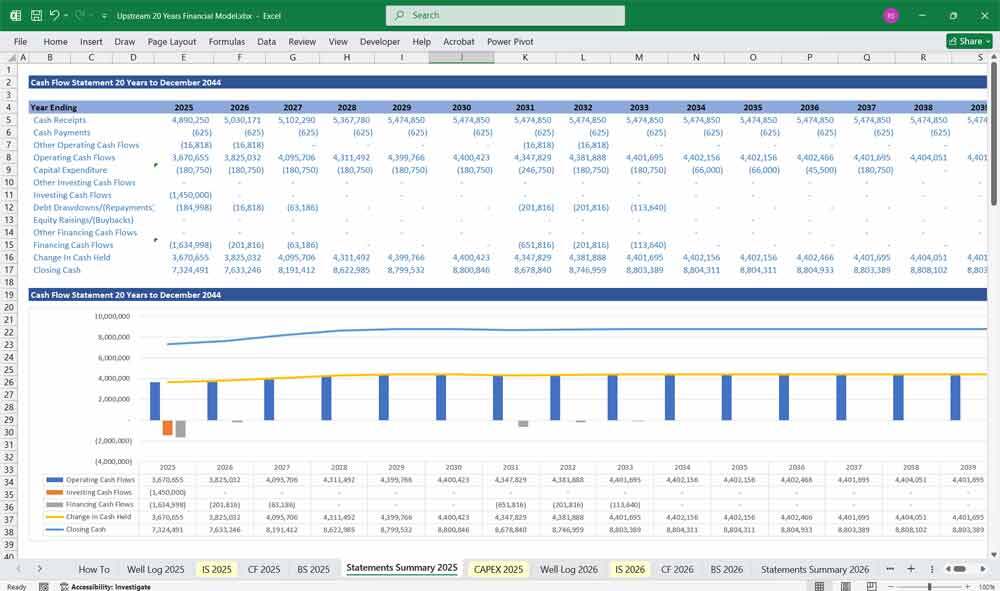
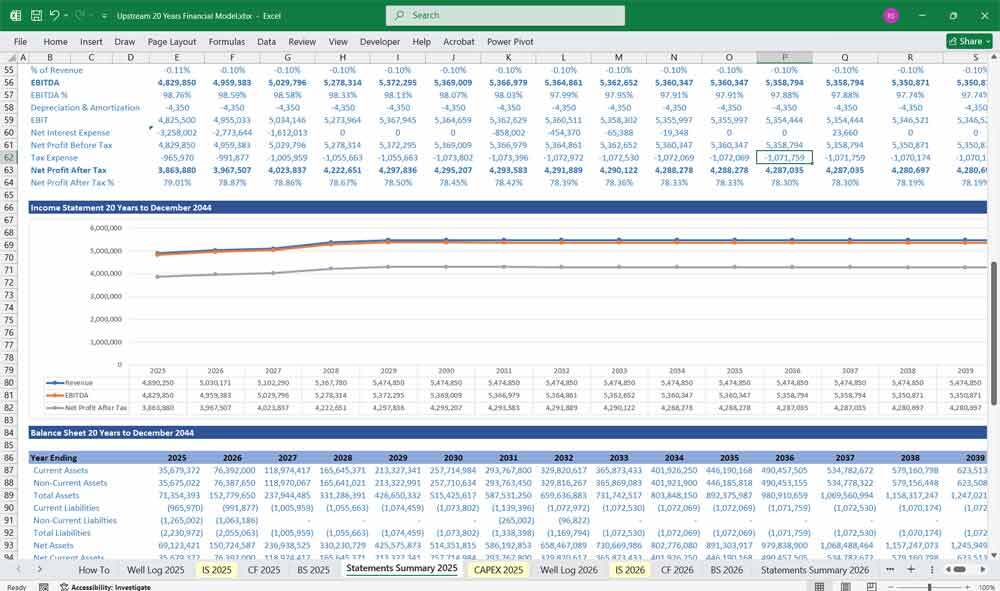
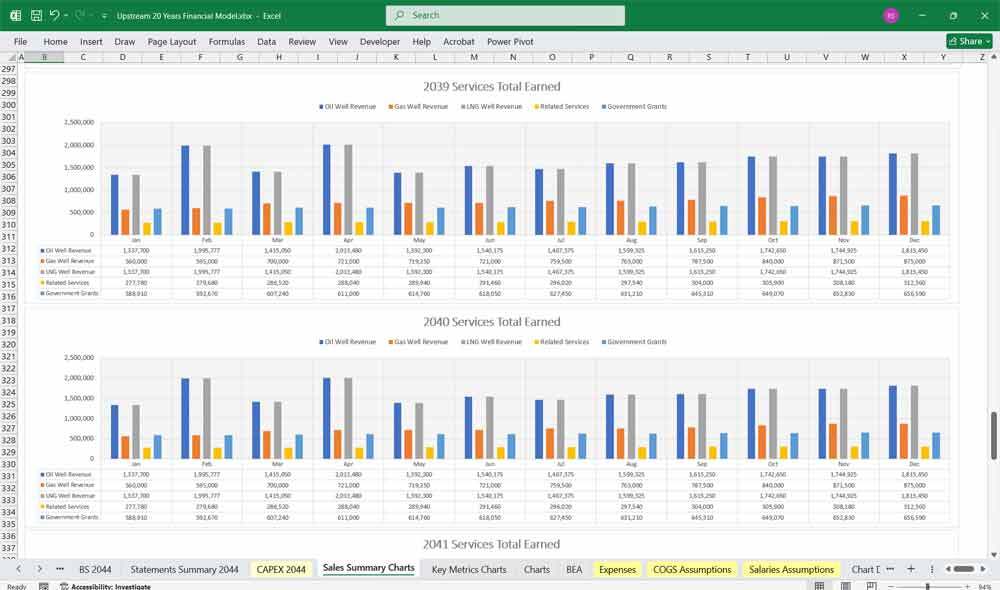
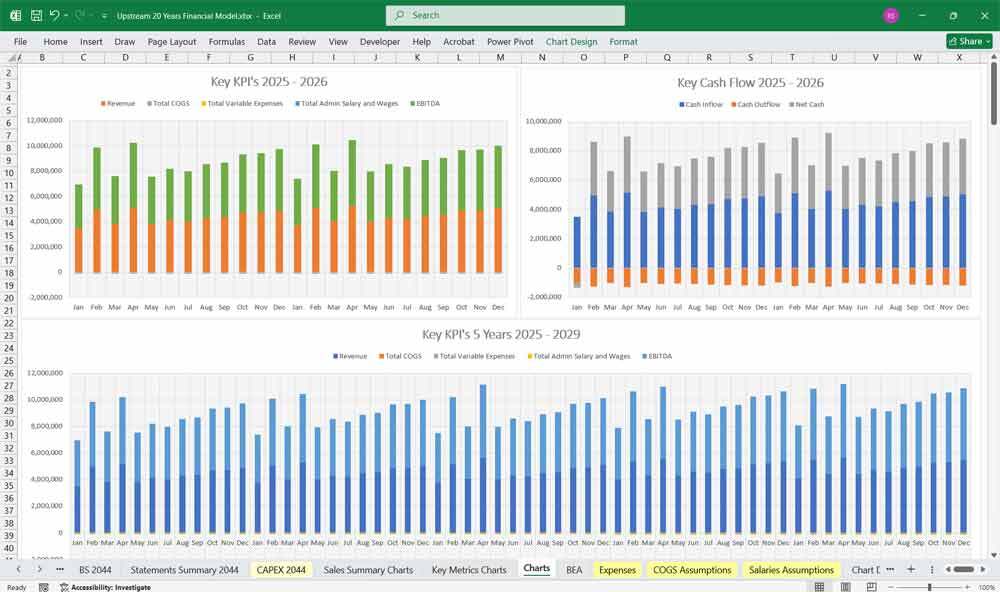
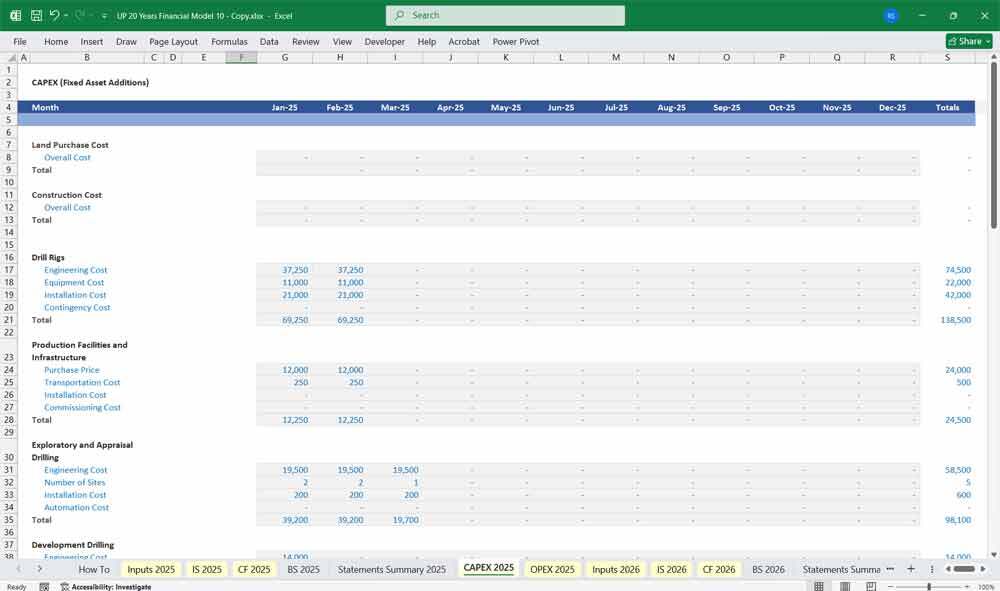
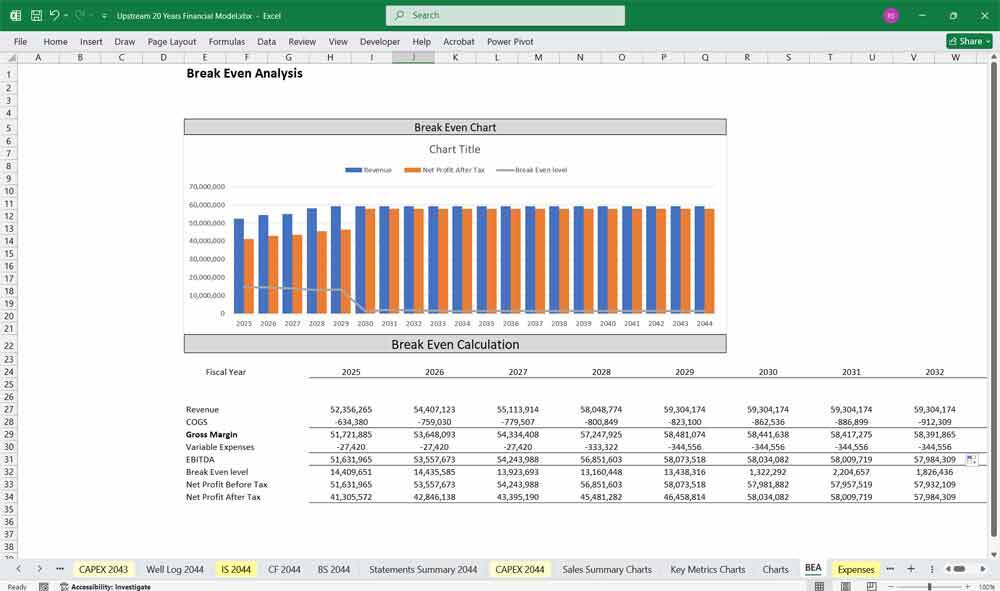
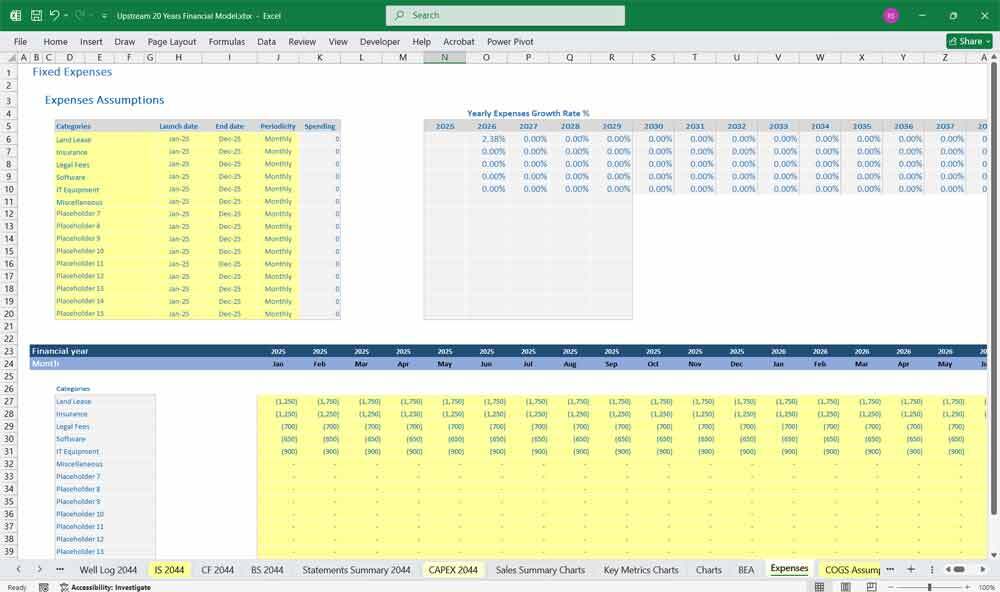
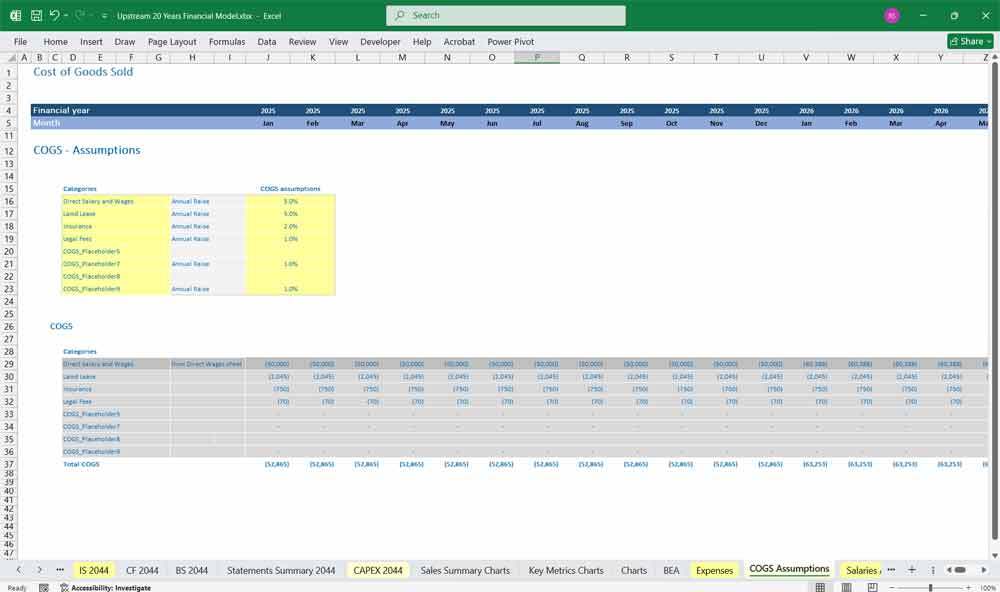
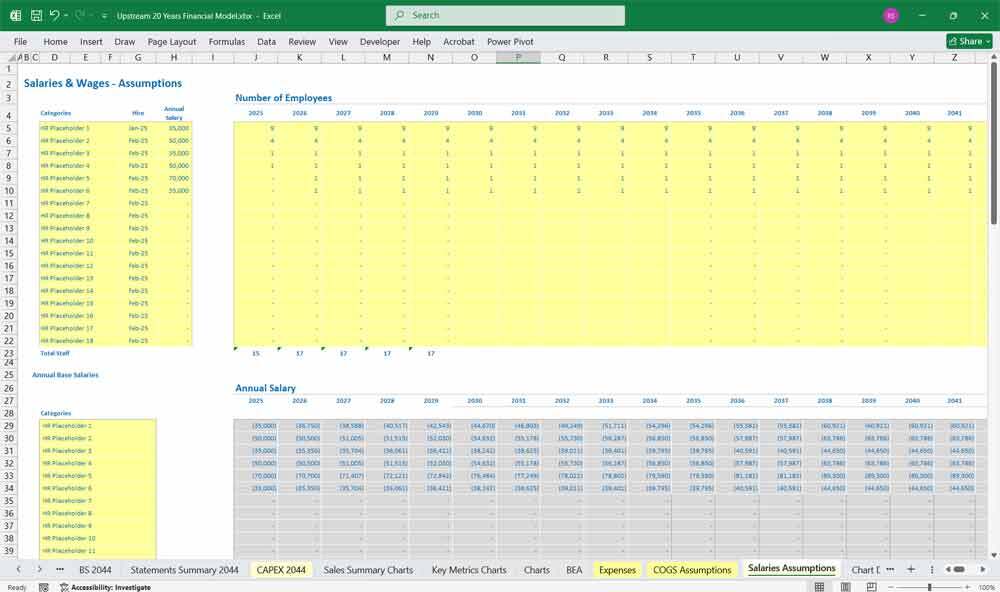
Upstream Oil & Gas Company Financial Model
A 20-year 3-statement comprehensive editable, MS Excel spreadsheet for tracking an Upstream Oil and Gas Company's finances

At Wilcox PMO we also provide CFO Services, planning and analysis to help companies in interpreting financial statements.Follow
Description
This 20-Year 3-Statement Financial Model for an Upstream Oil & Gas Company consists of a fully integrated Income Statement, Cash Flow Statement, and Balance Sheet, driven by key operational and financial assumptions. Given the industry-specific nuances, the model must account for revenue from multiple hydrocarbons (Oil, Gas, and LNG), capital-intensive operations, depletion of reserves, and fluctuations in commodity prices.
1. Income StatementThe Income Statement reflects revenues, expenses, and profitability. It typically includes:
Revenue Section
Operating Cash Flow (OCF)
AssetsCurrent Assets
This 20-Year 3-Statement Upstream Oil and Gas Refinery Financial Model delivers a granular view of performance, enabling data-driven decision-making and strategic planning in a complex and volatile industry.
This 20-Year 3-Statement Financial Model for an Upstream Oil & Gas Company consists of a fully integrated Income Statement, Cash Flow Statement, and Balance Sheet, driven by key operational and financial assumptions. Given the industry-specific nuances, the model must account for revenue from multiple hydrocarbons (Oil, Gas, and LNG), capital-intensive operations, depletion of reserves, and fluctuations in commodity prices.
1. Income StatementThe Income Statement reflects revenues, expenses, and profitability. It typically includes:
Revenue Section
- Oil Revenue = (Oil Production Volume * Oil Price Realization)
- Gas Revenue = (Gas Production Volume * Gas Price Realization)
- LNG Revenue = (LNG Export Volume * LNG Price Realization)
- Total Revenue = Sum of all hydrocarbon revenues
Key Drivers:- Production forecasts (barrels of oil equivalent per day - BOE/d)
- Price decks for oil (Brent/WTI), gas (Henry Hub), and LNG (JKM/TTF)
- Revenue recognition policies (spot vs. long-term contracts)
- Lease Operating Expenses (LOE) – Cost of maintaining production (lifting costs)
- Transportation & Processing Costs – Pipeline tariffs, LNG liquefaction fees
- Production Taxes – Severance, ad valorem, and royalties
- General & Administrative (G&A) Expenses – HQ and corporate overhead
- Depletion, Depreciation & Amortization (DD&A) – Based on reserves and CAPEX
- EBITDA = Revenue - OPEX - G&A
- Operating Profit (EBIT) = EBITDA - DD&A
- Net Interest Expense = Interest on debt financing
- Taxes – Effective tax rate applied to pre-tax profit
- Net Income = EBIT - Interest - Taxes
Operating Cash Flow (OCF)
- Net Income (from Income Statement)
- Adjustments for Non-Cash Items:
- Add back DD&A (non-cash)
- Add back non-cash interest or stock-based compensation
- Changes in Working Capital:
- Accounts Receivable
- Accounts Payable
- Inventory Changes
- Capital Expenditures (CAPEX)
- Exploration & Development Drilling
- Facility Construction (Processing Plants, LNG Terminals)
- Acquisition of Reserves (Asset Purchases)
- Asset Sales (if applicable)
- Investment in JV or Partnerships
- Debt Issuance & Repayments (for funding projects)
- Equity Issuance (if raising capital)
- Dividend Payments & Share Buybacks
- Unlevered Free Cash Flow (UFCF) = OCF - CAPEX
- Levered Free Cash Flow (LFCF) = UFCF - Interest Payments
AssetsCurrent Assets
- Cash & Cash Equivalents – Cash on hand
- Accounts Receivable – Sales proceeds yet to be received
- Inventory – Stored hydrocarbons
- Property, Plant & Equipment (PP&E)
- Oil & Gas Reserves (Proved Developed Producing - PDP, Proved Undeveloped - PUD)
- Pipelines, Gathering Systems, Processing Plants
- LNG Terminals
- Exploration & Evaluation Assets – Pending reserves evaluation
- Accounts Payable – Vendor payments due
- Short-term Debt – Maturing loans
- Long-term Debt – Bank loans, bonds
- Deferred Taxes – Tax liabilities from asset valuations
- Decommissioning Liabilities – Future abandonment costs
- Shareholder Equity – Paid-in capital, retained earnings
- Retained Earnings – Cumulative net income reinvested
- Net Income → Flows into Retained Earnings (Balance Sheet)
- DD&A → Added back in Operating Cash Flow
- CAPEX → Reduces Cash and Increases PP&E
- Debt & Equity Transactions → Impact Liabilities & Equity
This 20-Year 3-Statement Upstream Oil and Gas Refinery Financial Model delivers a granular view of performance, enabling data-driven decision-making and strategic planning in a complex and volatile industry.
This Best Practice includes
1 Excel Financial Model
Further information
Provides thorough oversight, tracking, and reporting of an Upstream Oil and Gas Company's finances, including updates on budget utilisation and projections.