Originally published: 22/12/2019 08:42
Publication number: ELQ-10261-1
View all versions & Certificate
Publication number: ELQ-10261-1
View all versions & Certificate

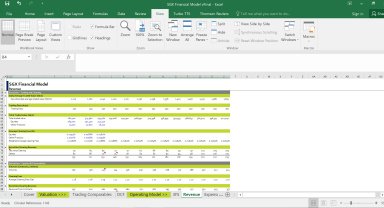
SGX Exchange Stock Model (Similar to NASDAQ)
A SGX Stock Exchange Financial Model in Microsoft Excel for you to explore & download.
sgxstock exchangenasdaqhong kong exchangeasx ltdcme groupintercontinential exchangelisted exchange companiesnasdaq financial modelexchange financial model
Description
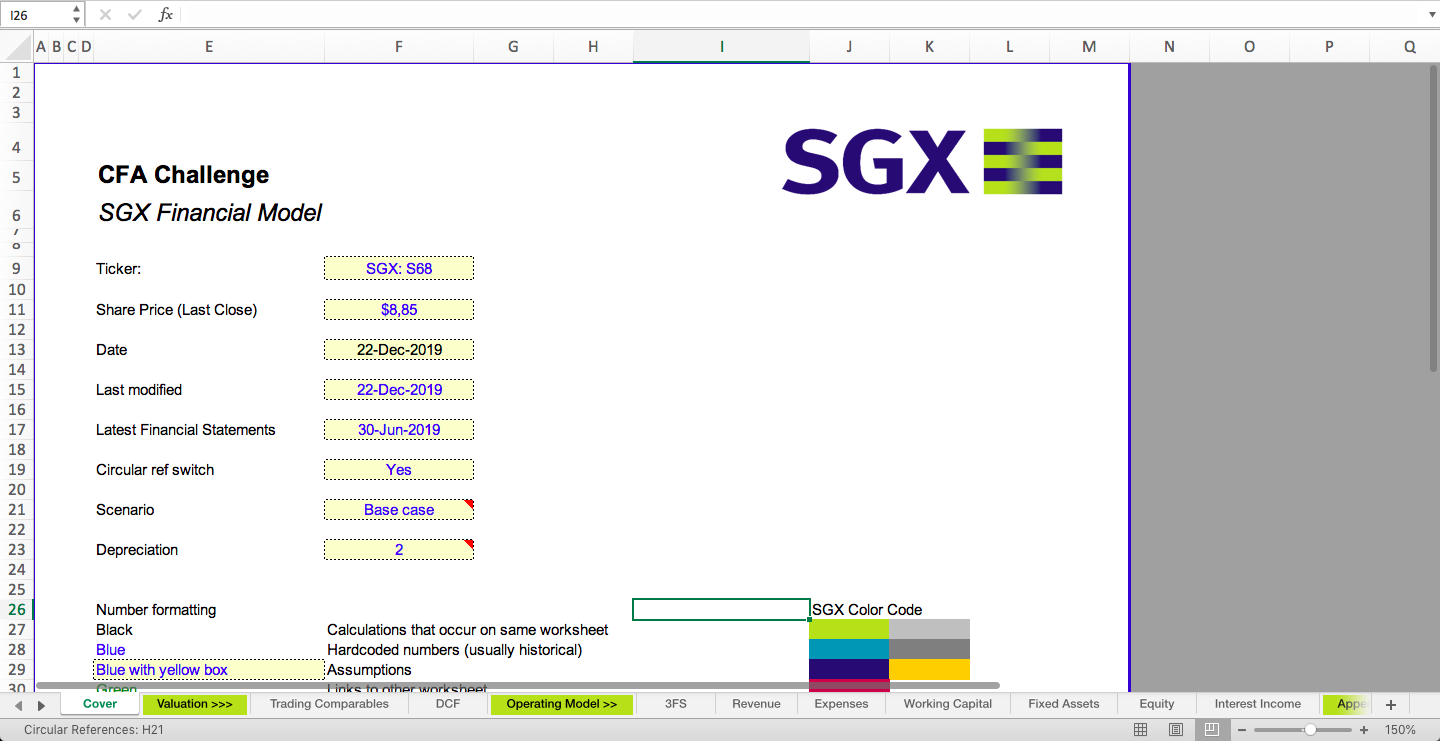
I'm currently an investment banker in an MM Firm. This was done as part of own my equity research. Covers SDAV, DDAV, clearing fees, etc. Covers the Operating Model, Key Comparables and Multiples, DCF. Sensitivity and scenario analysis was also done for this stock.
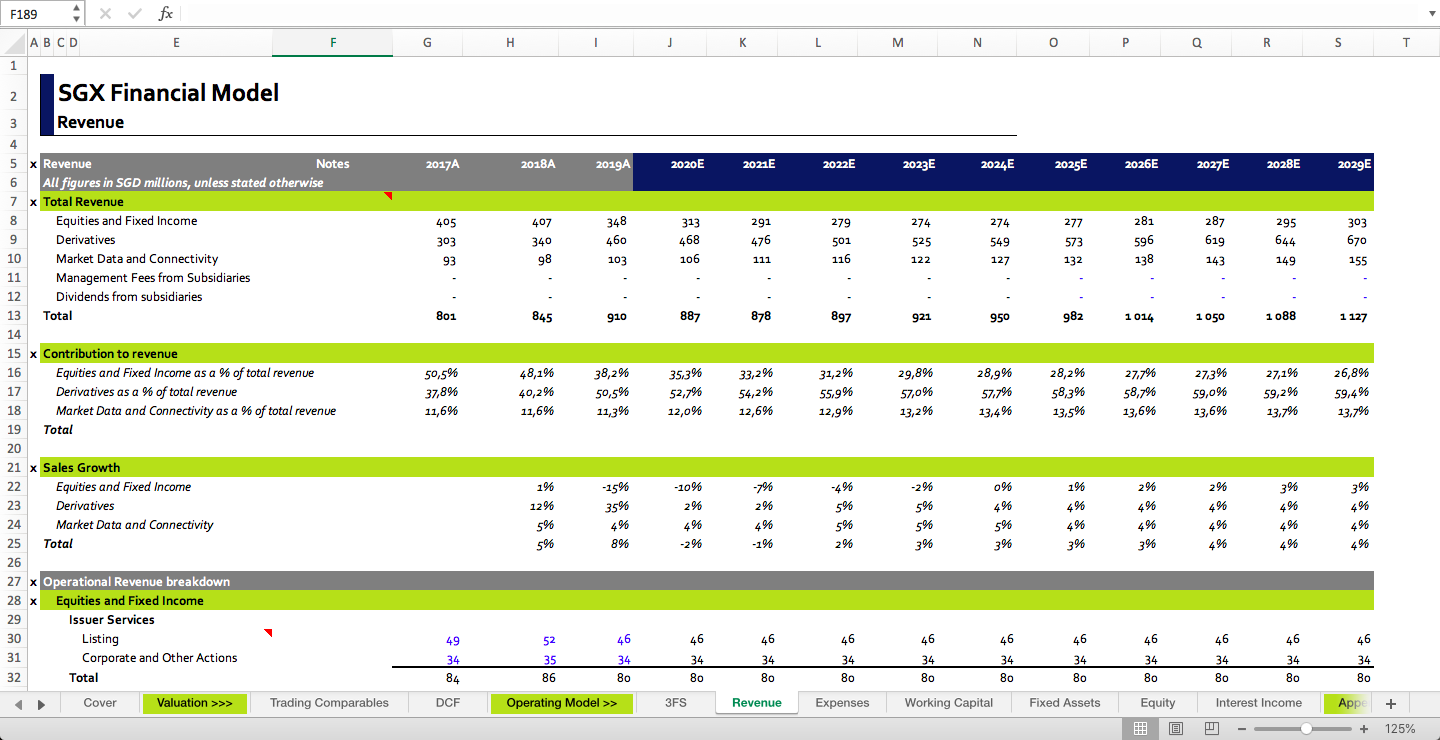
SGX is the the number 1 stock exchange in South East Asia. Singapore Exchange Limited (SGX) is the operator of equity, fixed income and derivatives markets in Singapore. The Singapore bourse currently offers listing, trading, clearing, settlement and depository and data services and domestic and foreign market participants. In FY2019, SGX reported revenues of $459.7m (51%), $347.5m (38%), and $102.5m (11%) in the Derivatives, Equities & Fixed Income, and Market Data & Connectivity business segments respectively.
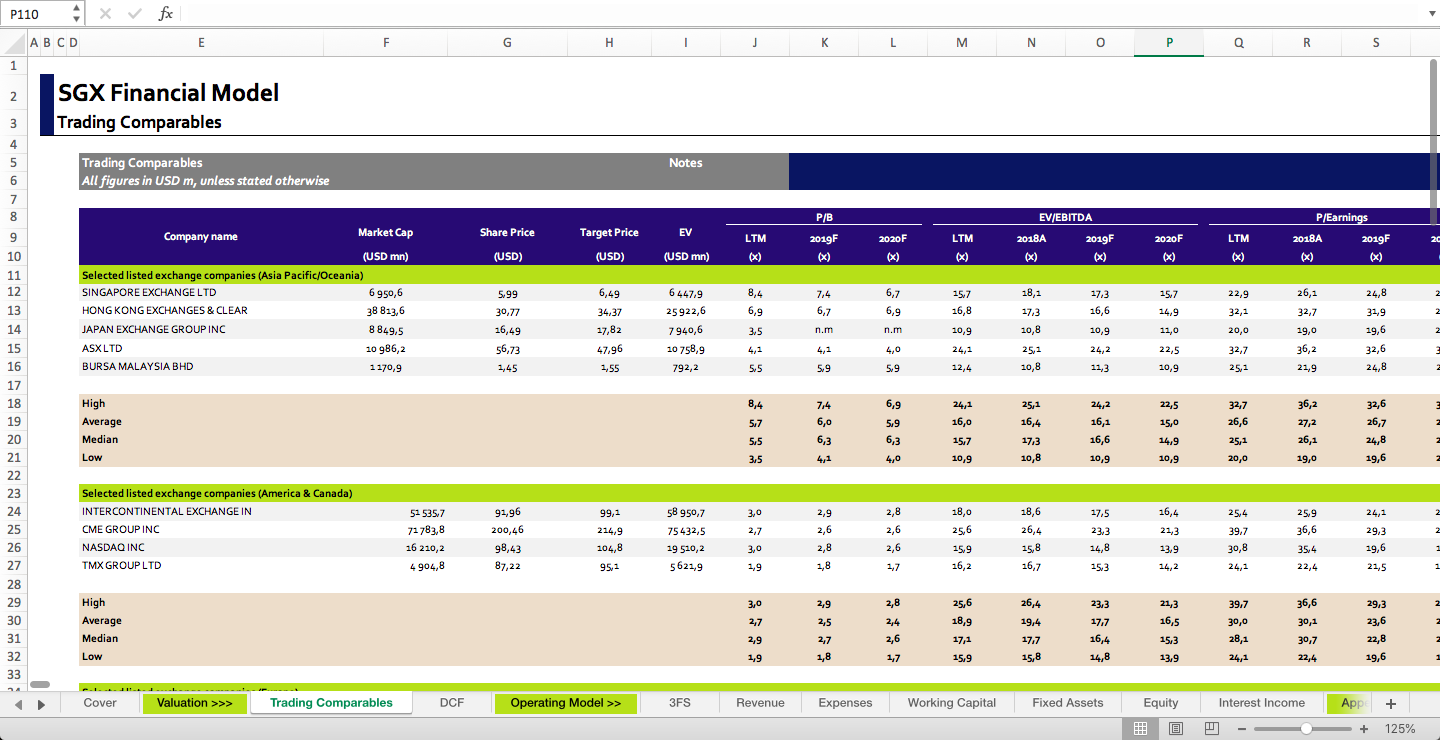
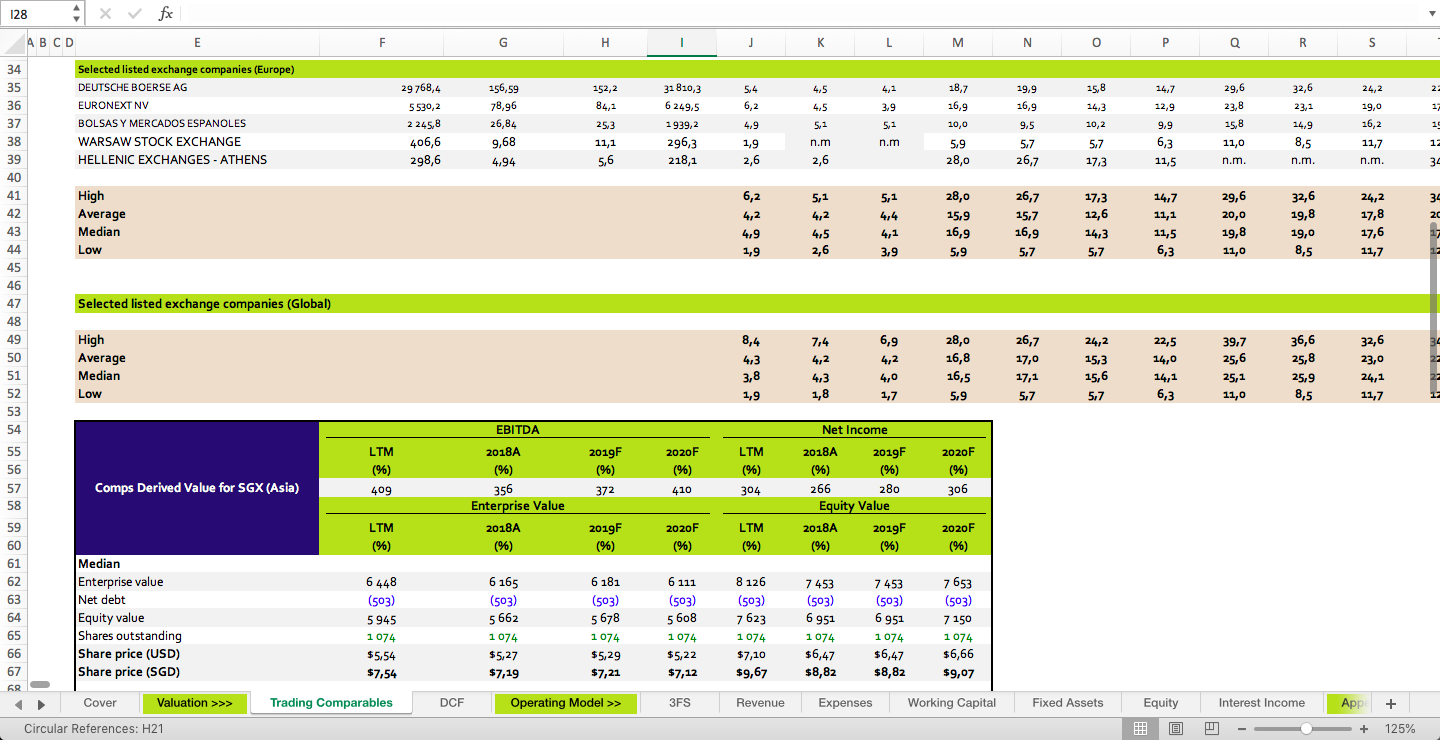
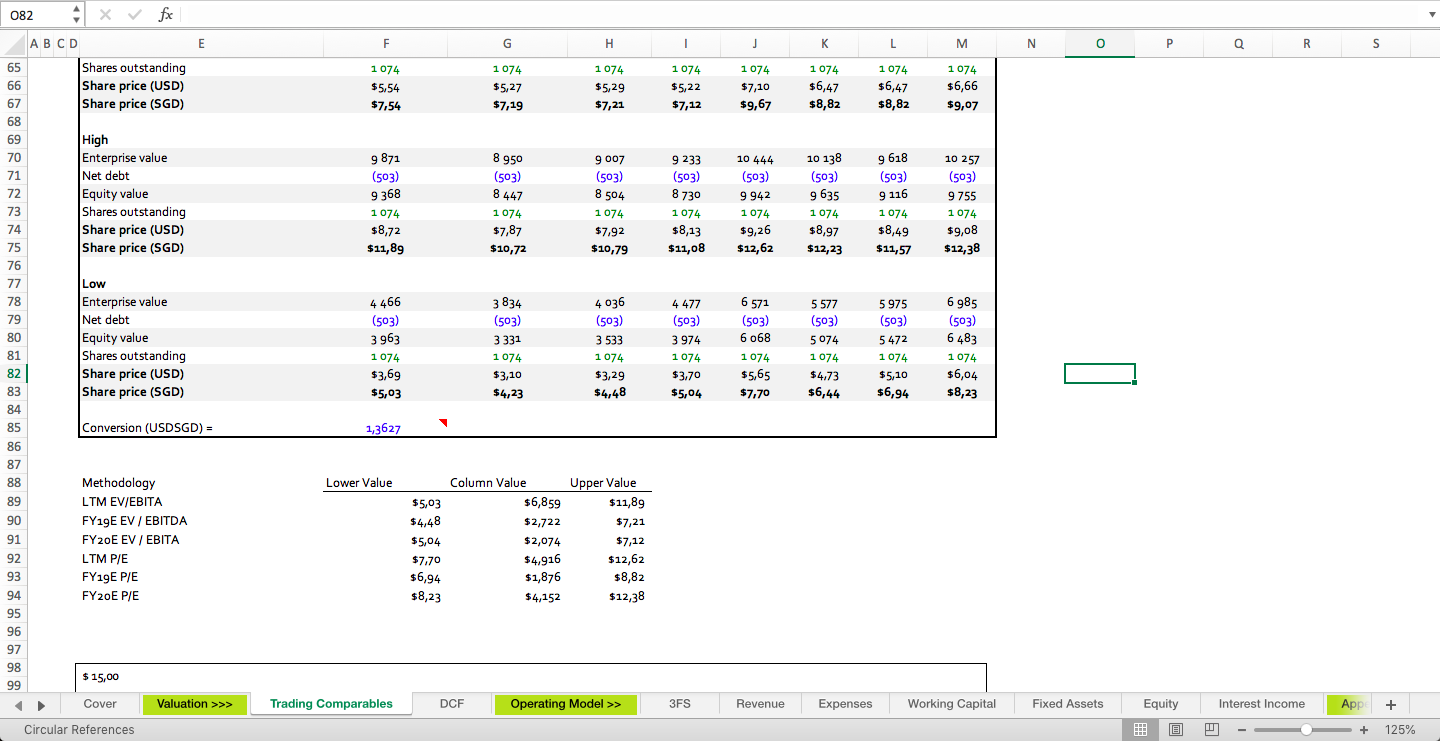
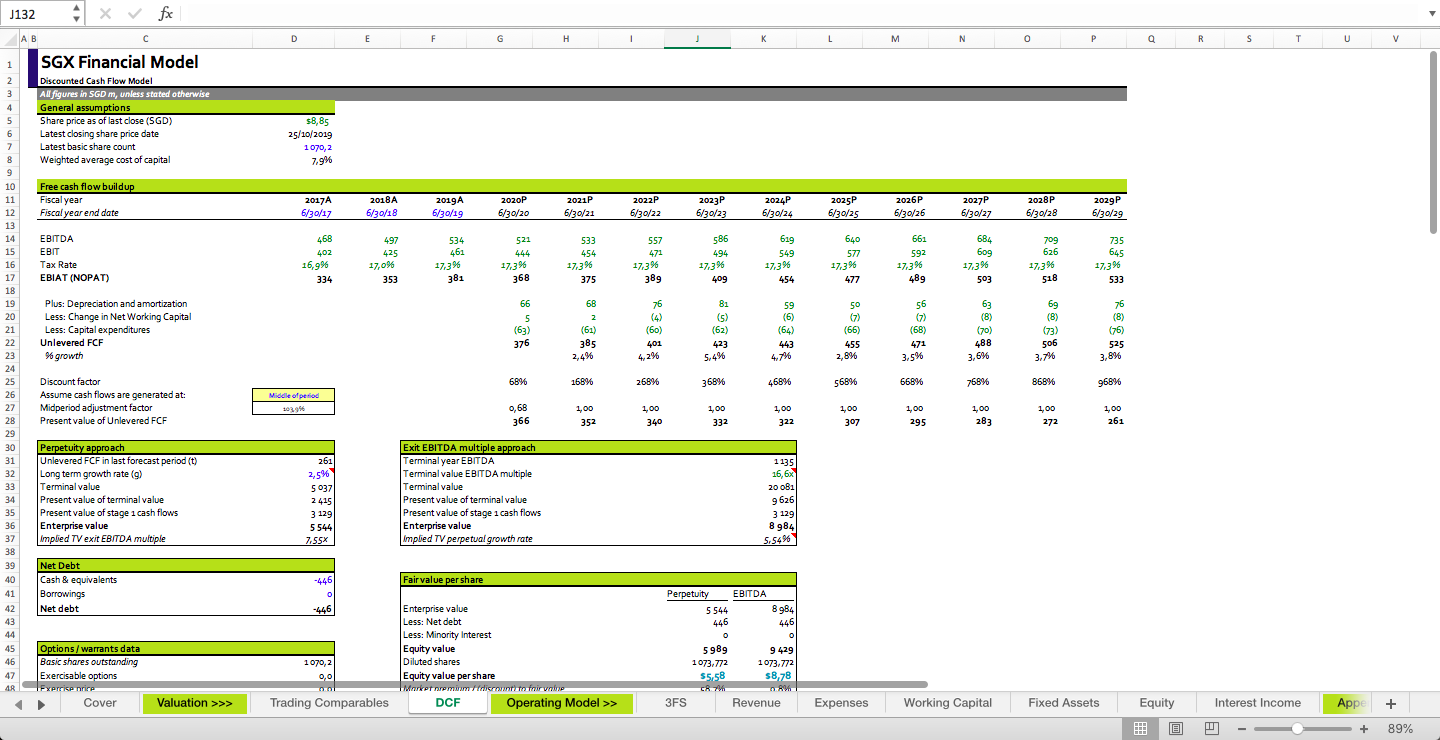
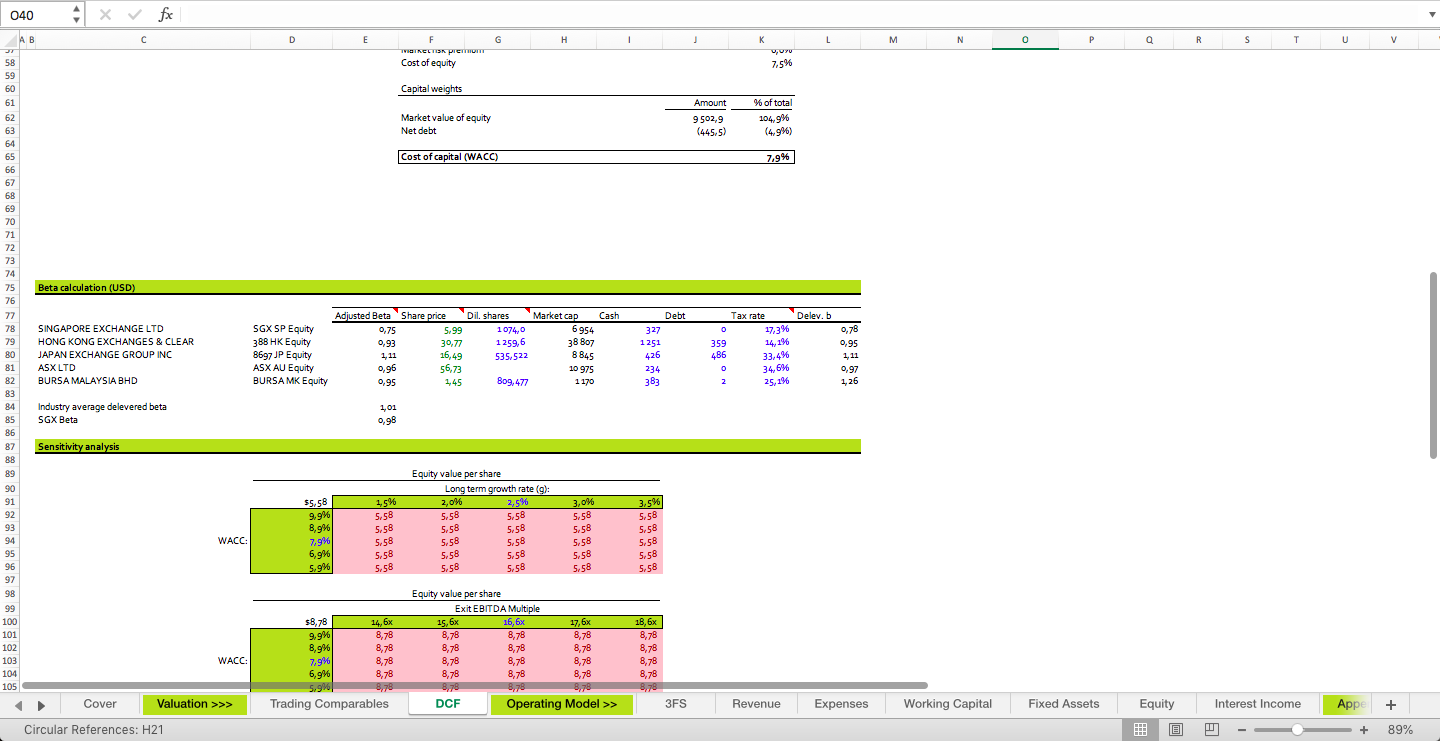
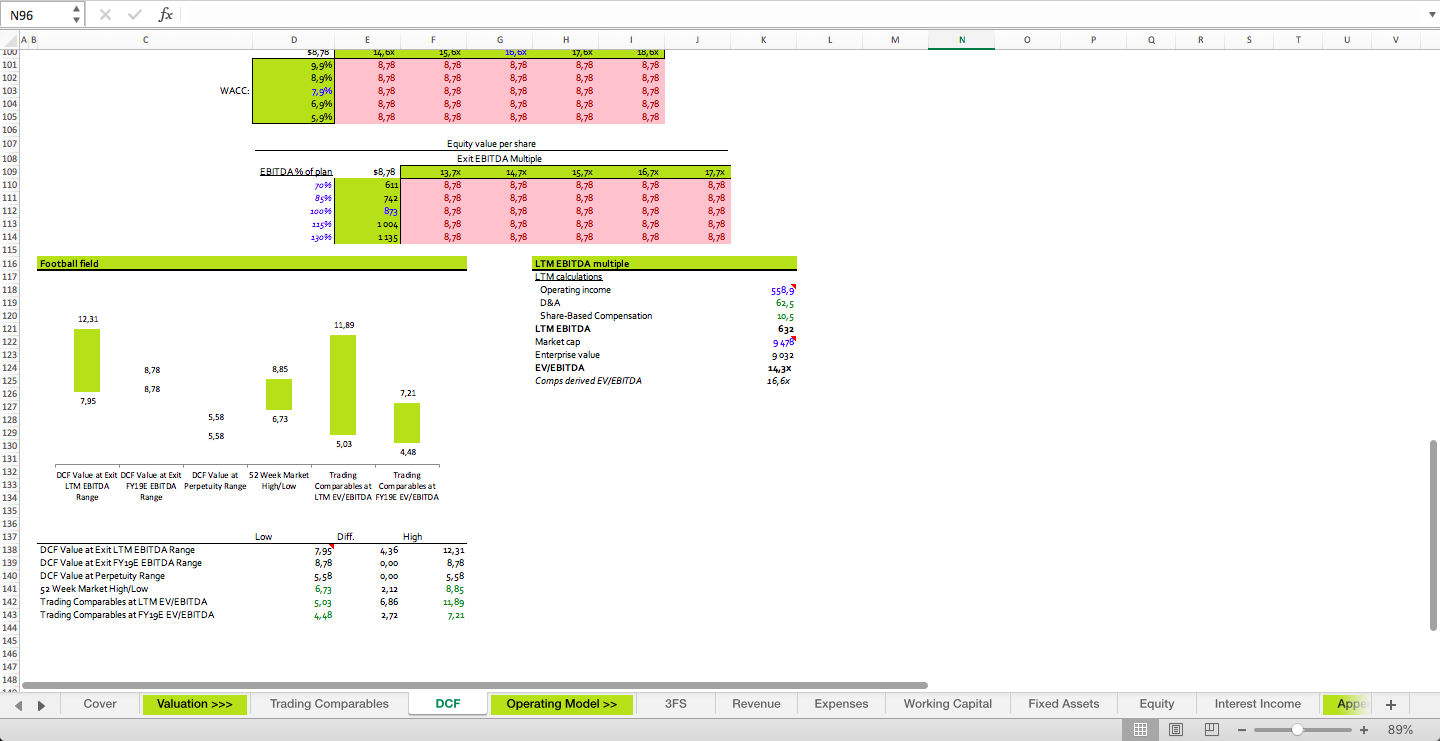
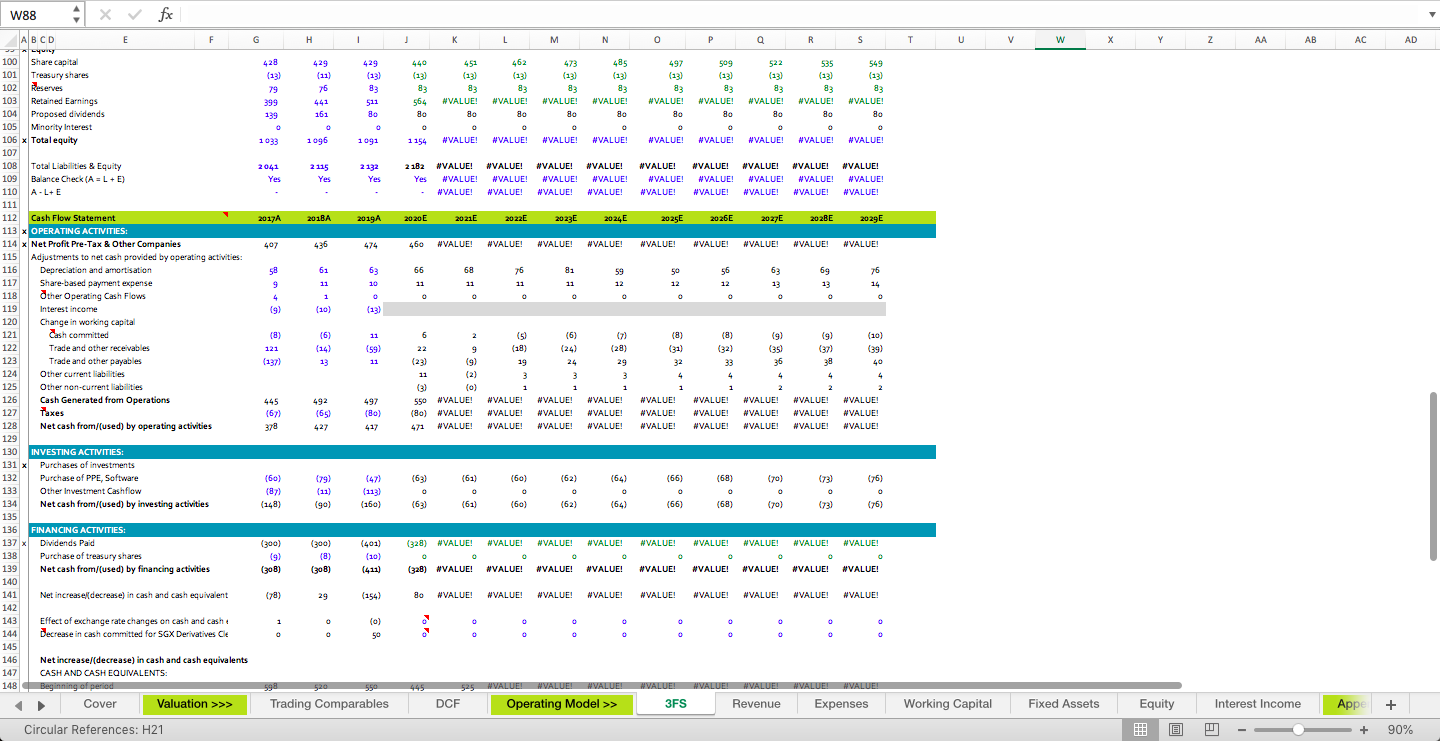
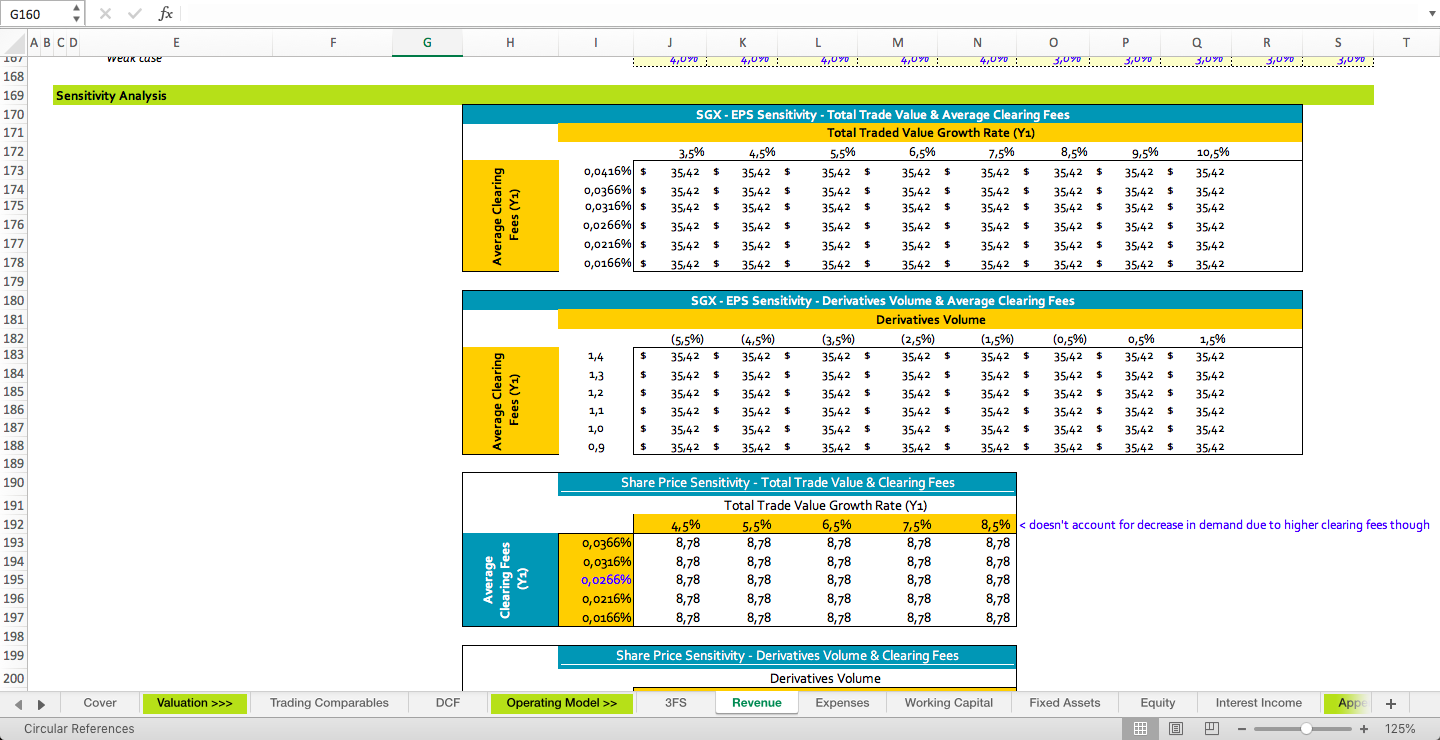
A Discounted Cash Flow (DCF) model was employed to produce a valuation for
SGX with our integrated projections. As a check on our DCF methodology, we
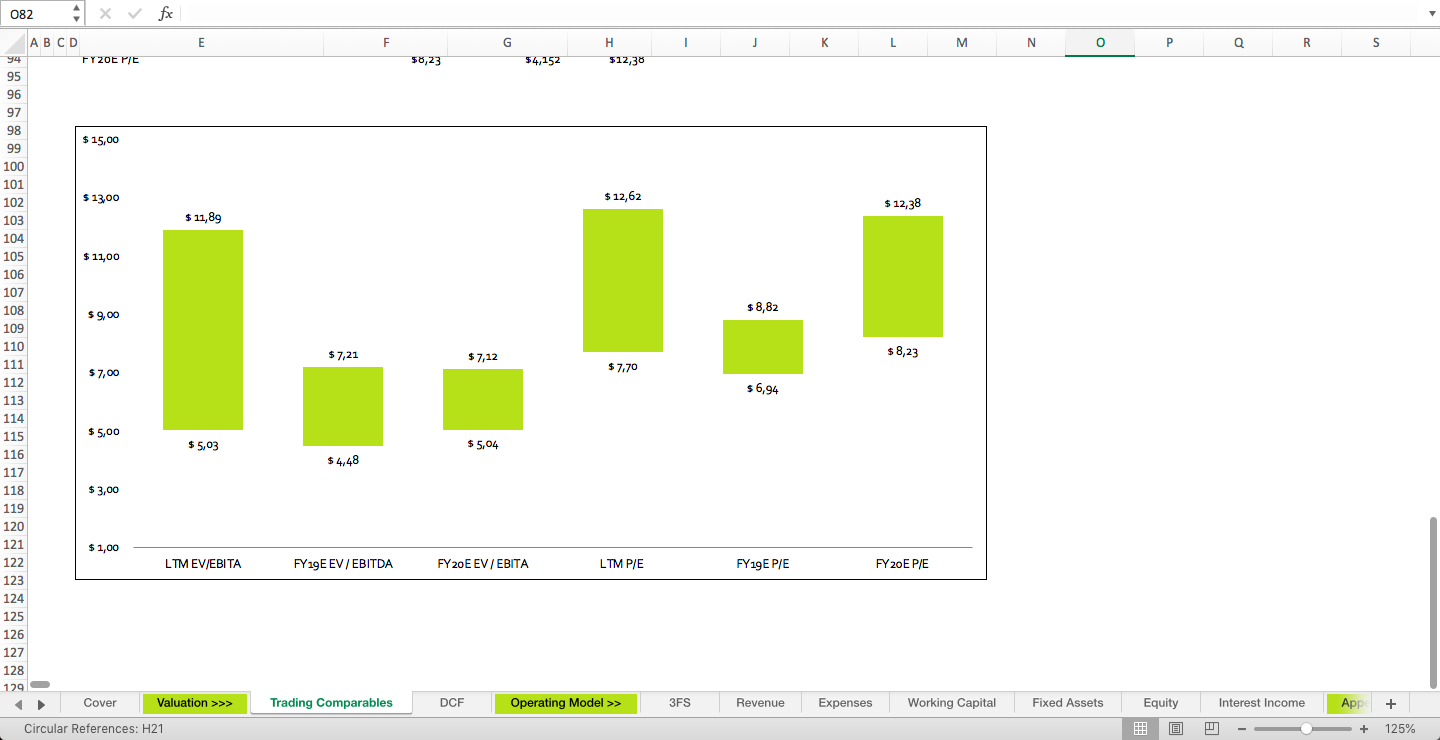
validated the target price with market multiples and conducted a sensitivity
analysis.
The Enterprise Value (EV) of SGX is determined using the Unlevered Free Cash
Flow to Firm (FCFF) method and discounting the cash flows by Weighted Average Cost of Capital (WACC). This method is suitable as it will account for the cash flow to both debt holders and equity holders
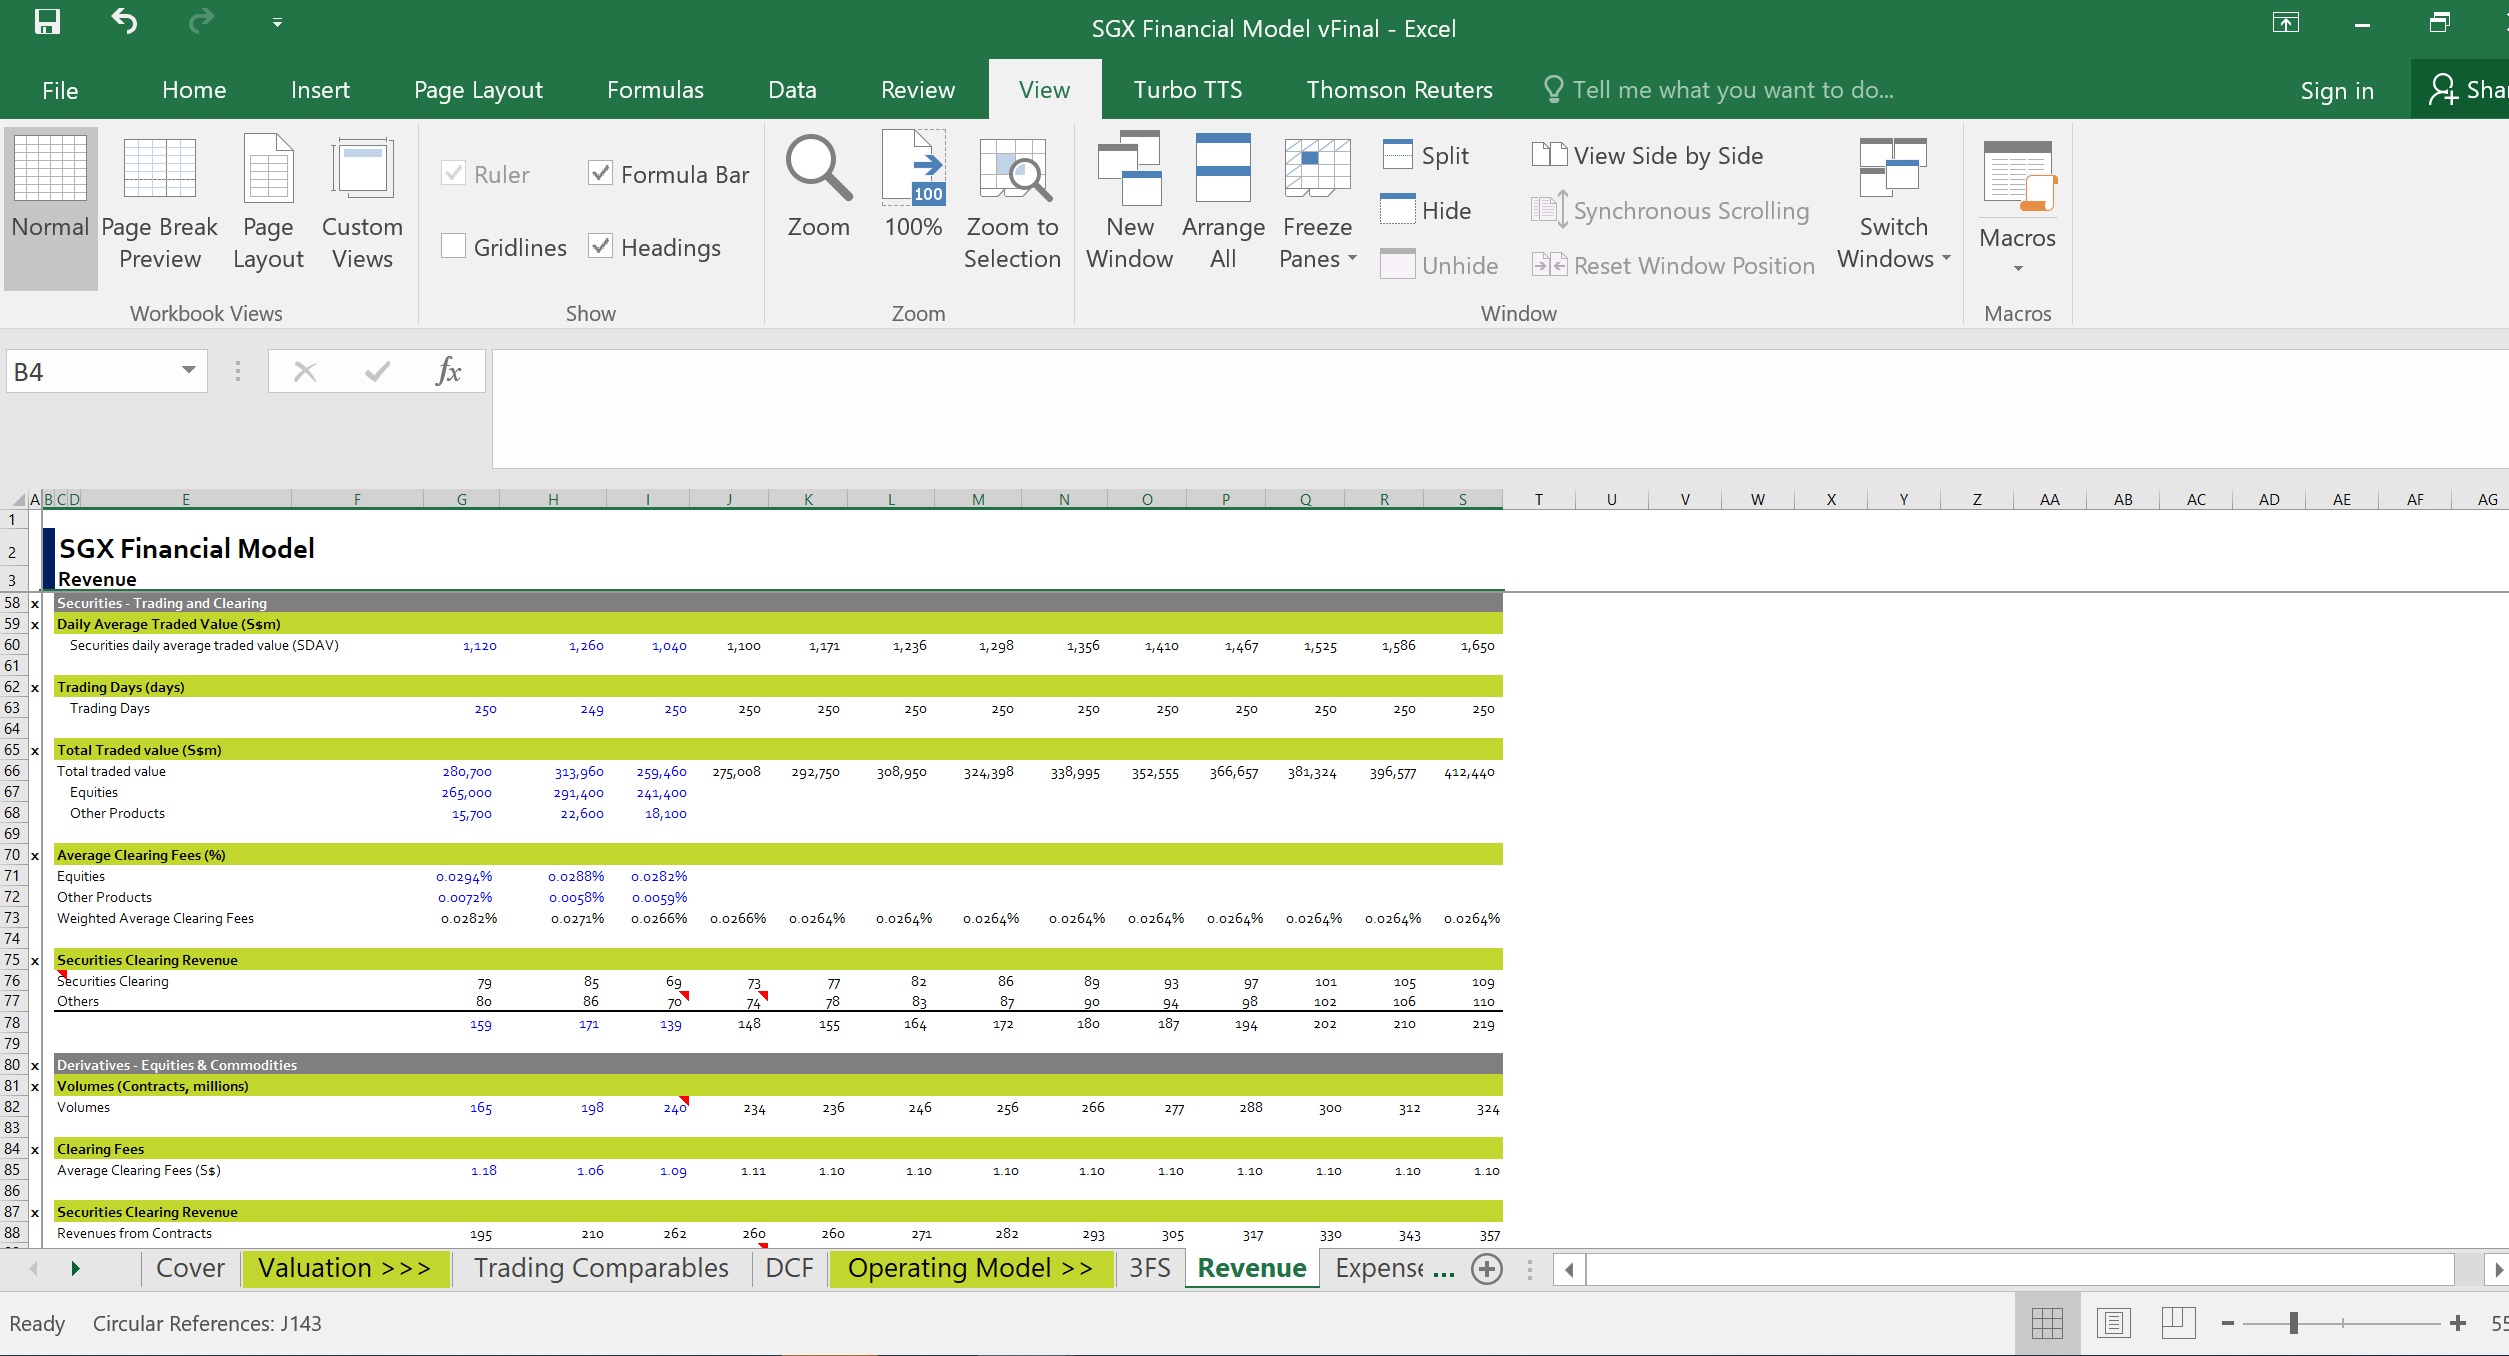
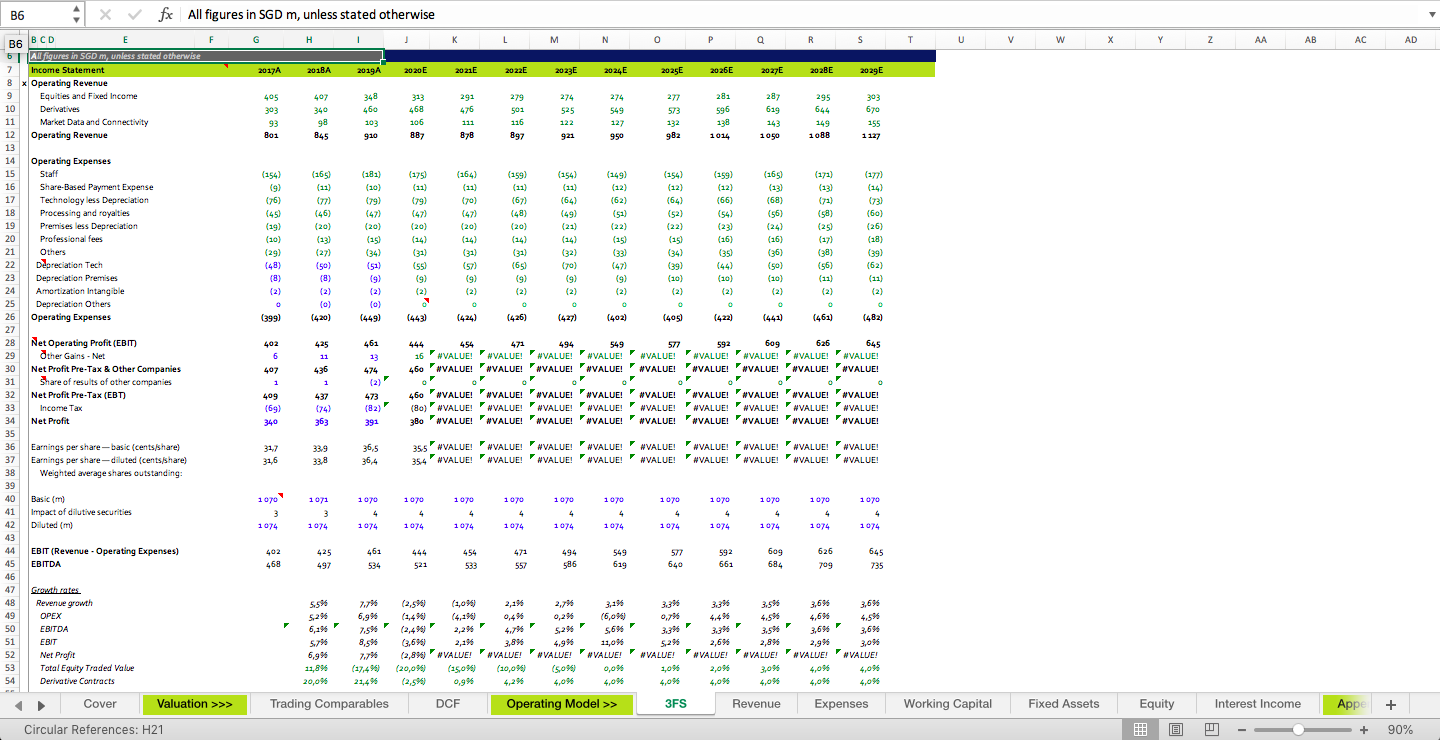
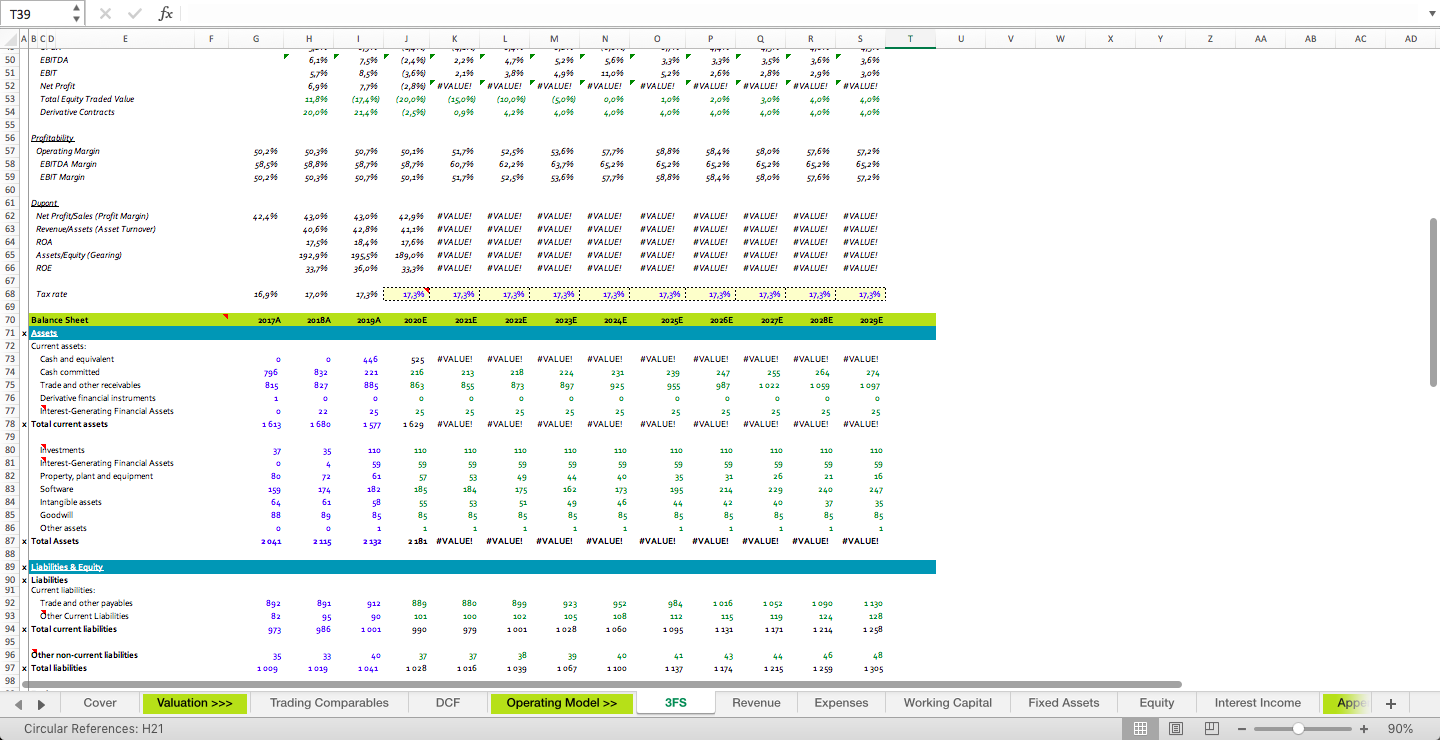
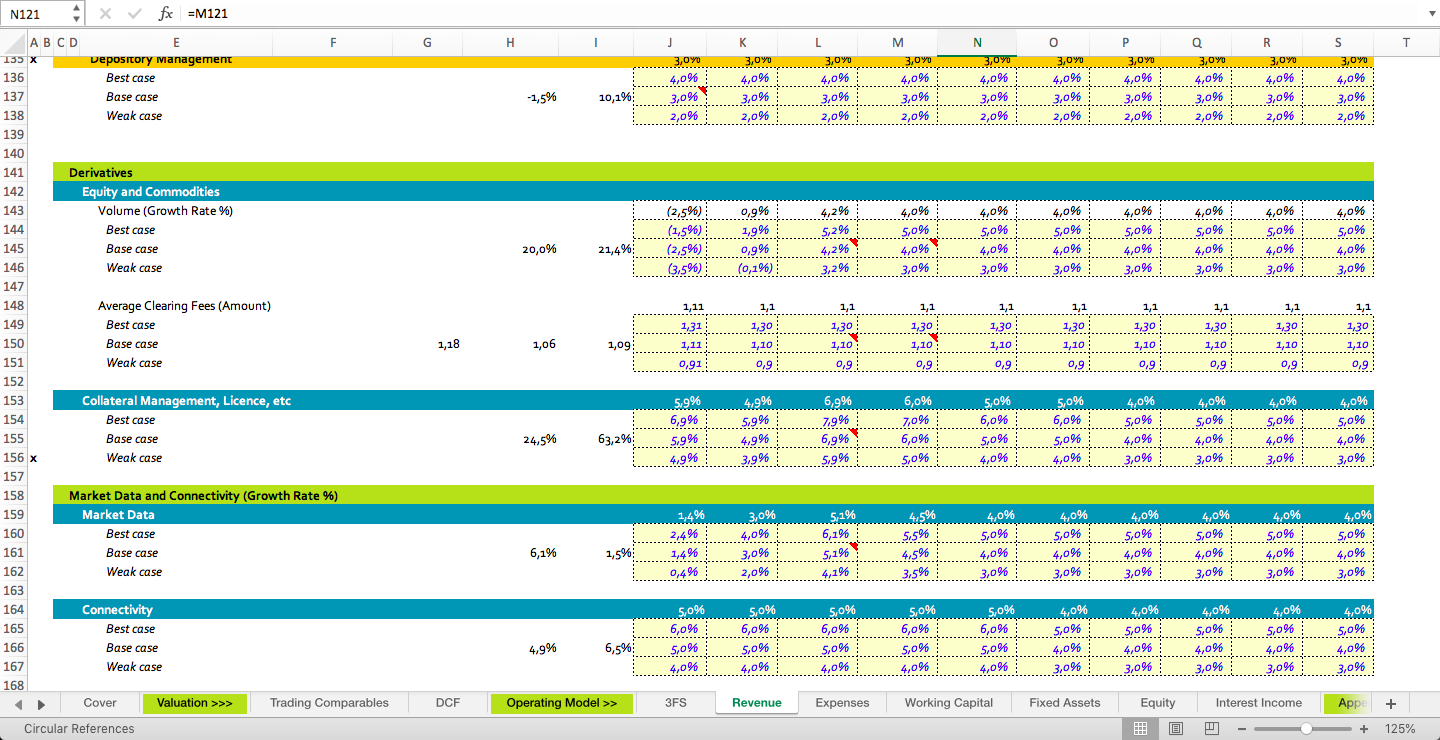
Given the nature of SGX’s product lines and their differing financial outlooks, we
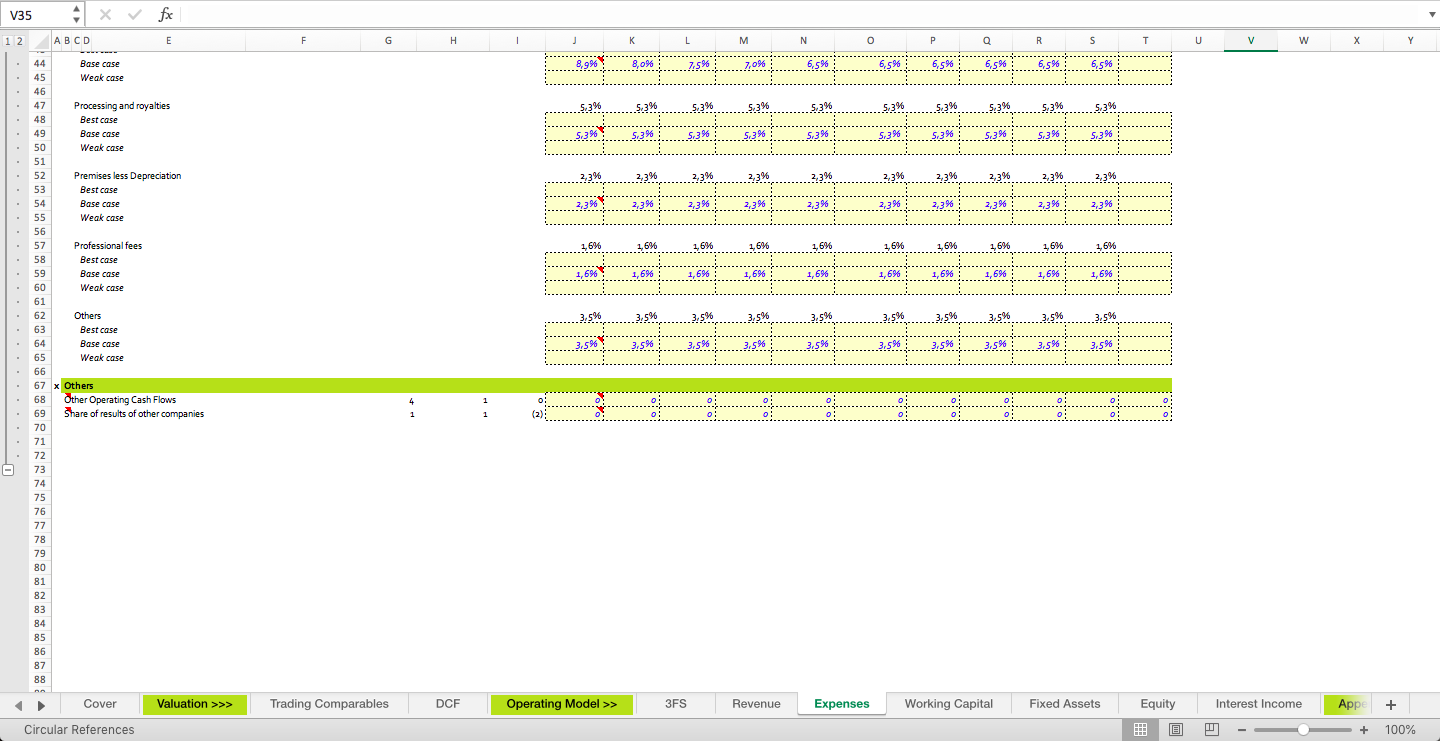
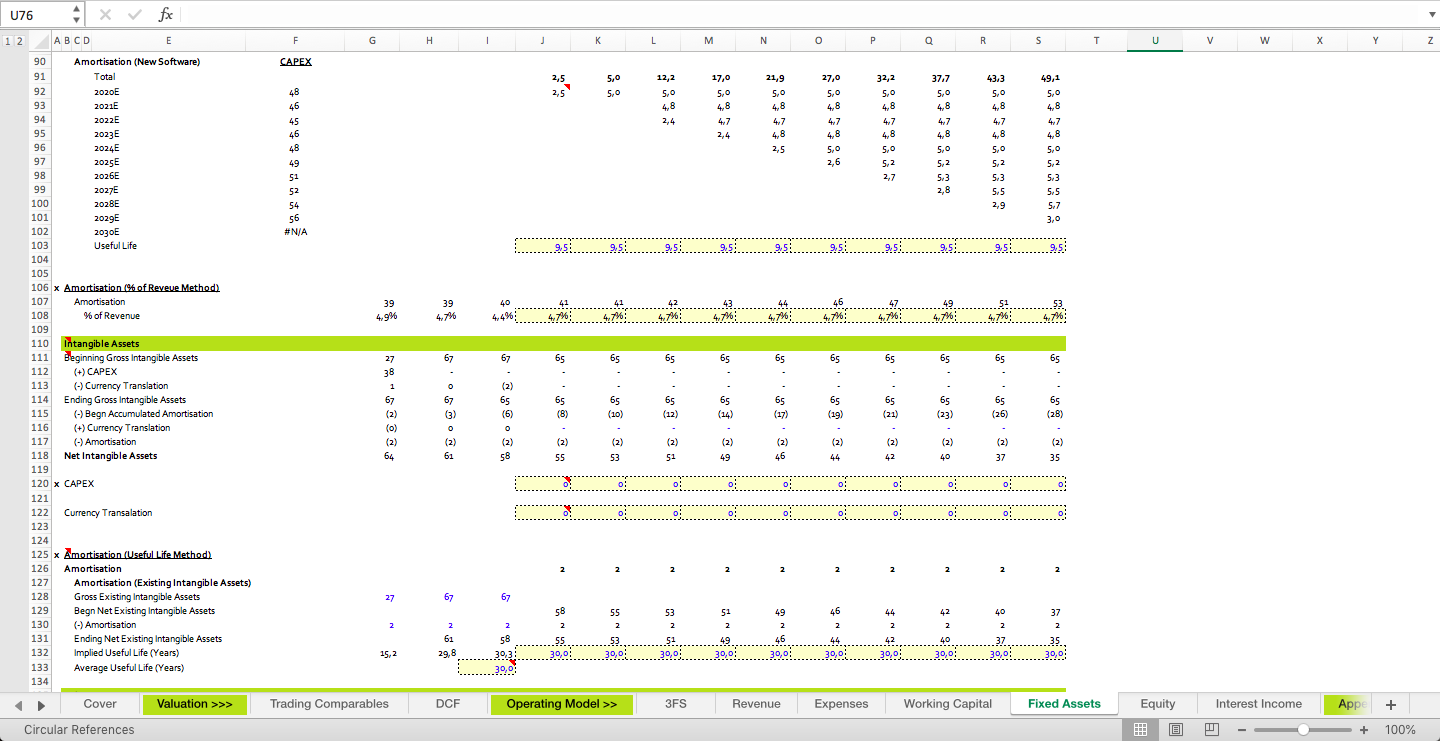
have built a sum of parts forecast model, modeling revenue obtained SGX’s three product lines separately - Equities & Fixed Income, Derivatives and Market Data & Connectivity. Because costs are largely overheads, we modeled them together, separate from the individual product lines.
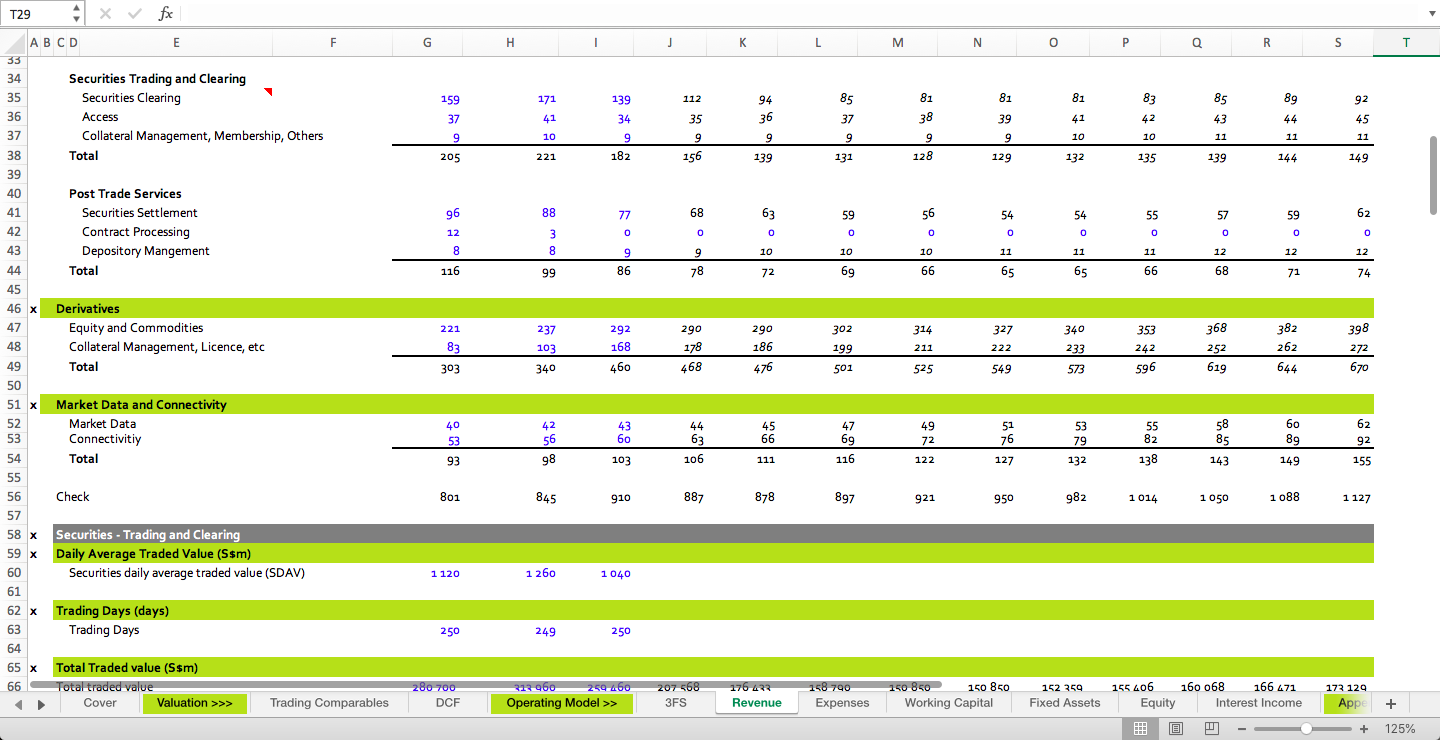
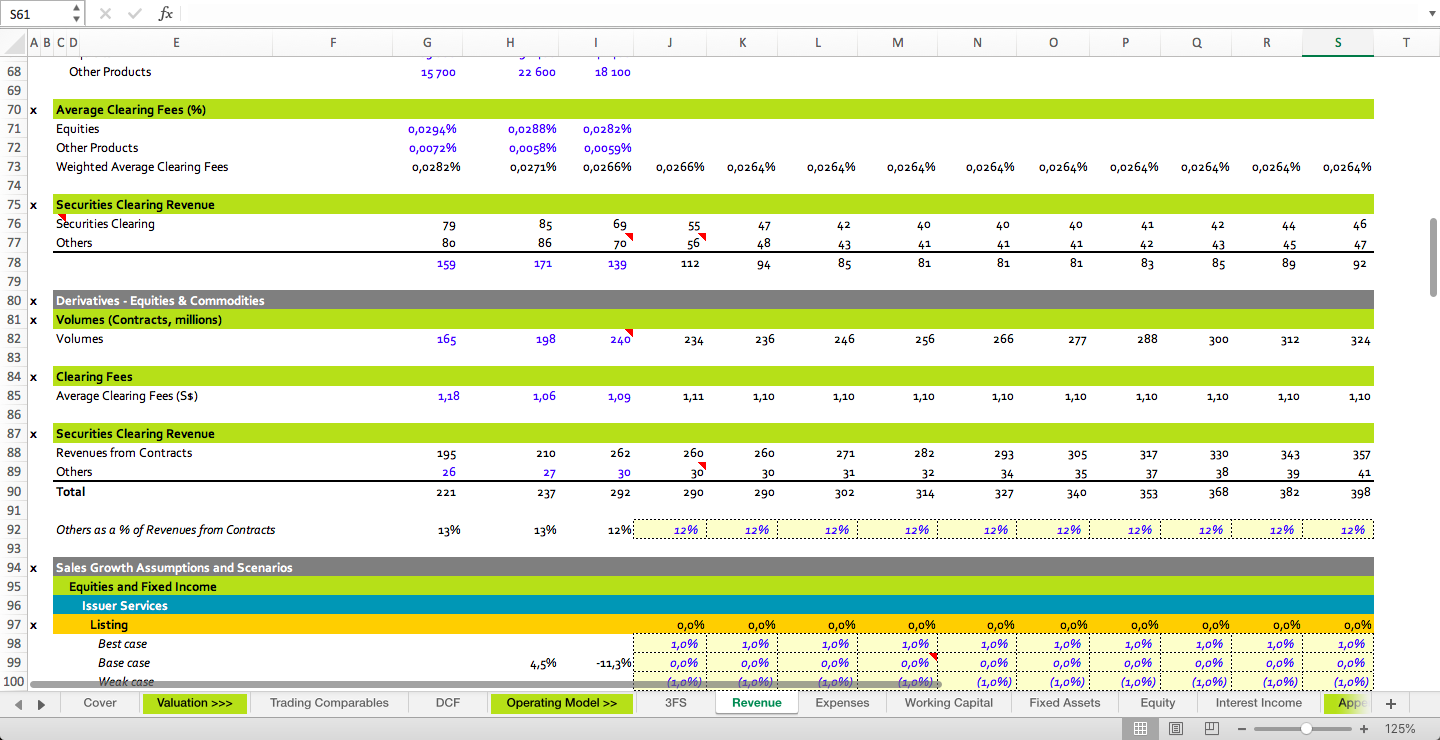
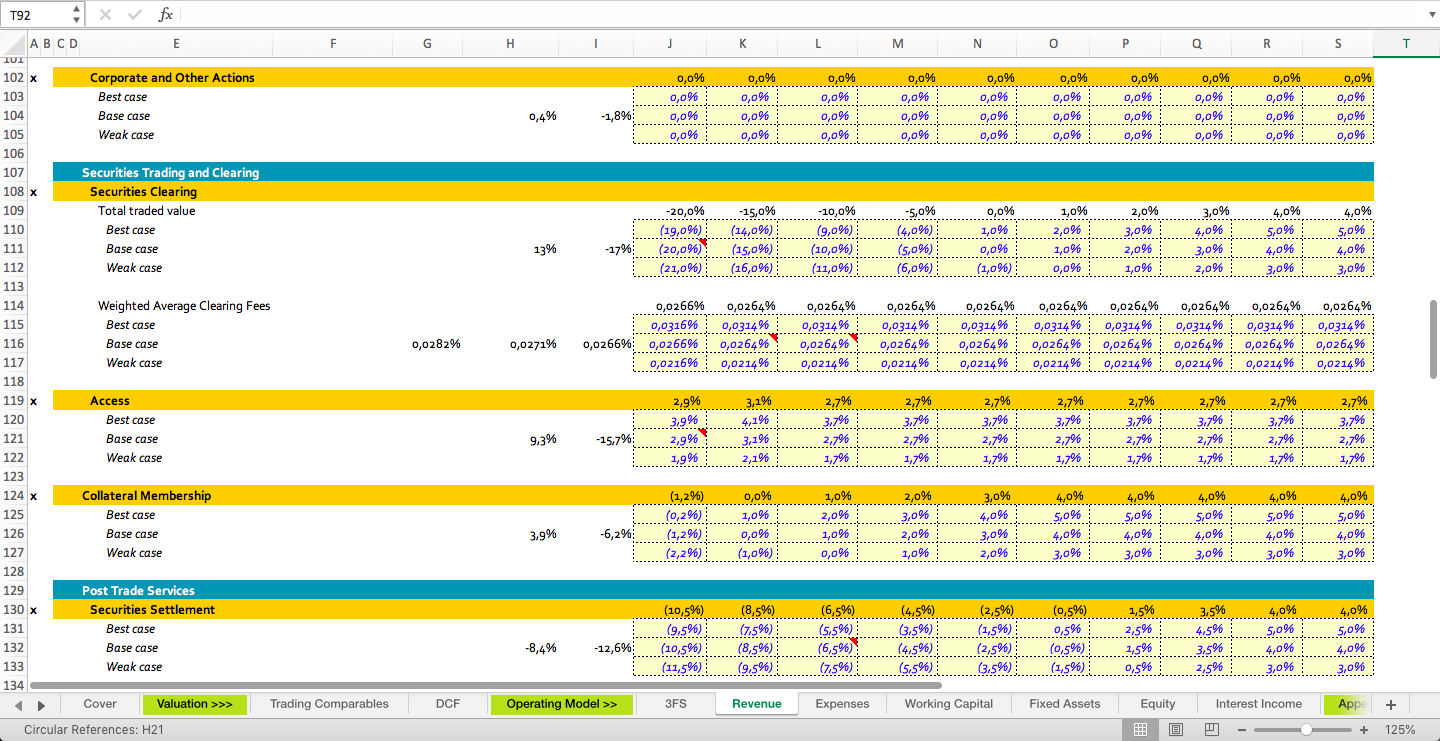
The product offering for Equities & Fixed Income is also quite complex and we
broke it down further into the respective components, each with its own specific services offered - Issuer Services, Securities Trading & Clearing and Post Trade Services. We then projected the line items either based on a y-o-y growth rate or just maintained it at zero except for the Securities Clearing, the largest line item. To derive the revenue from Securities Clearing, we multiplied the projected Total Annual Traded Volume by the projected Average Clearing Fees. We then sum them all up to obtain the Revenue projections for Equities & Fixed Income Products.
I'm currently an investment banker in an MM Firm. This was done as part of own my equity research. Covers SDAV, DDAV, clearing fees, etc. Covers the Operating Model, Key Comparables and Multiples, DCF. Sensitivity and scenario analysis was also done for this stock.
SGX is the the number 1 stock exchange in South East Asia. Singapore Exchange Limited (SGX) is the operator of equity, fixed income and derivatives markets in Singapore. The Singapore bourse currently offers listing, trading, clearing, settlement and depository and data services and domestic and foreign market participants. In FY2019, SGX reported revenues of $459.7m (51%), $347.5m (38%), and $102.5m (11%) in the Derivatives, Equities & Fixed Income, and Market Data & Connectivity business segments respectively.
A Discounted Cash Flow (DCF) model was employed to produce a valuation for
SGX with our integrated projections. As a check on our DCF methodology, we
validated the target price with market multiples and conducted a sensitivity
analysis.
The Enterprise Value (EV) of SGX is determined using the Unlevered Free Cash
Flow to Firm (FCFF) method and discounting the cash flows by Weighted Average Cost of Capital (WACC). This method is suitable as it will account for the cash flow to both debt holders and equity holders
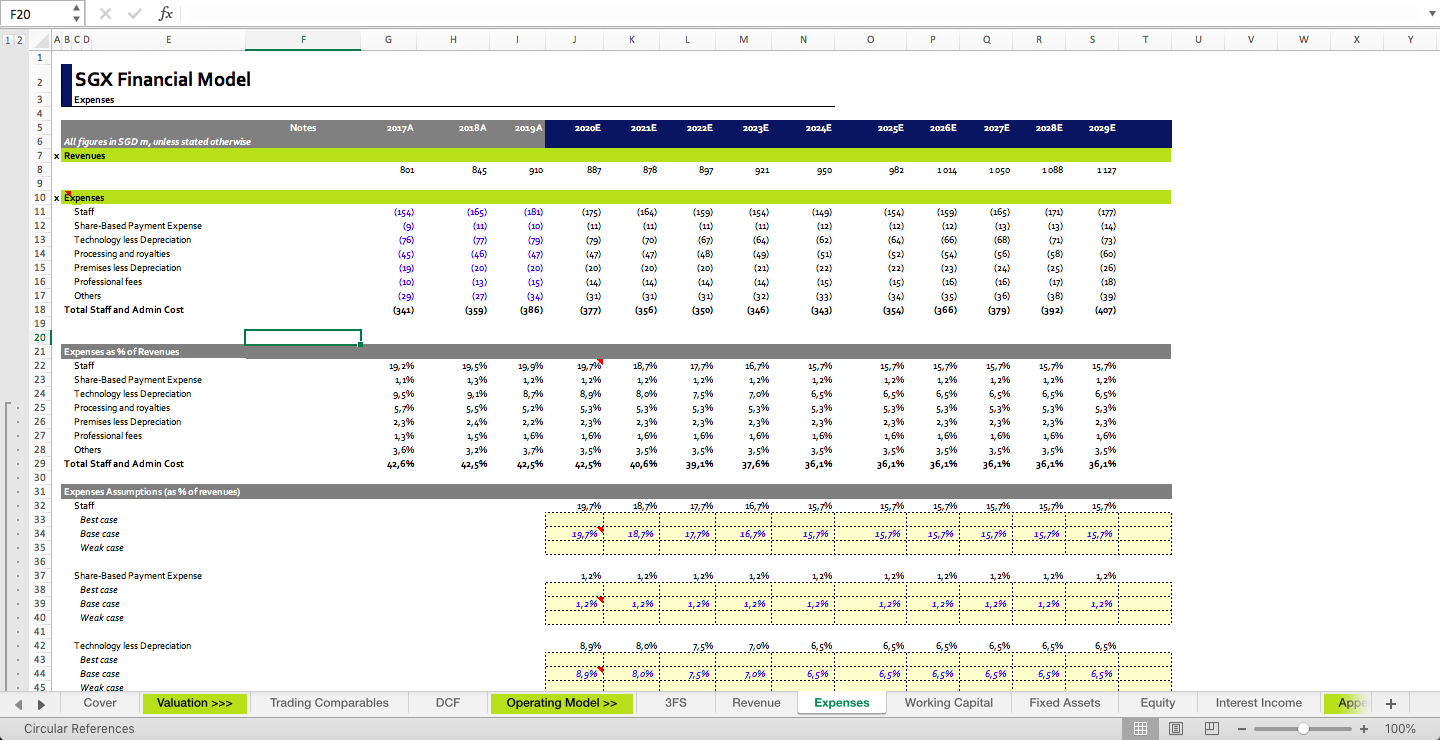
Given the nature of SGX’s product lines and their differing financial outlooks, we
have built a sum of parts forecast model, modeling revenue obtained SGX’s three product lines separately - Equities & Fixed Income, Derivatives and Market Data & Connectivity. Because costs are largely overheads, we modeled them together, separate from the individual product lines.
The product offering for Equities & Fixed Income is also quite complex and we
broke it down further into the respective components, each with its own specific services offered - Issuer Services, Securities Trading & Clearing and Post Trade Services. We then projected the line items either based on a y-o-y growth rate or just maintained it at zero except for the Securities Clearing, the largest line item. To derive the revenue from Securities Clearing, we multiplied the projected Total Annual Traded Volume by the projected Average Clearing Fees. We then sum them all up to obtain the Revenue projections for Equities & Fixed Income Products.
This Best Practice includes
1 Excel File
