Originally published: 27/11/2018 10:39
Publication number: ELQ-99607-1
View all versions & Certificate
Publication number: ELQ-99607-1
View all versions & Certificate

How to Use the Simple Linear Regression Model | Geometrical Representation
Find out how to use the simple linear regression model through geometrical representation.
- Step n°1 |
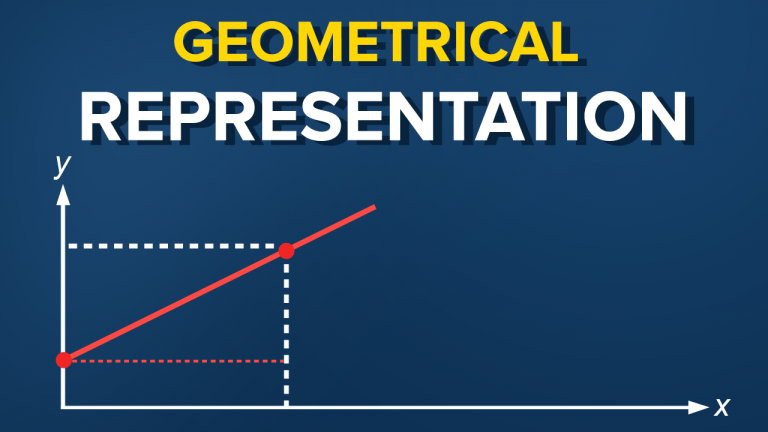
The simple linear regression model. Geometrical representation
Let’s check out the simple linear regression model equation. Here it is.
You have probably heard about the regression line, right? When we plot the data points on an x-y plane, the regression line is the best-fitting line through the data points.
Okay. Here’s a plot with some data points. We plot the line based on the regression equation.
The grey points that are scattered are the observed values.
B zero, as we said earlier, is a constant and is the intercept of the regression line with the y axis.
B one is the slope of the regression line. It shows how much y changes for each unit change of x.
The distance between the observed values and the regression line is the estimator of the error term epsilon. It’s point estimate is called residual.
Now, if you draw a perpendicular from an observed point to the regression line, the intercept between that perpendicular and the regression line is a point with a y value equal to y hat. As we said earlier, given an x, y hat is the value predicted by the regression line.
