
Originally published: 30/04/2020 10:13
Publication number: ELQ-42816-1
View all versions & Certificate
Publication number: ELQ-42816-1
View all versions & Certificate

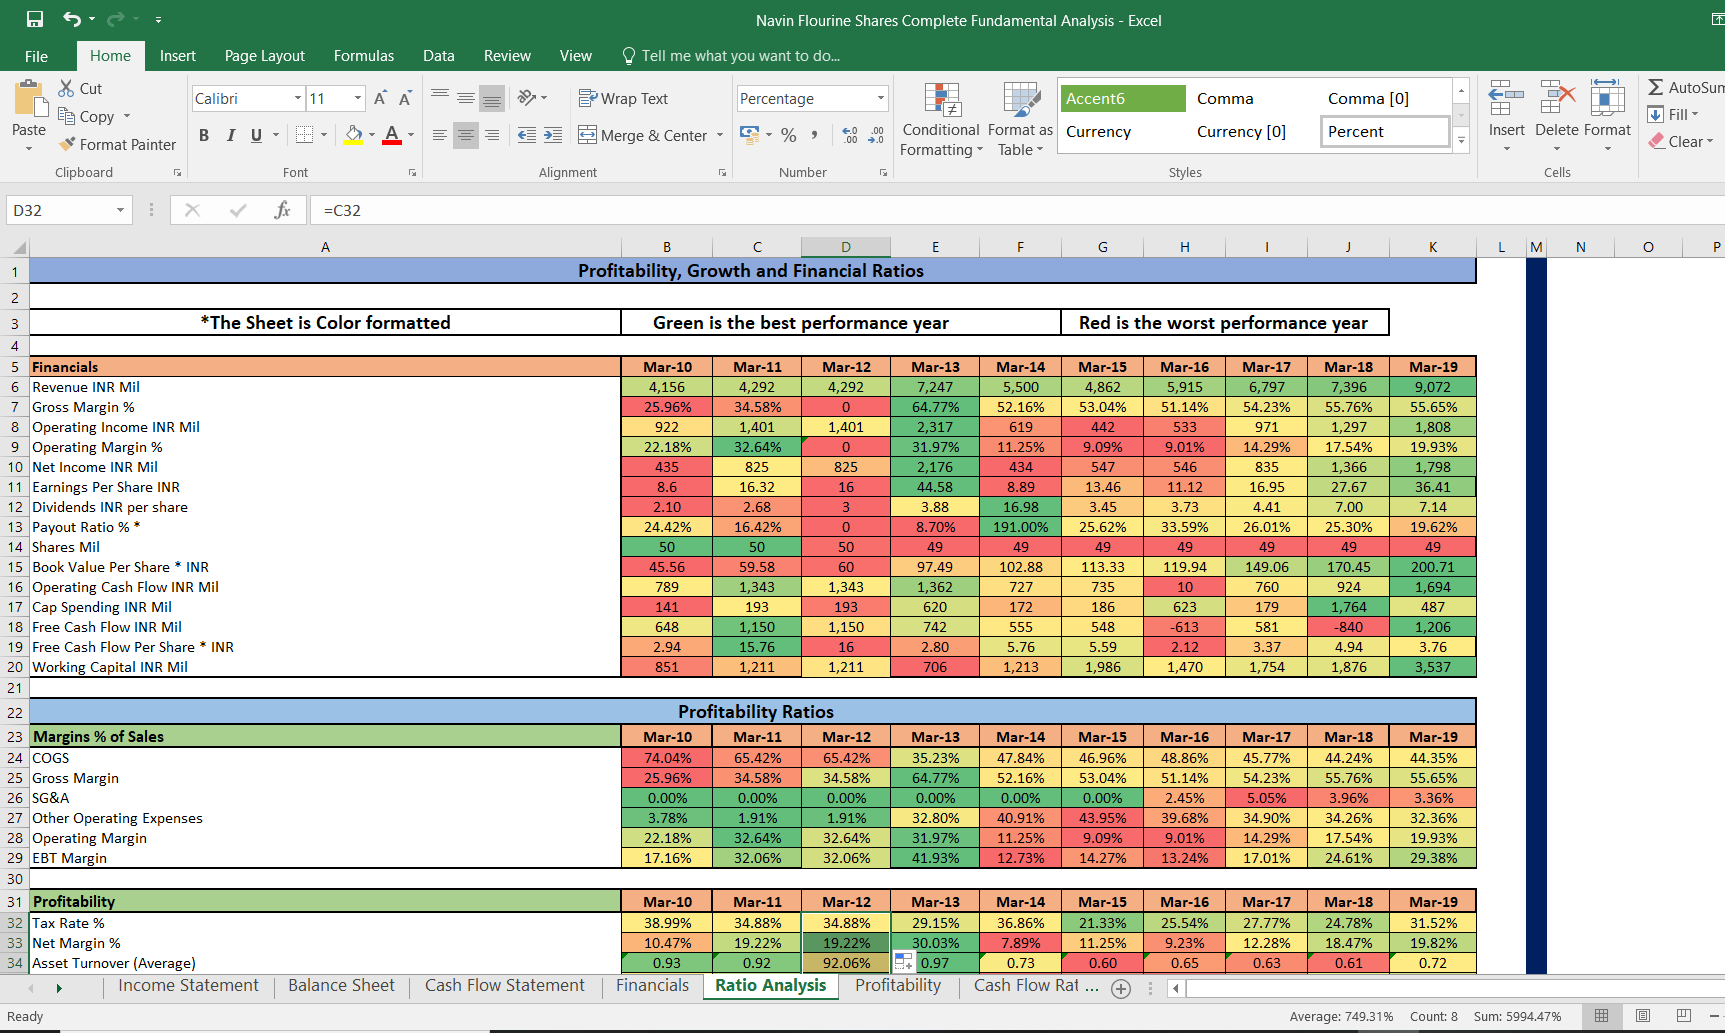
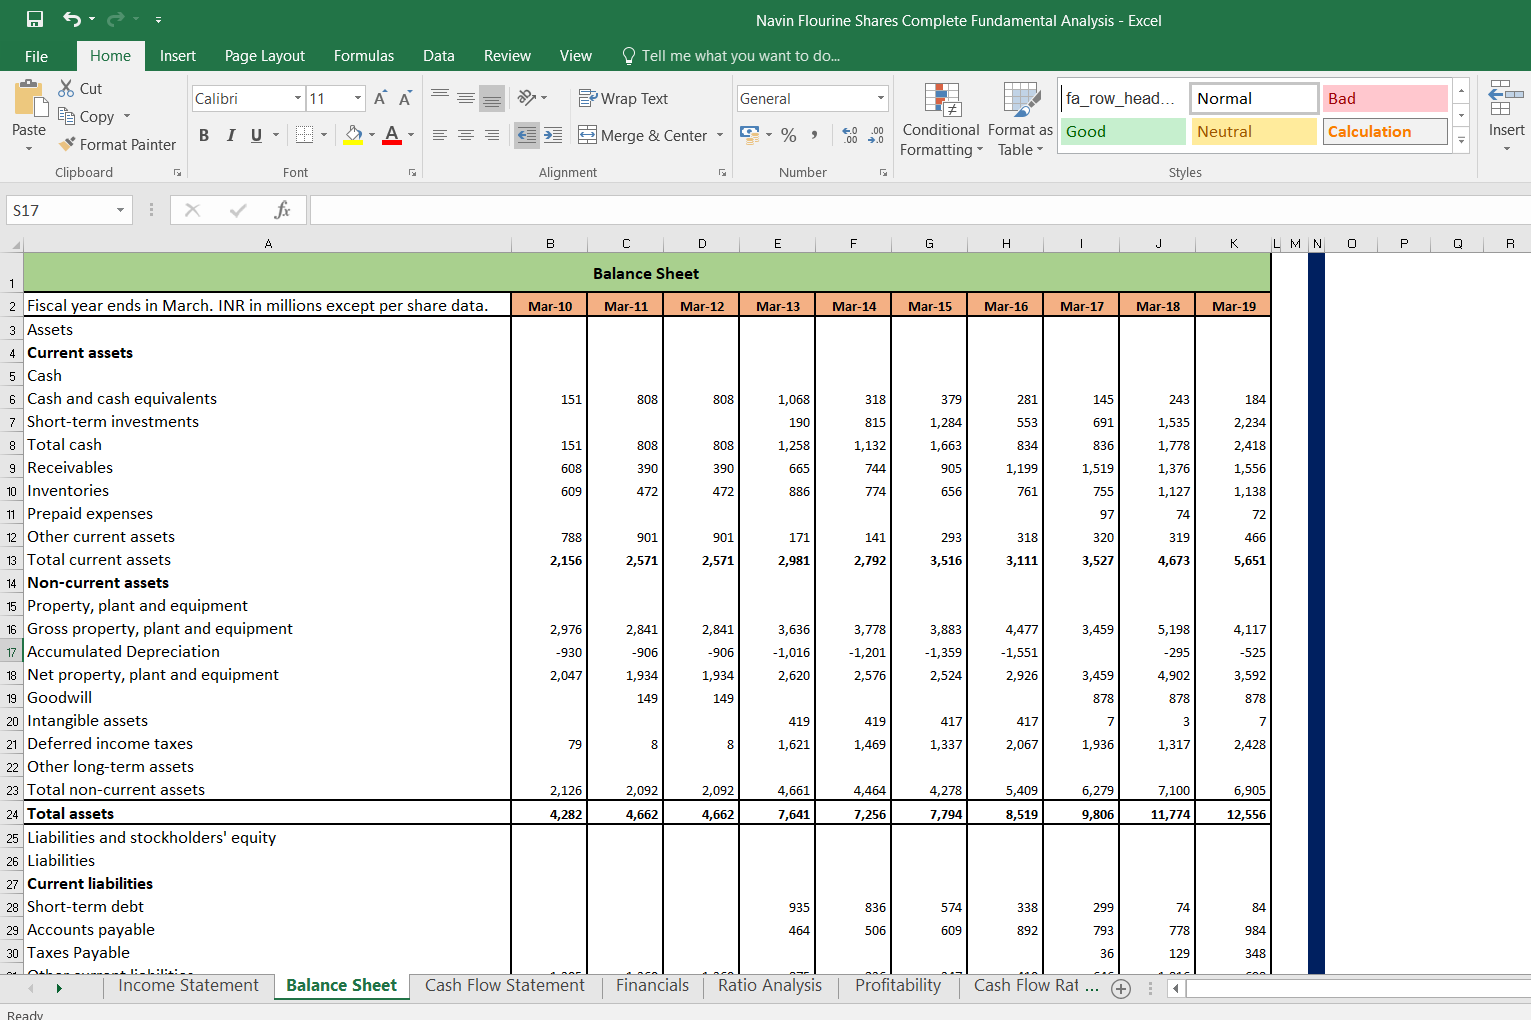
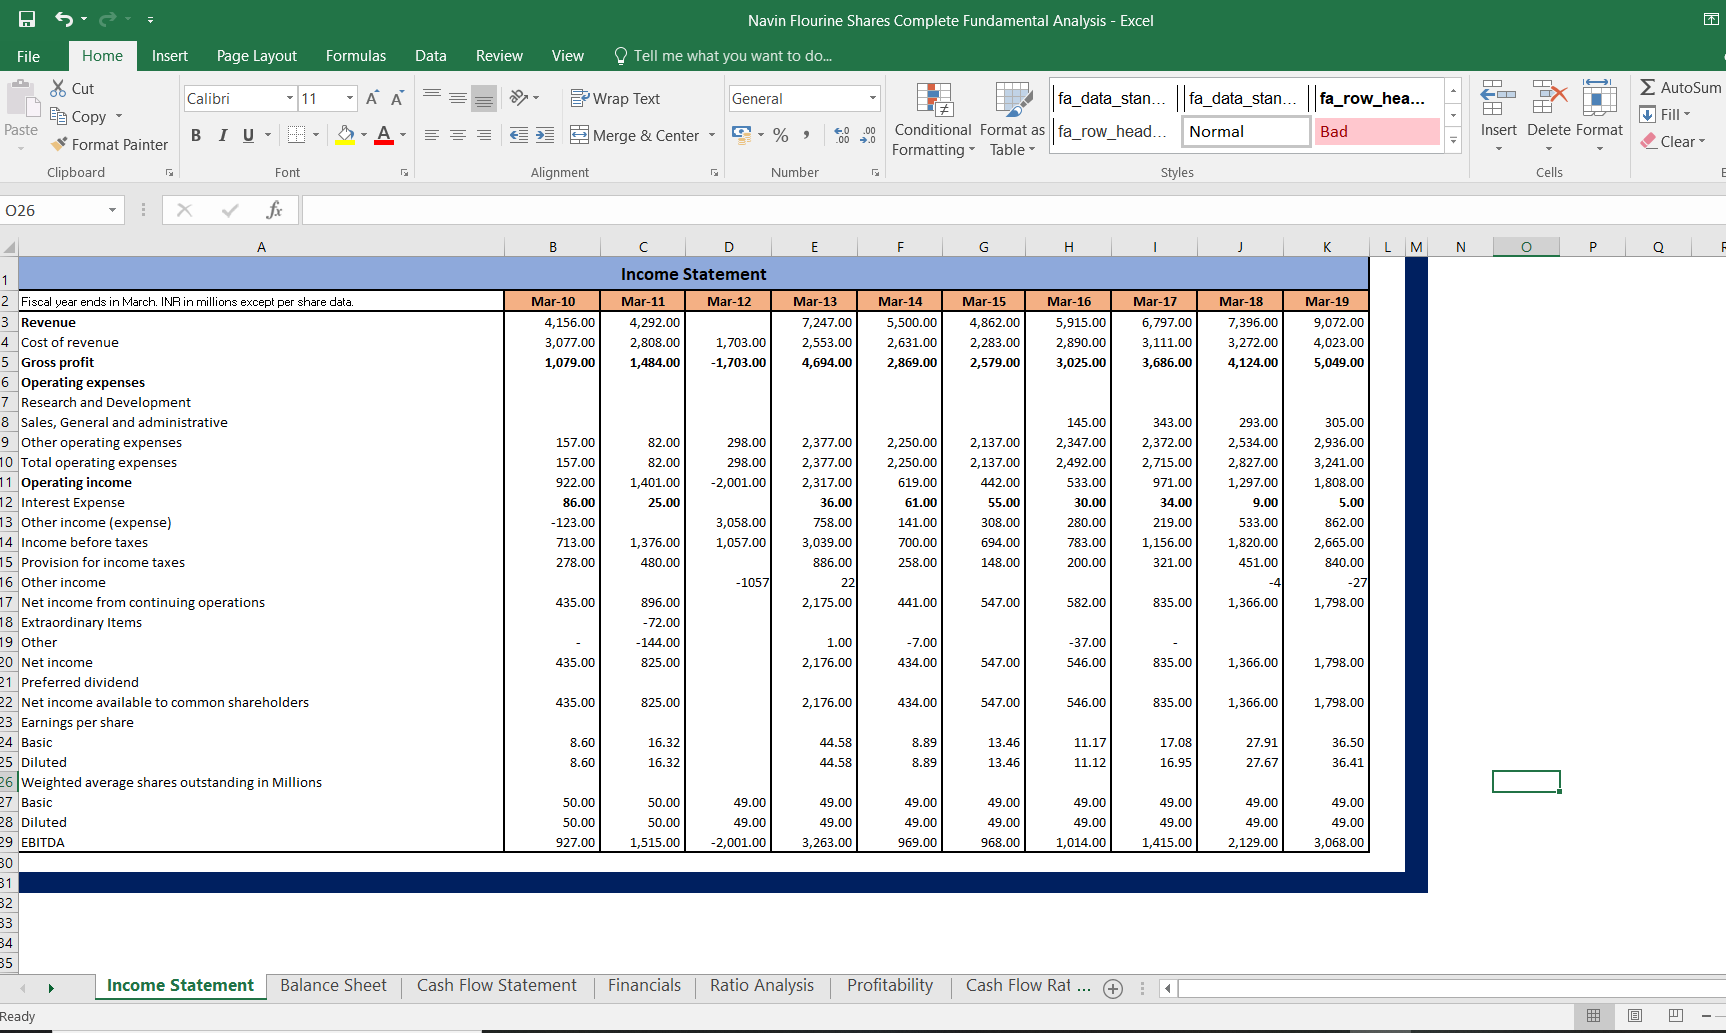
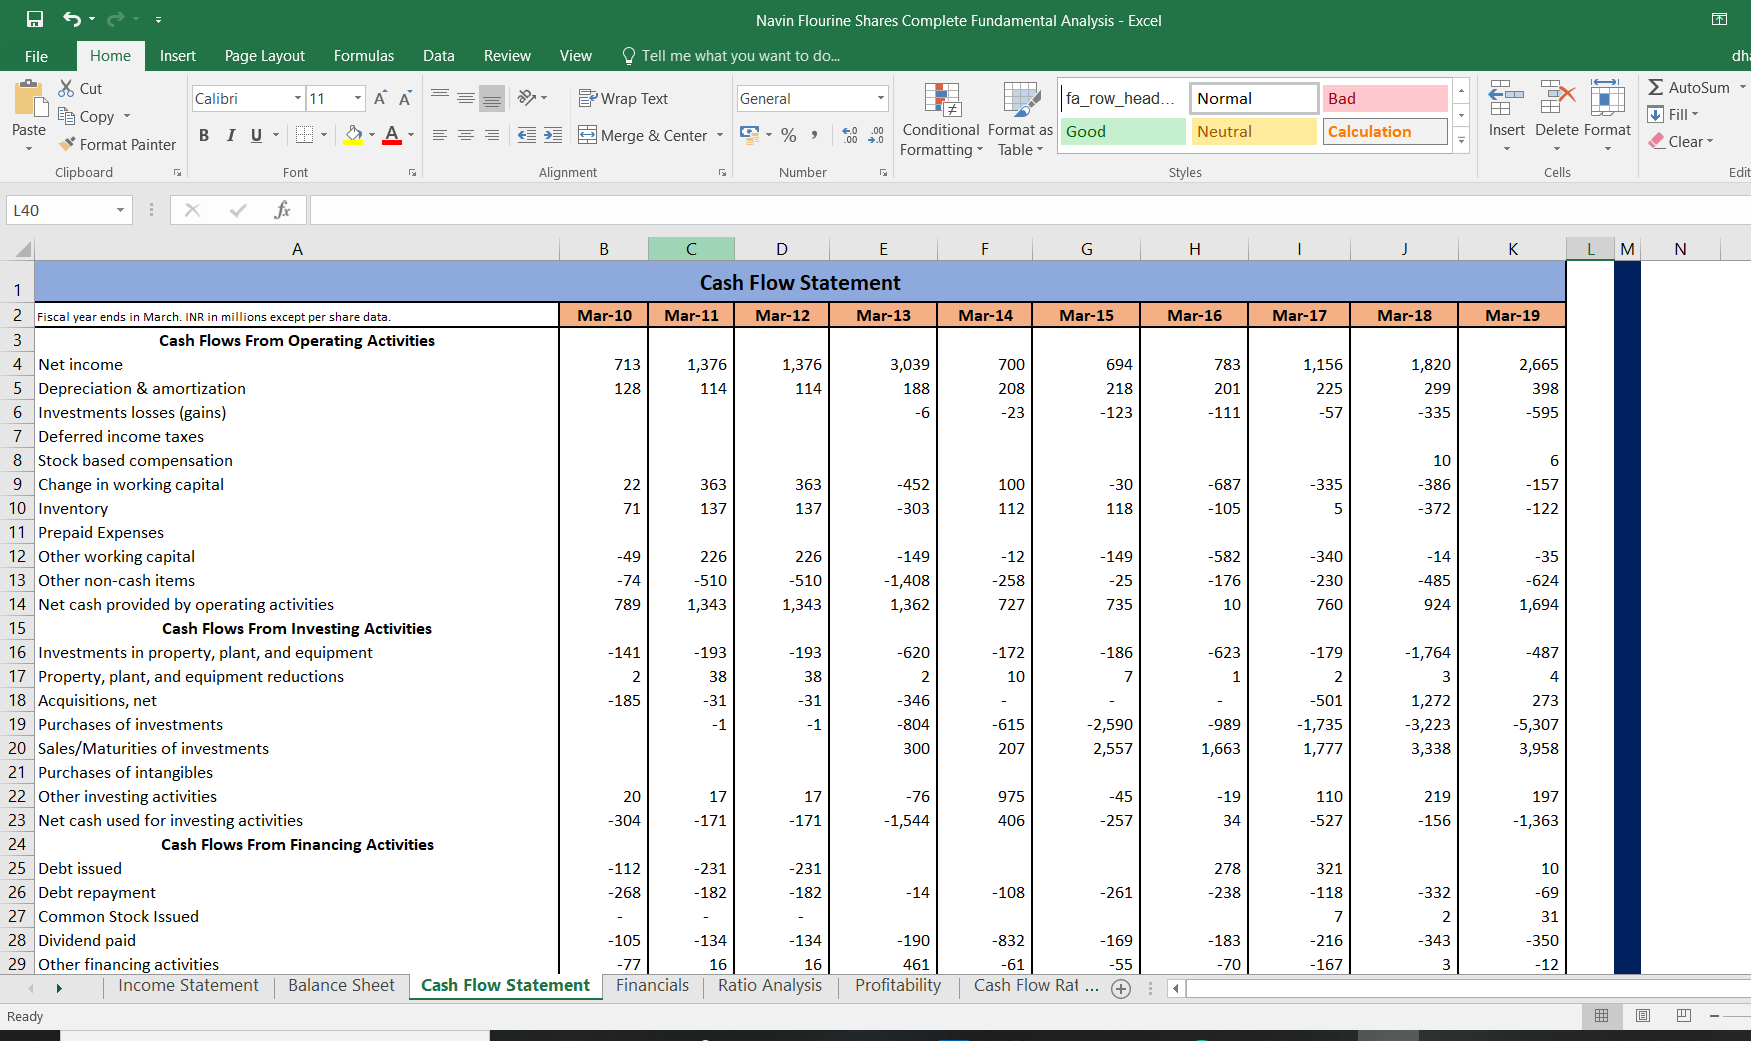
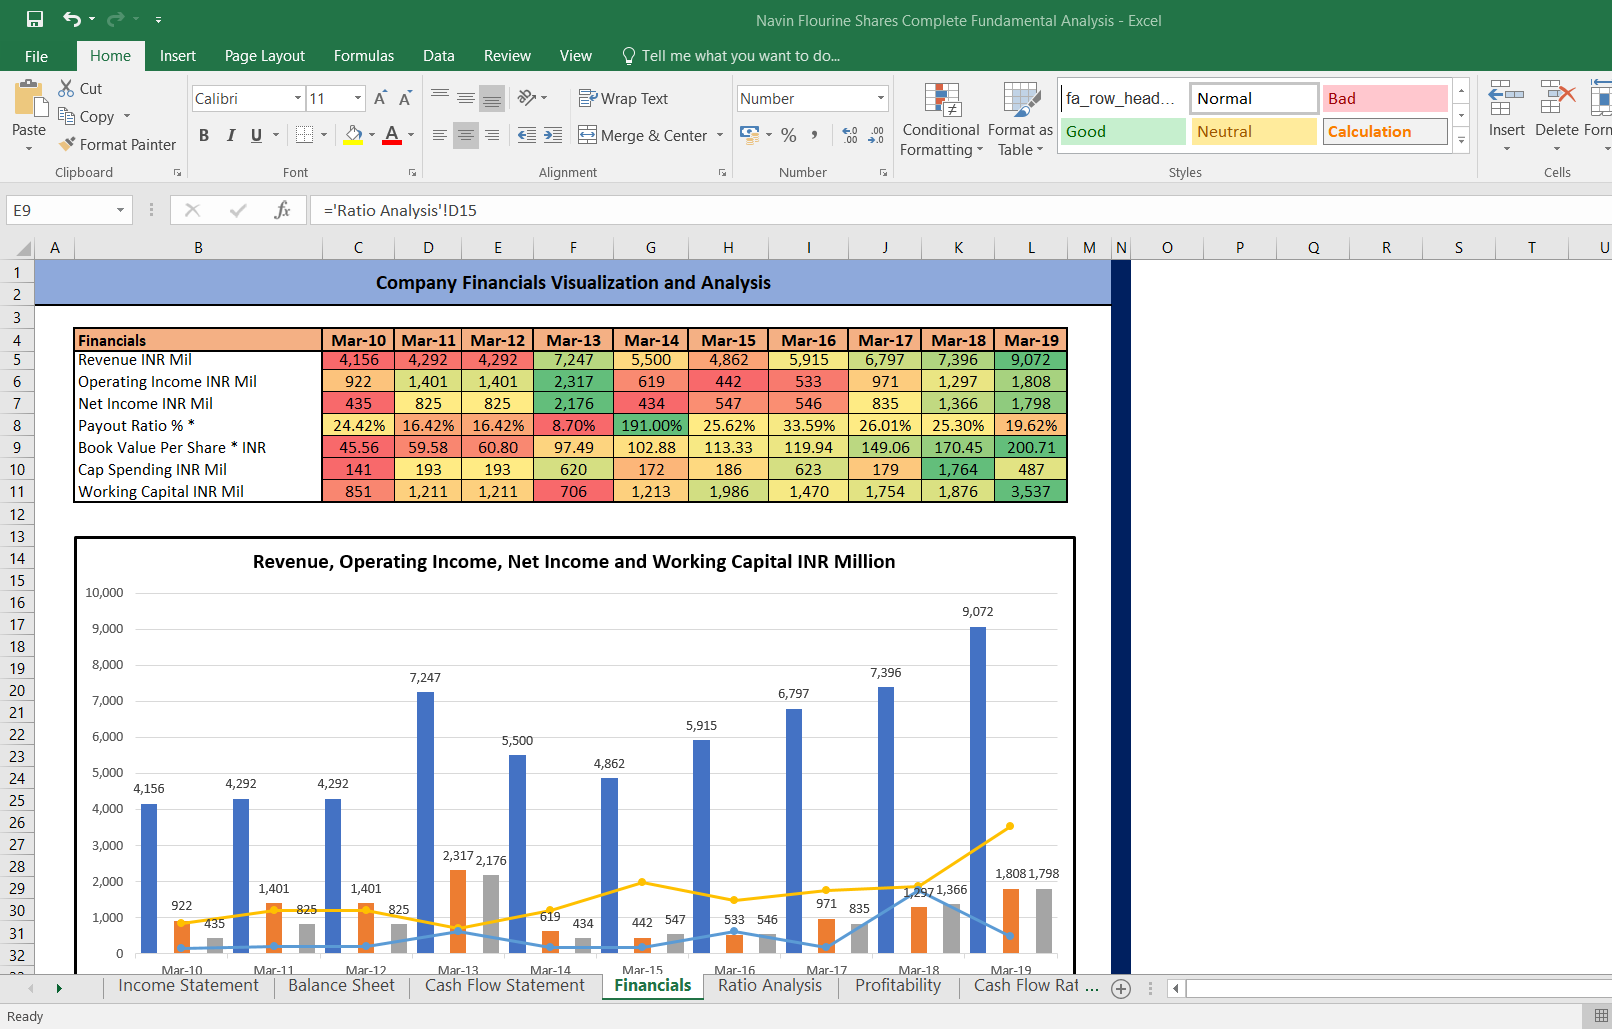
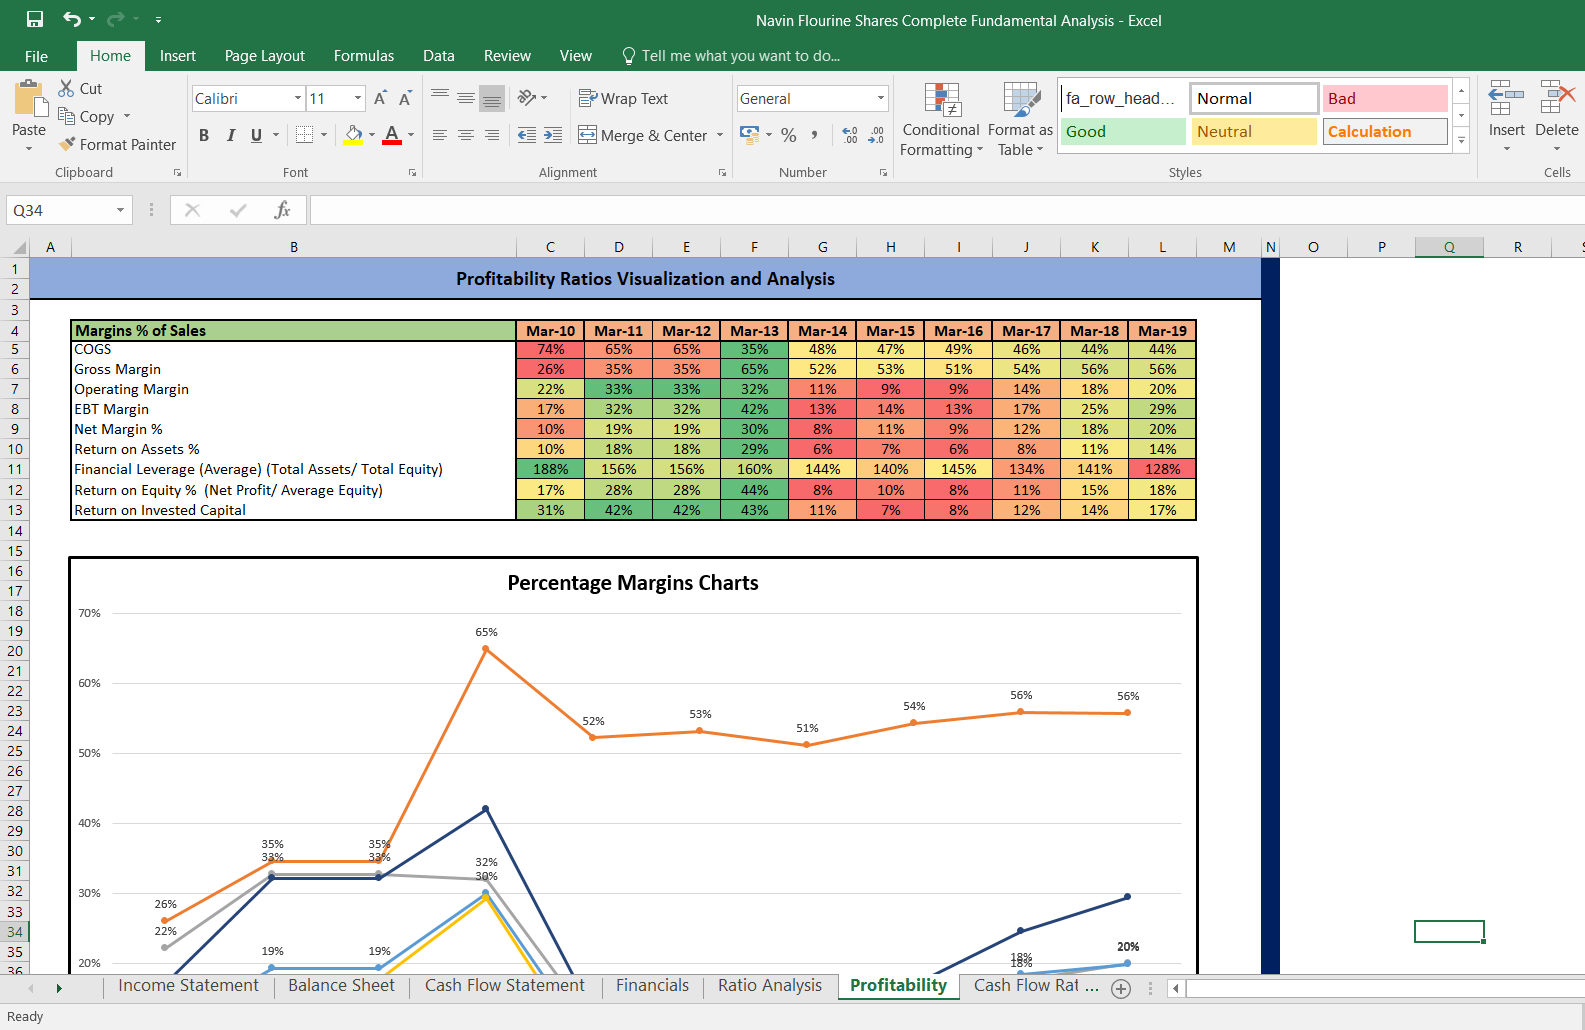
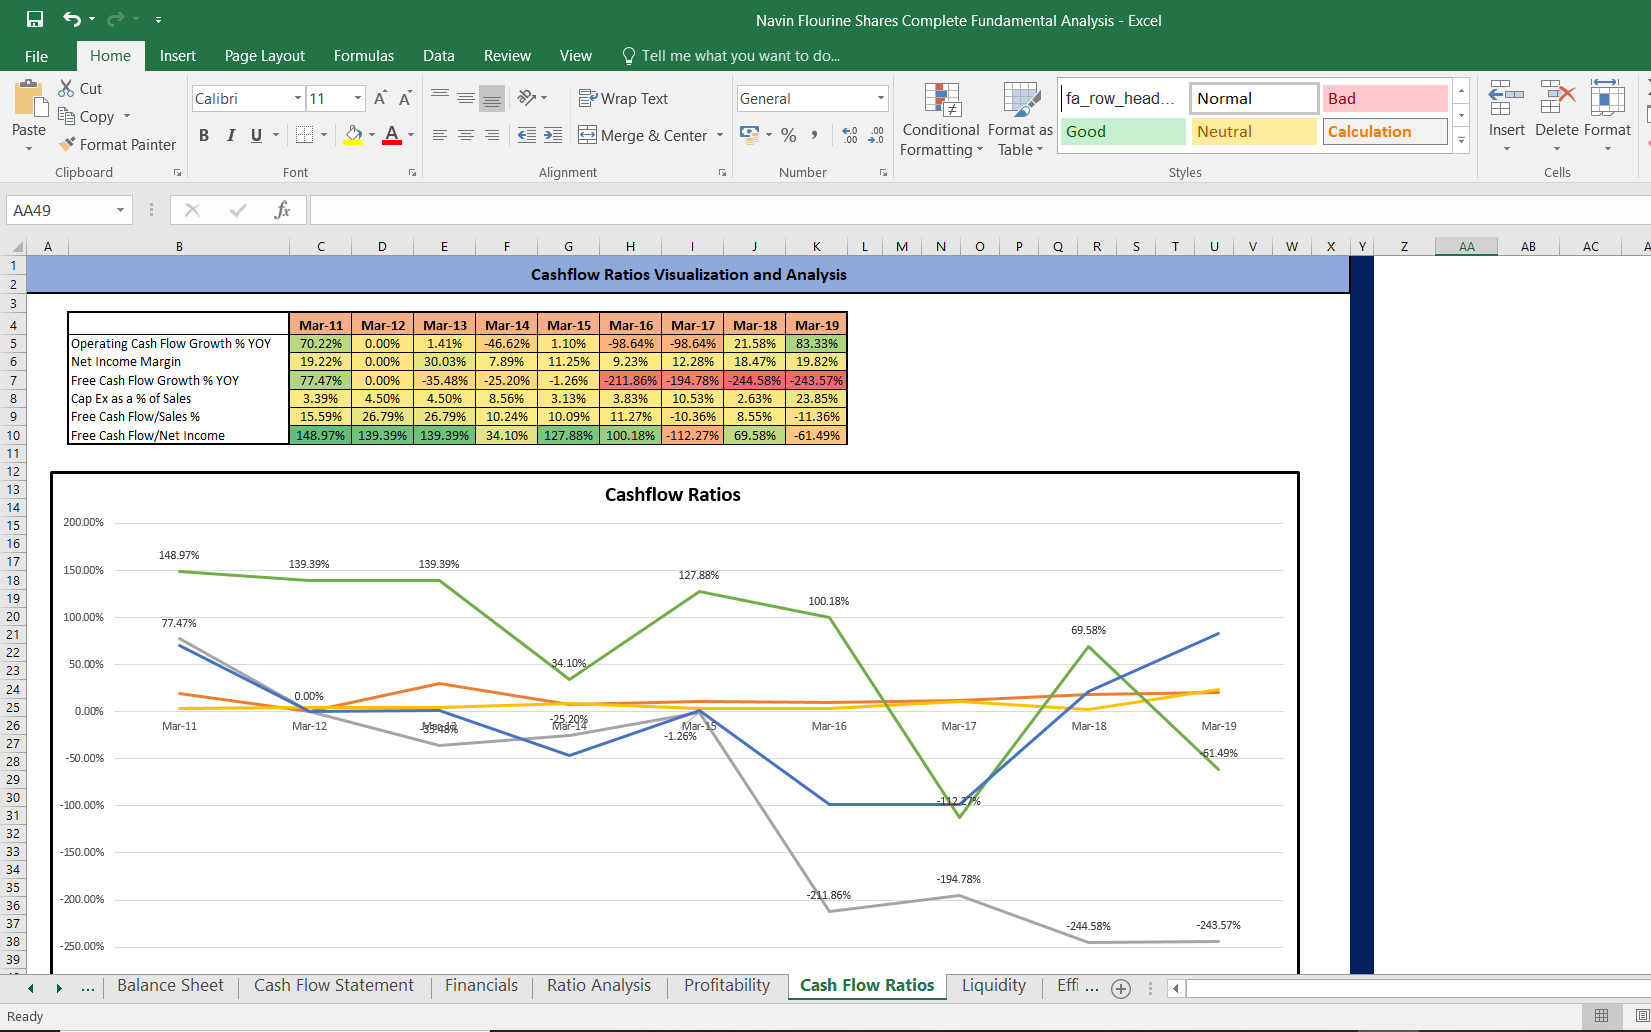
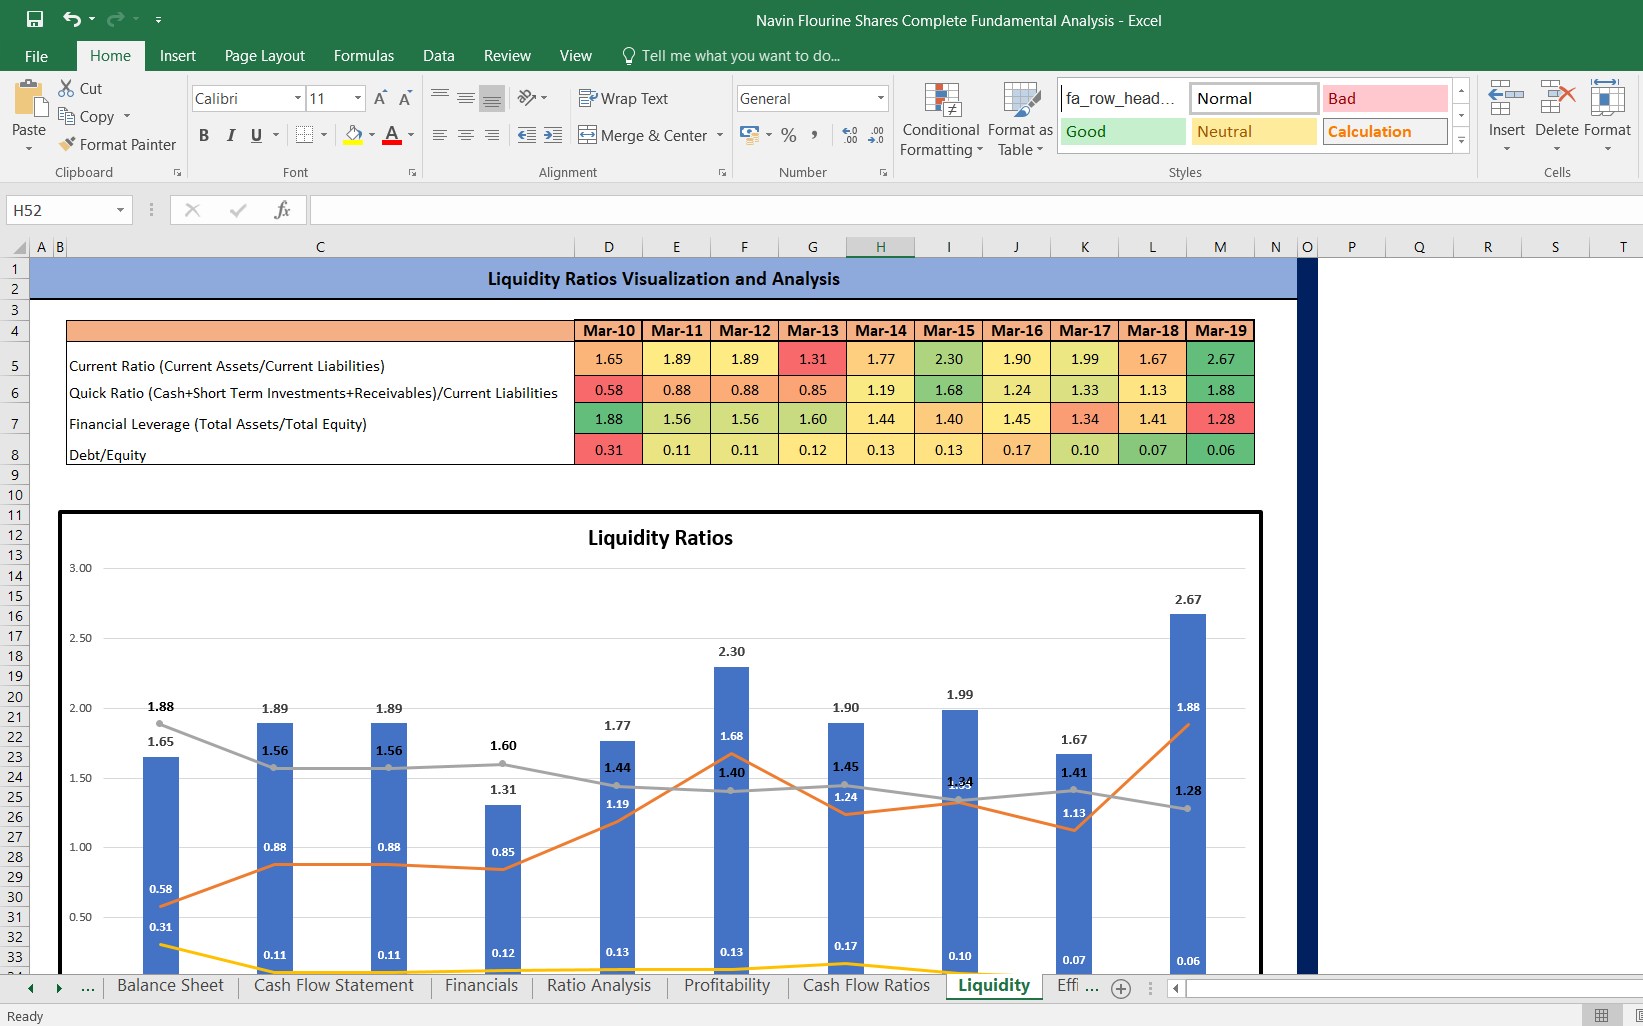
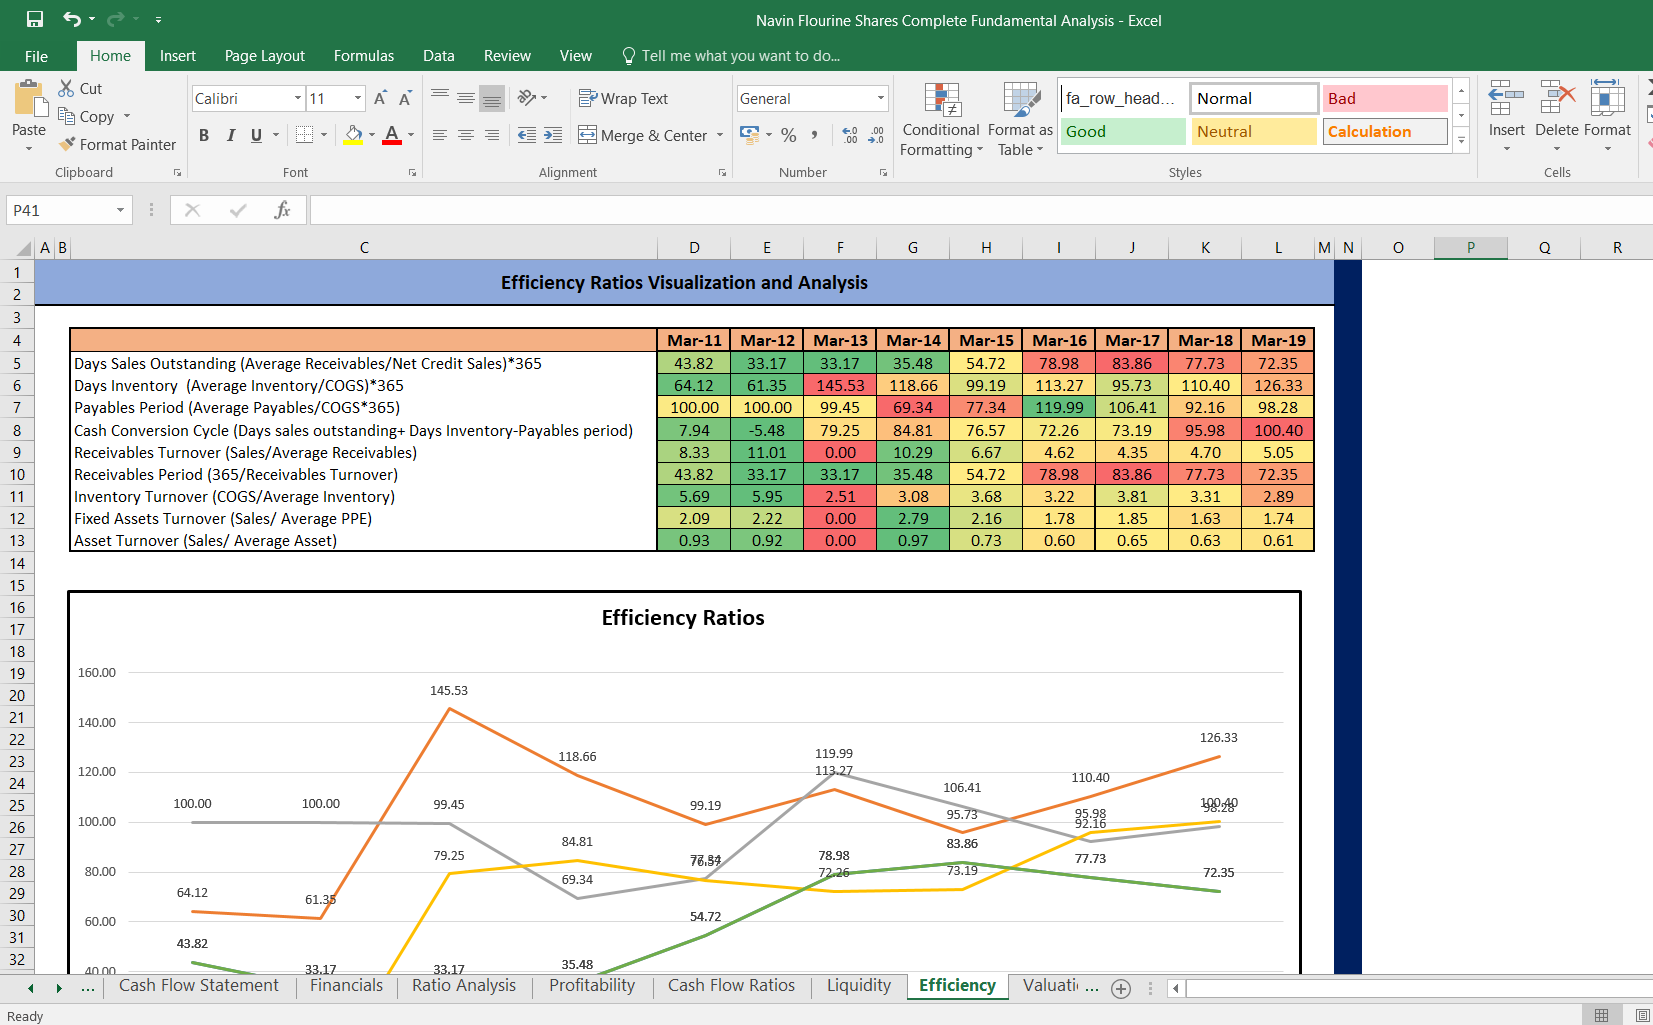
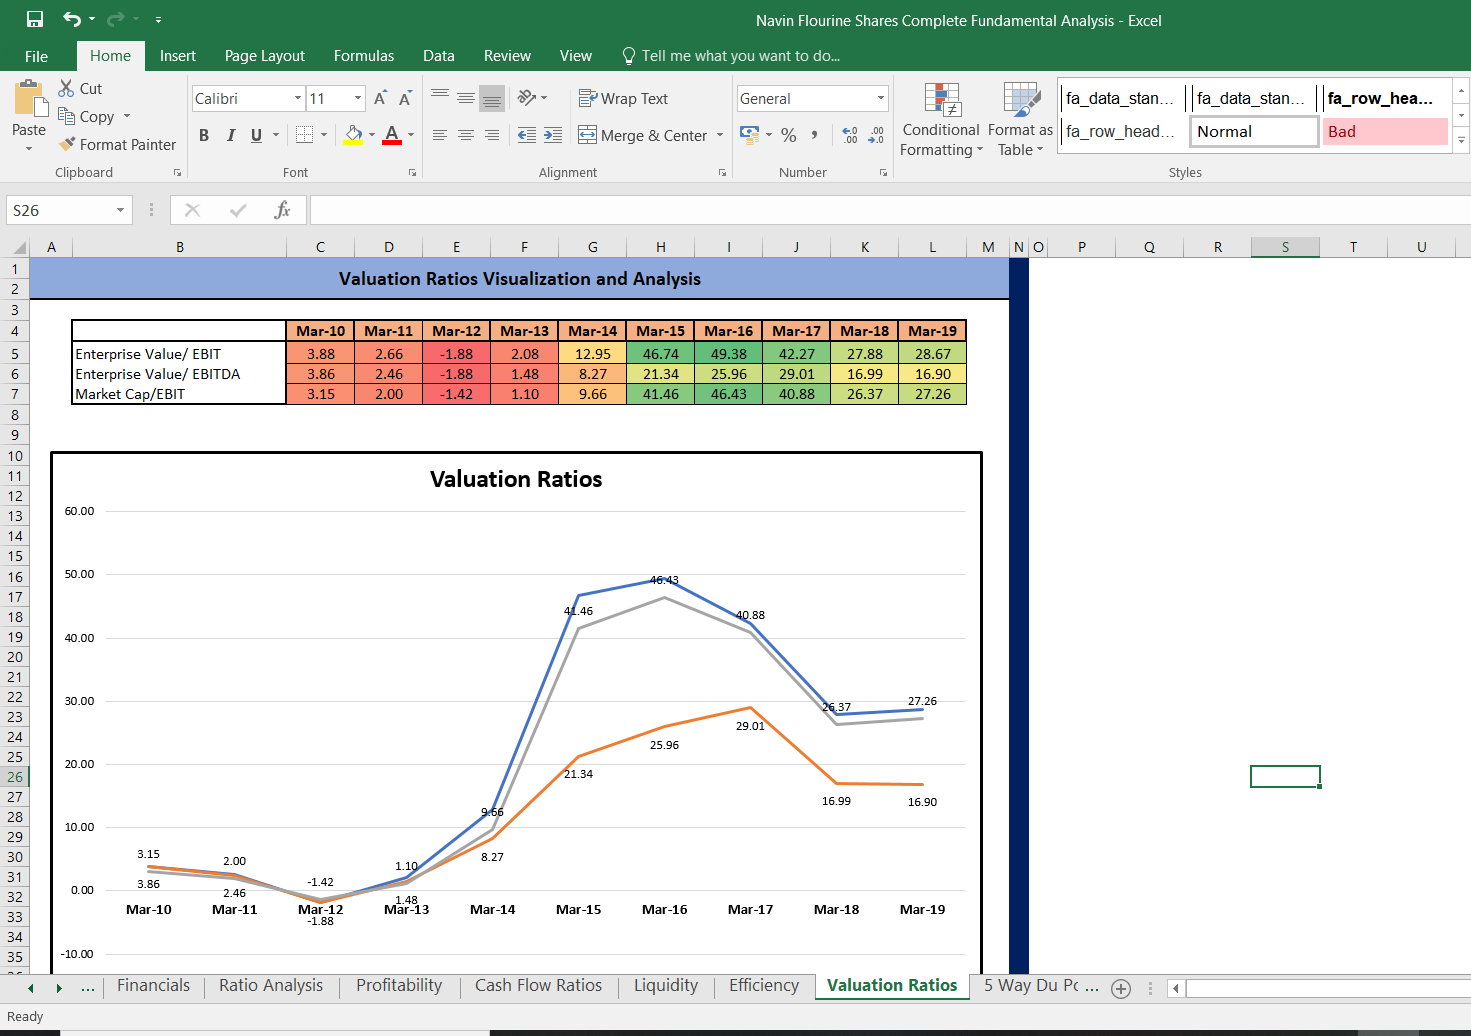
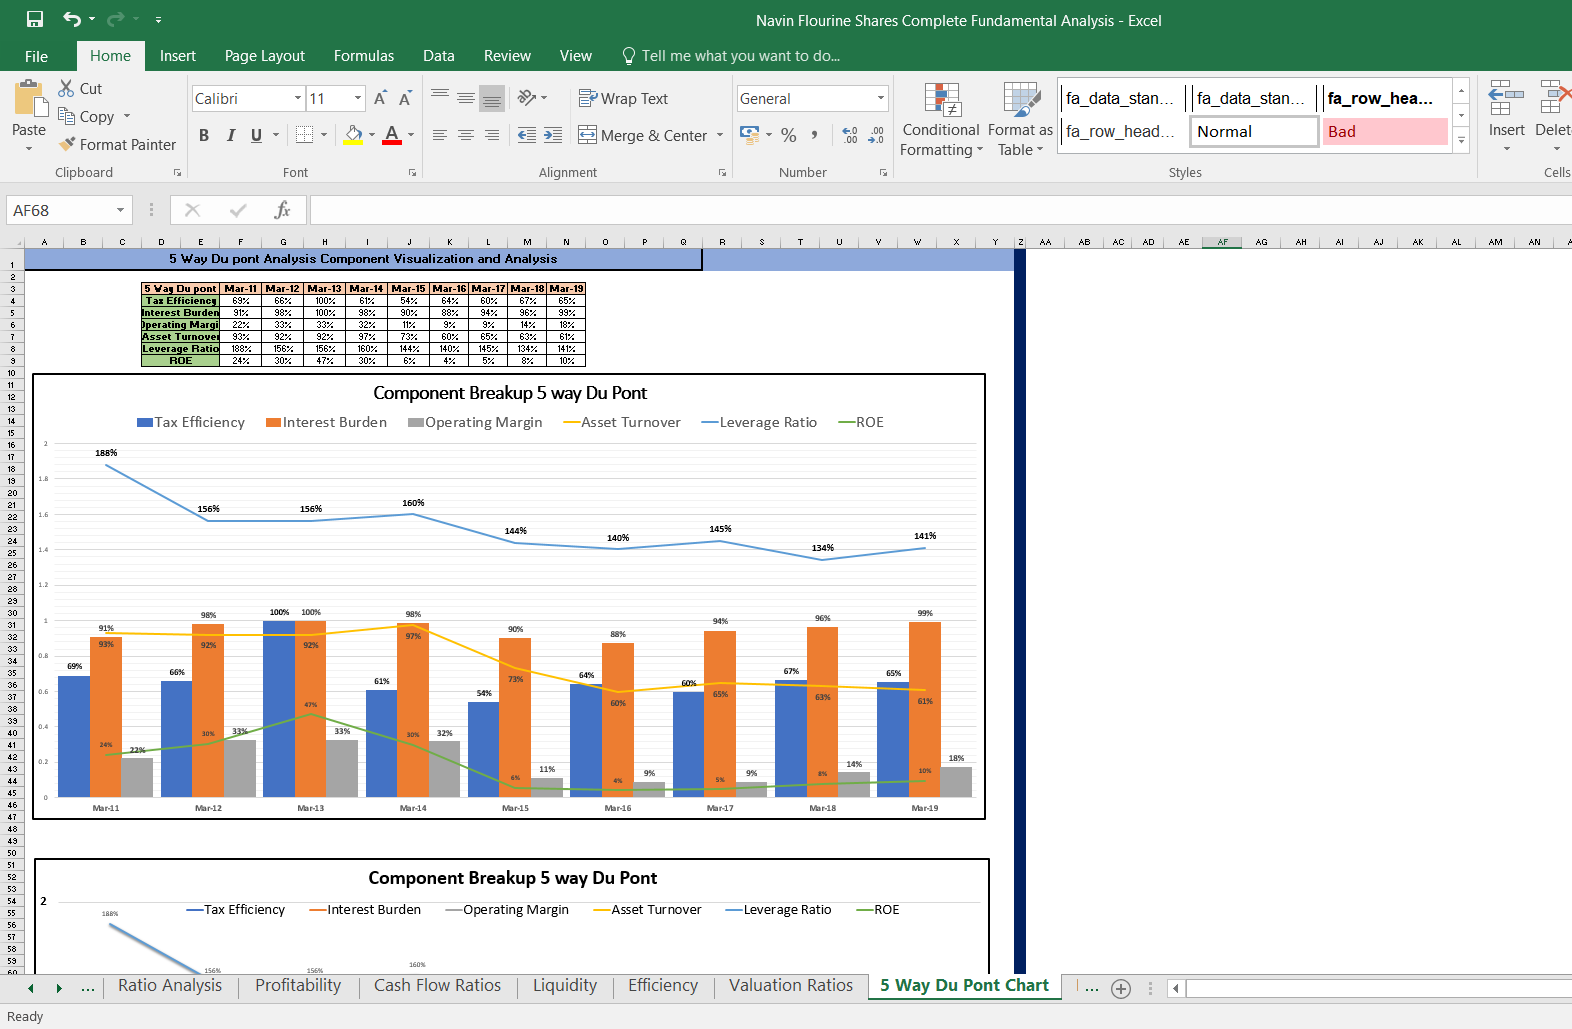
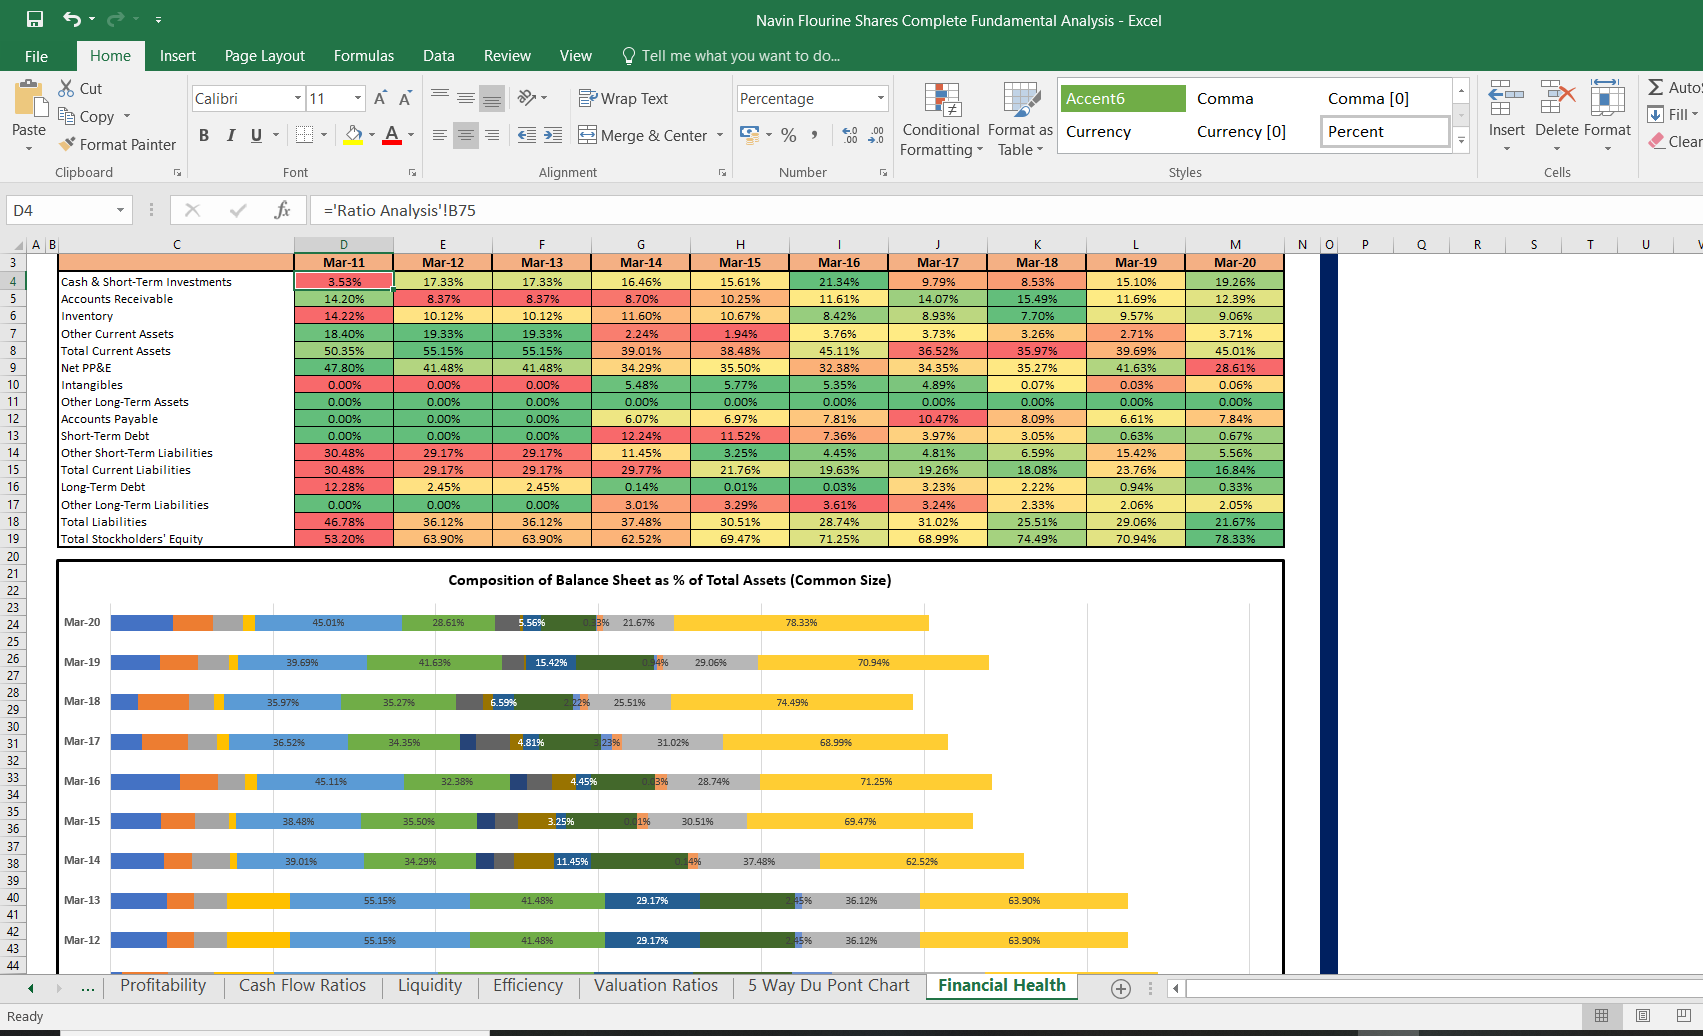
Navin Fluorine International Complete Fundamental Analysis
Fundamental Analysis in Microsoft Excel of Navin Fluorine International Shares.
A thorough research into the Fundamentals of 200+ Stocks listed in IndiaFollow 208
Further information
The aim is to provide a thorough outlook into the company's financial position. This will help the students in projects and learning fundamental analysis. This can also be used by Investors who are looking to do their own due diligence before investing in the Indian Stock Markets.
Equity Research, Fundamental Analysis, Valuation, Long Term Investing
