
Originally published: 01/04/2019 14:51
Last version published: 22/10/2024 14:34
Publication number: ELQ-60014-20
View all versions & Certificate
Last version published: 22/10/2024 14:34
Publication number: ELQ-60014-20
View all versions & Certificate

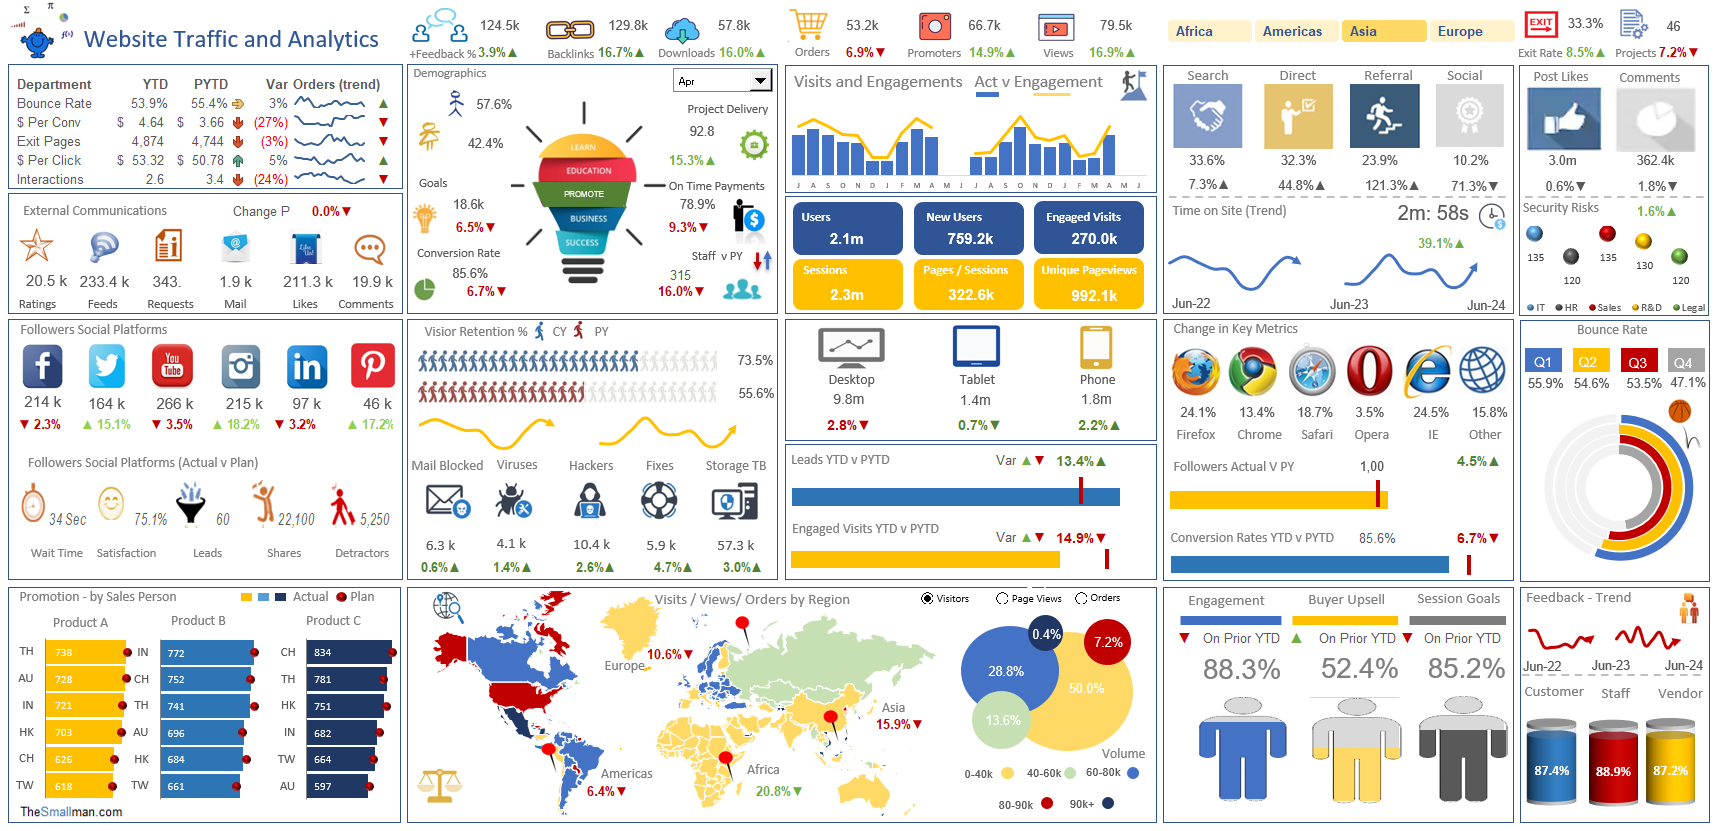
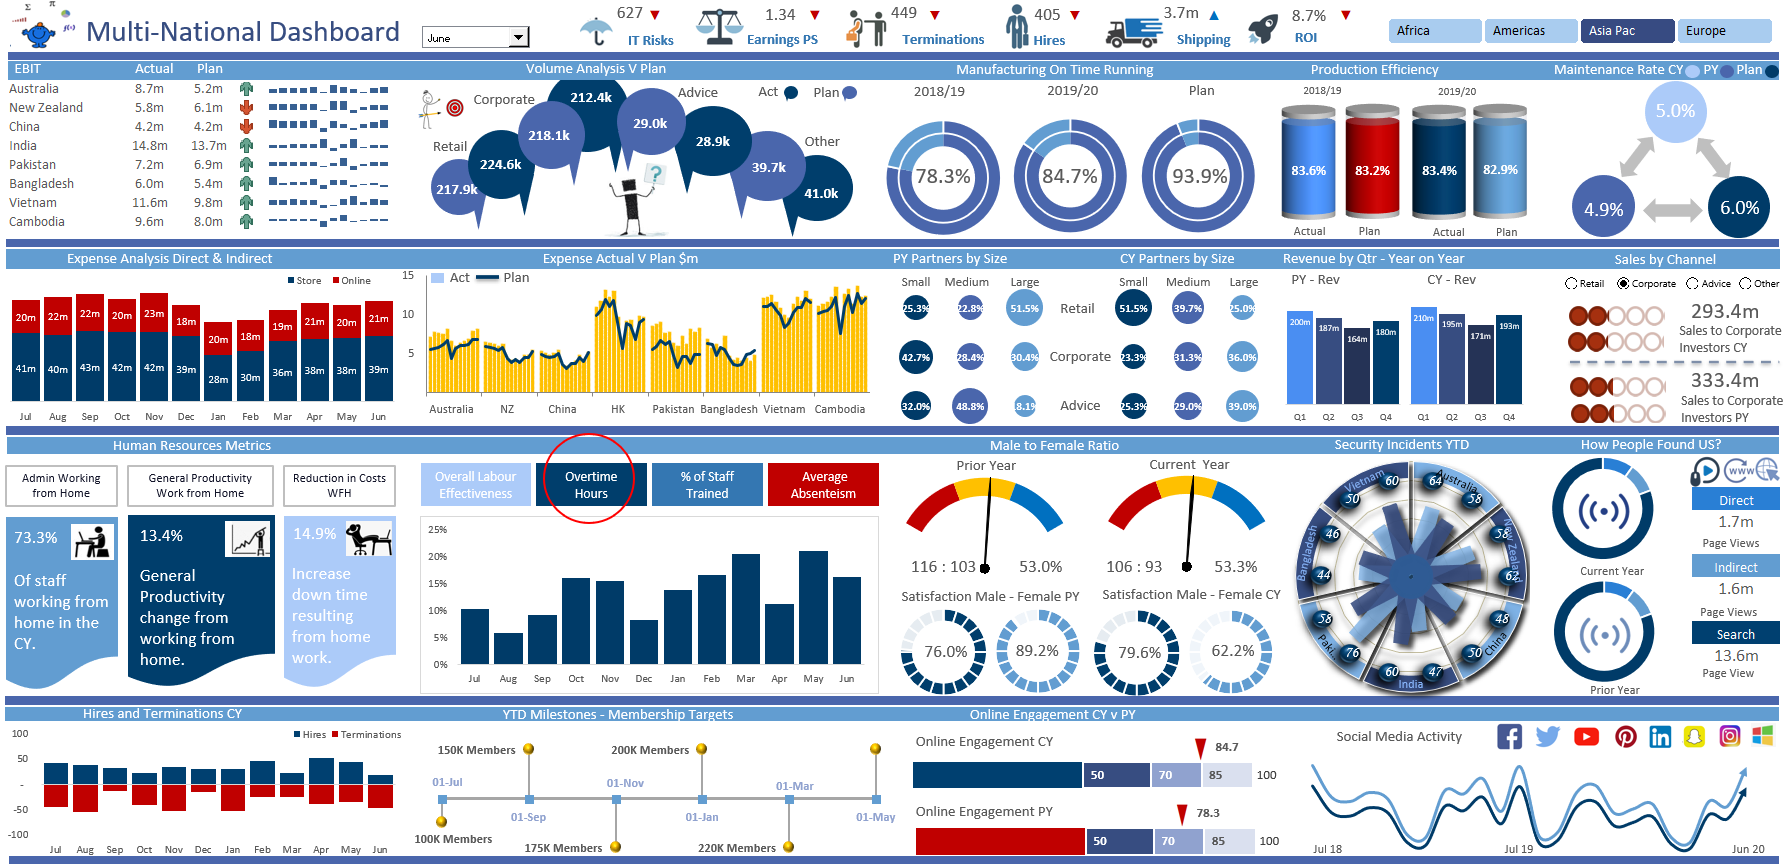
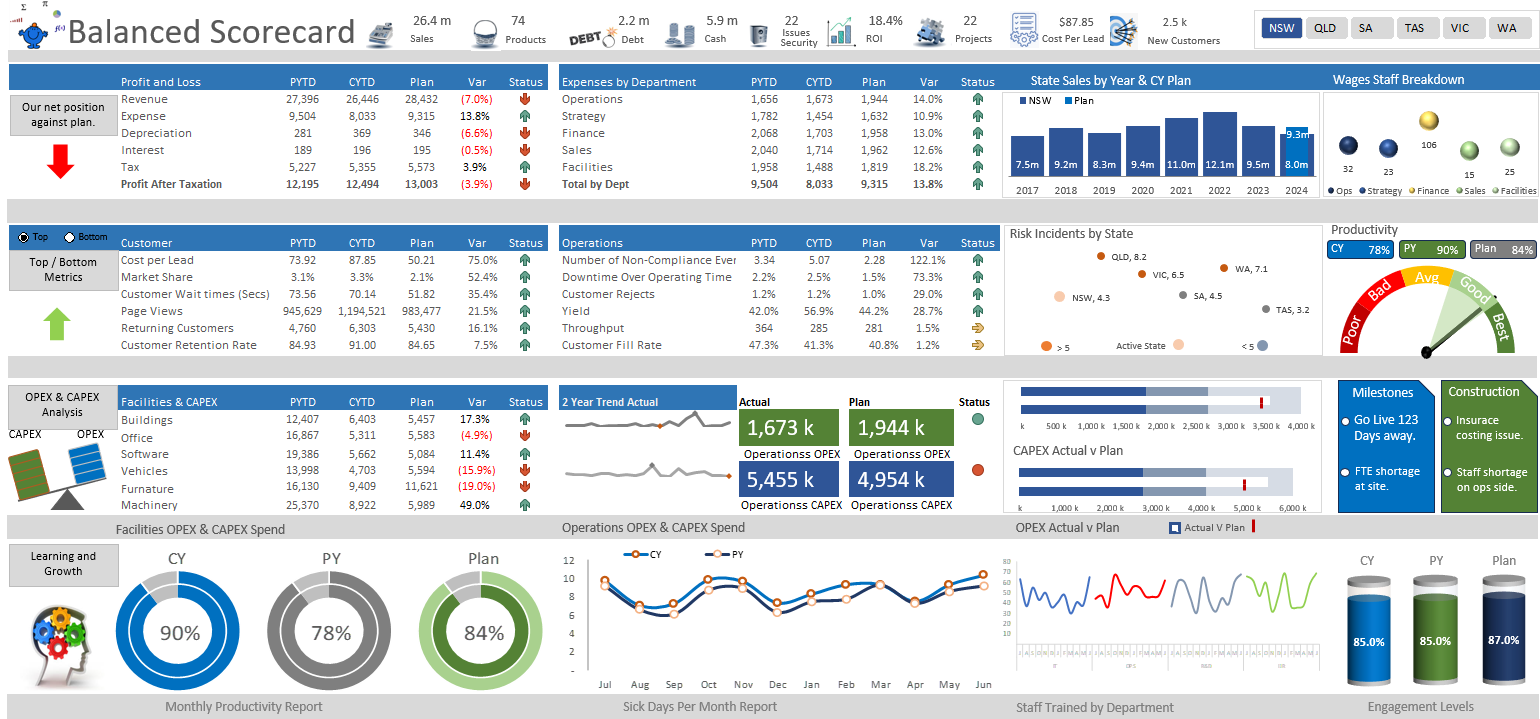
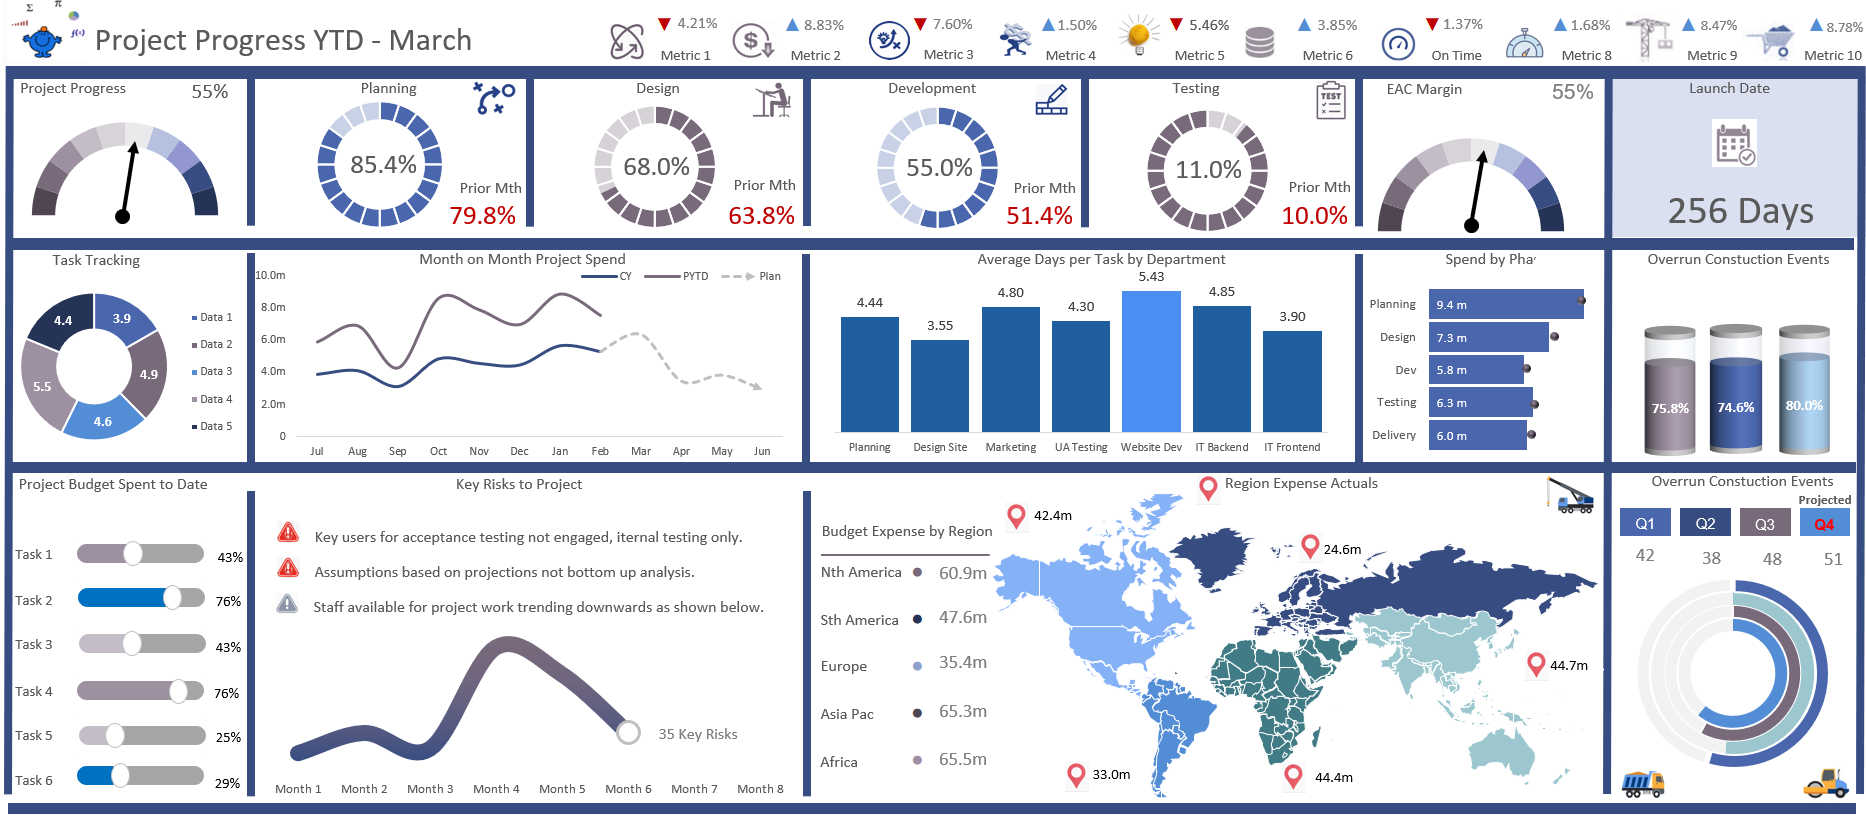
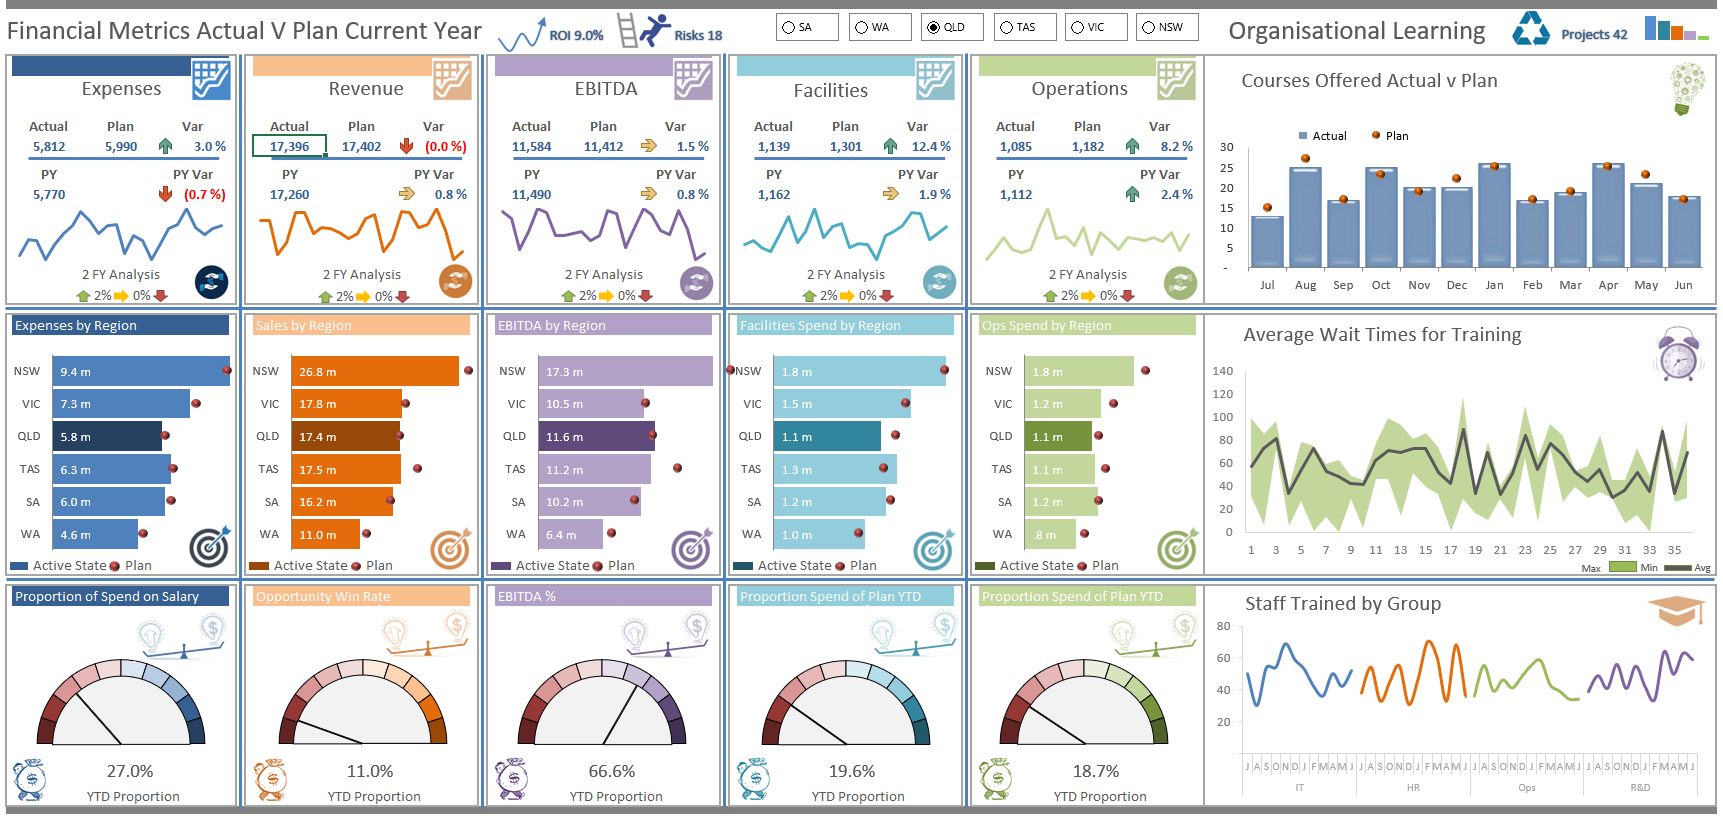
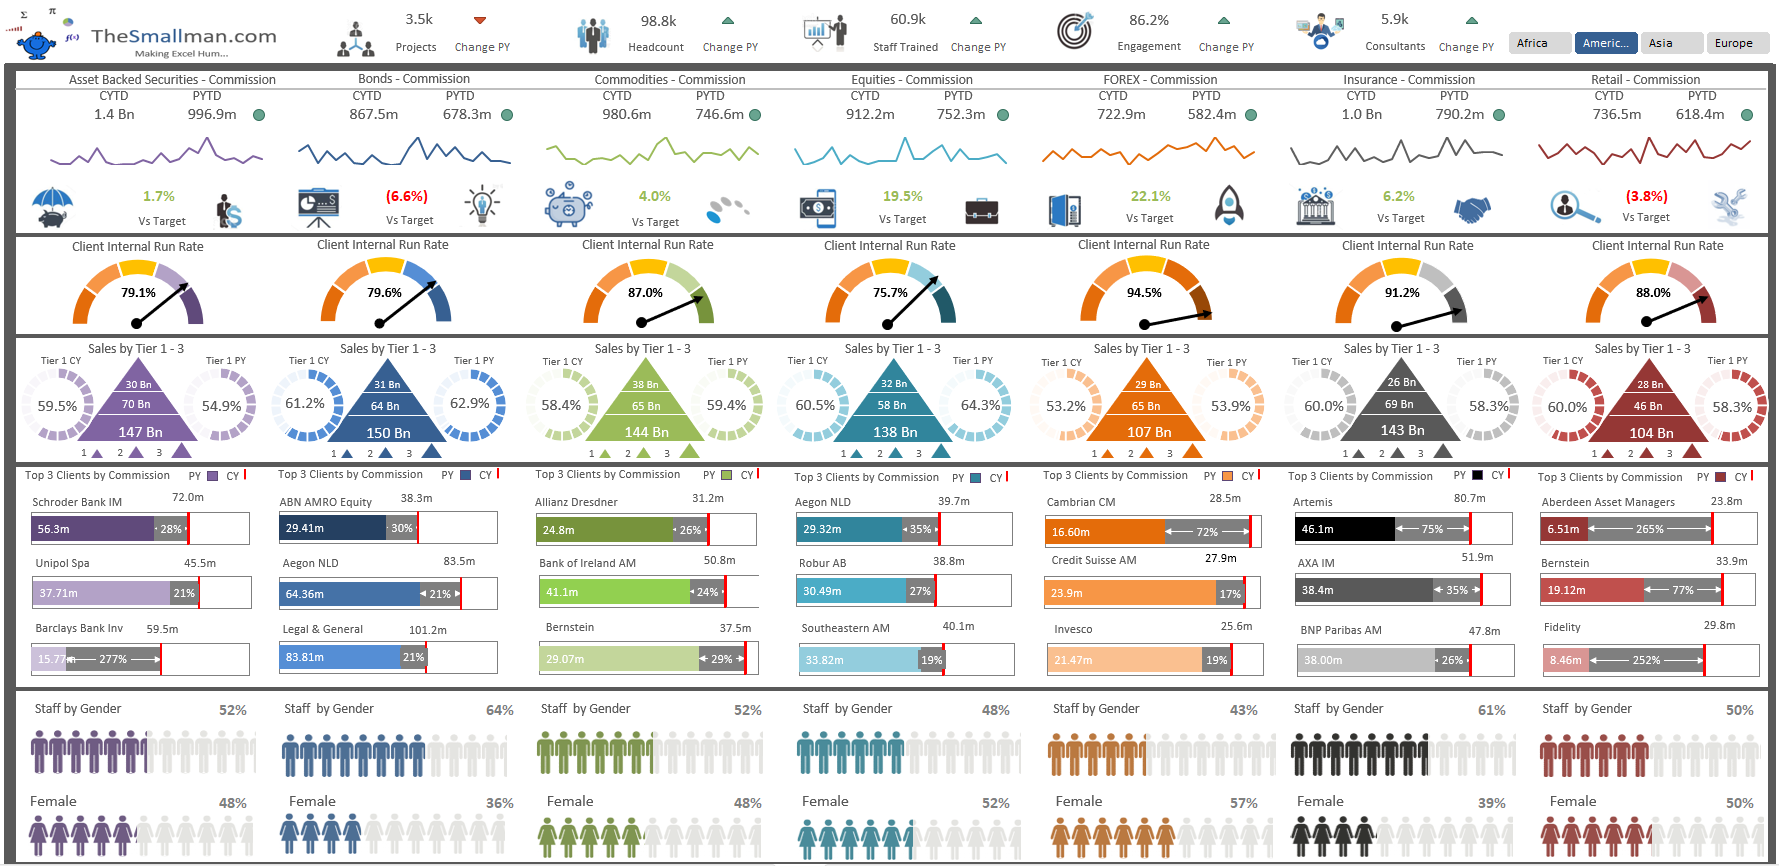
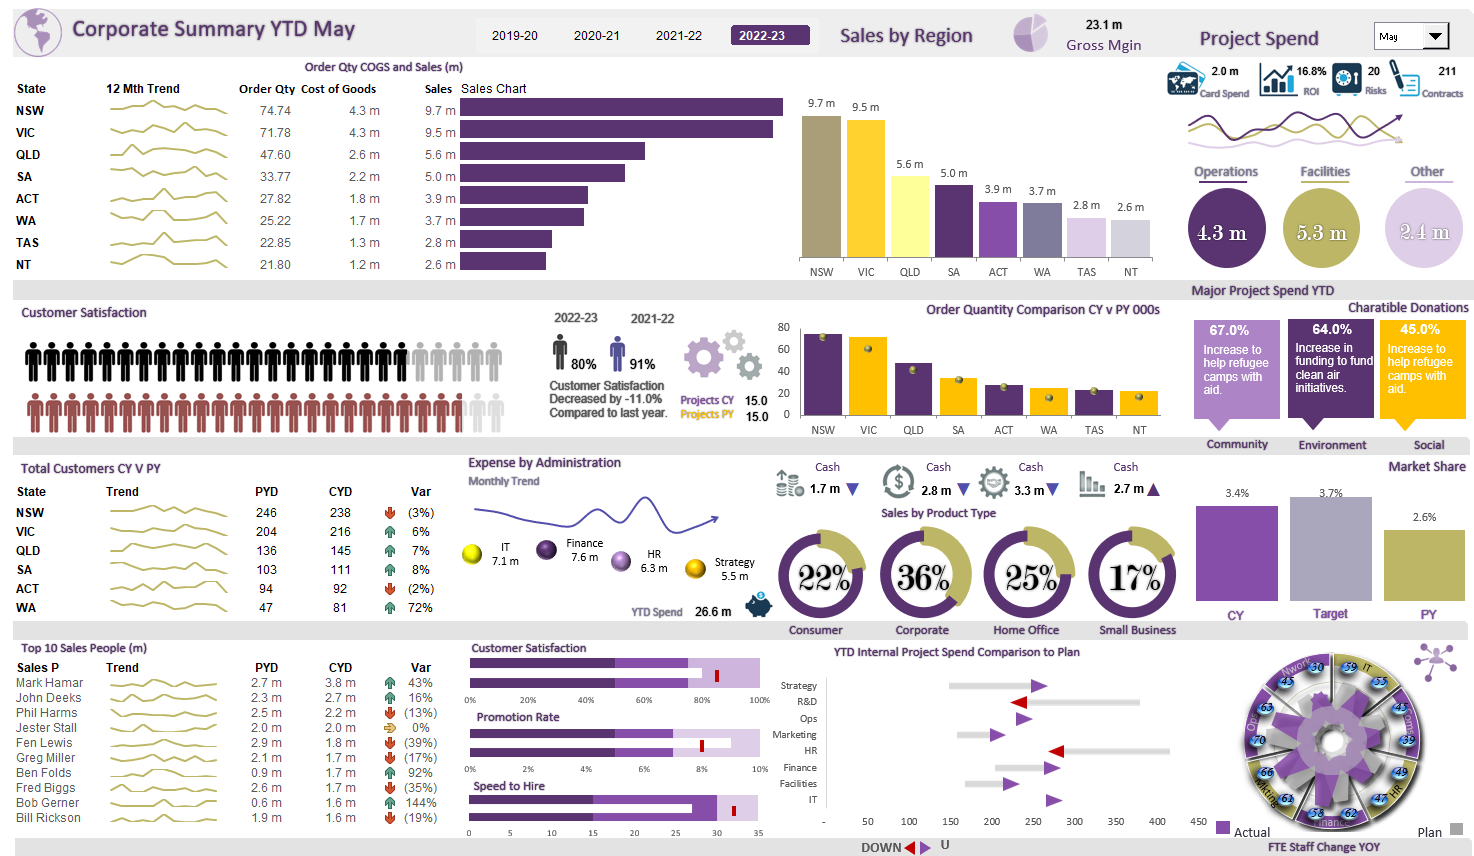
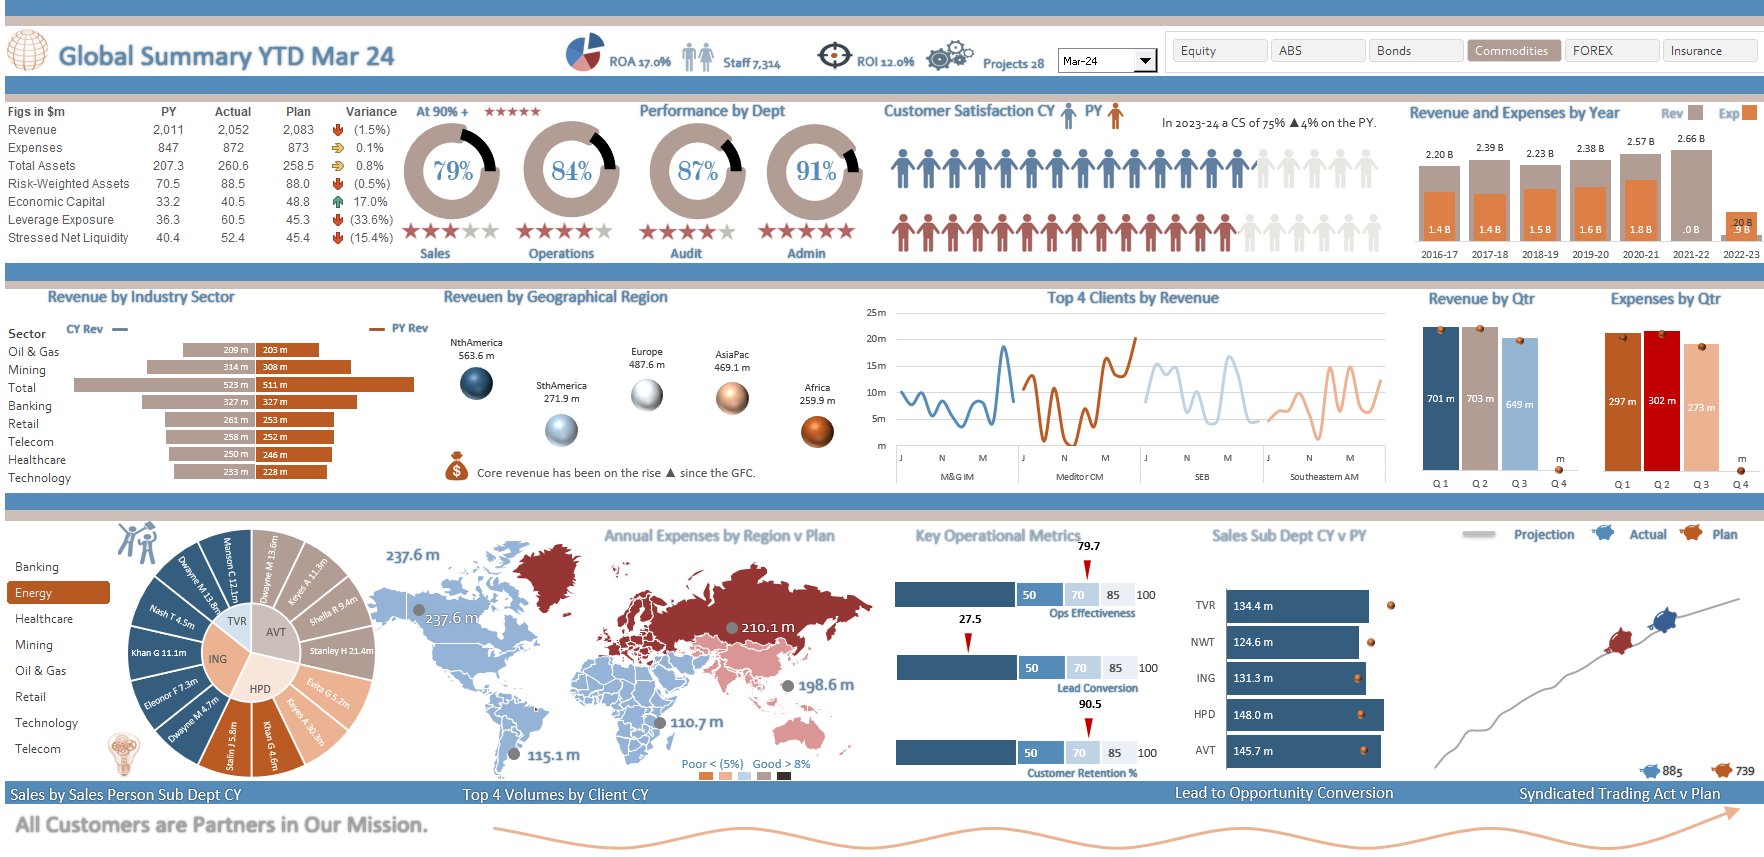
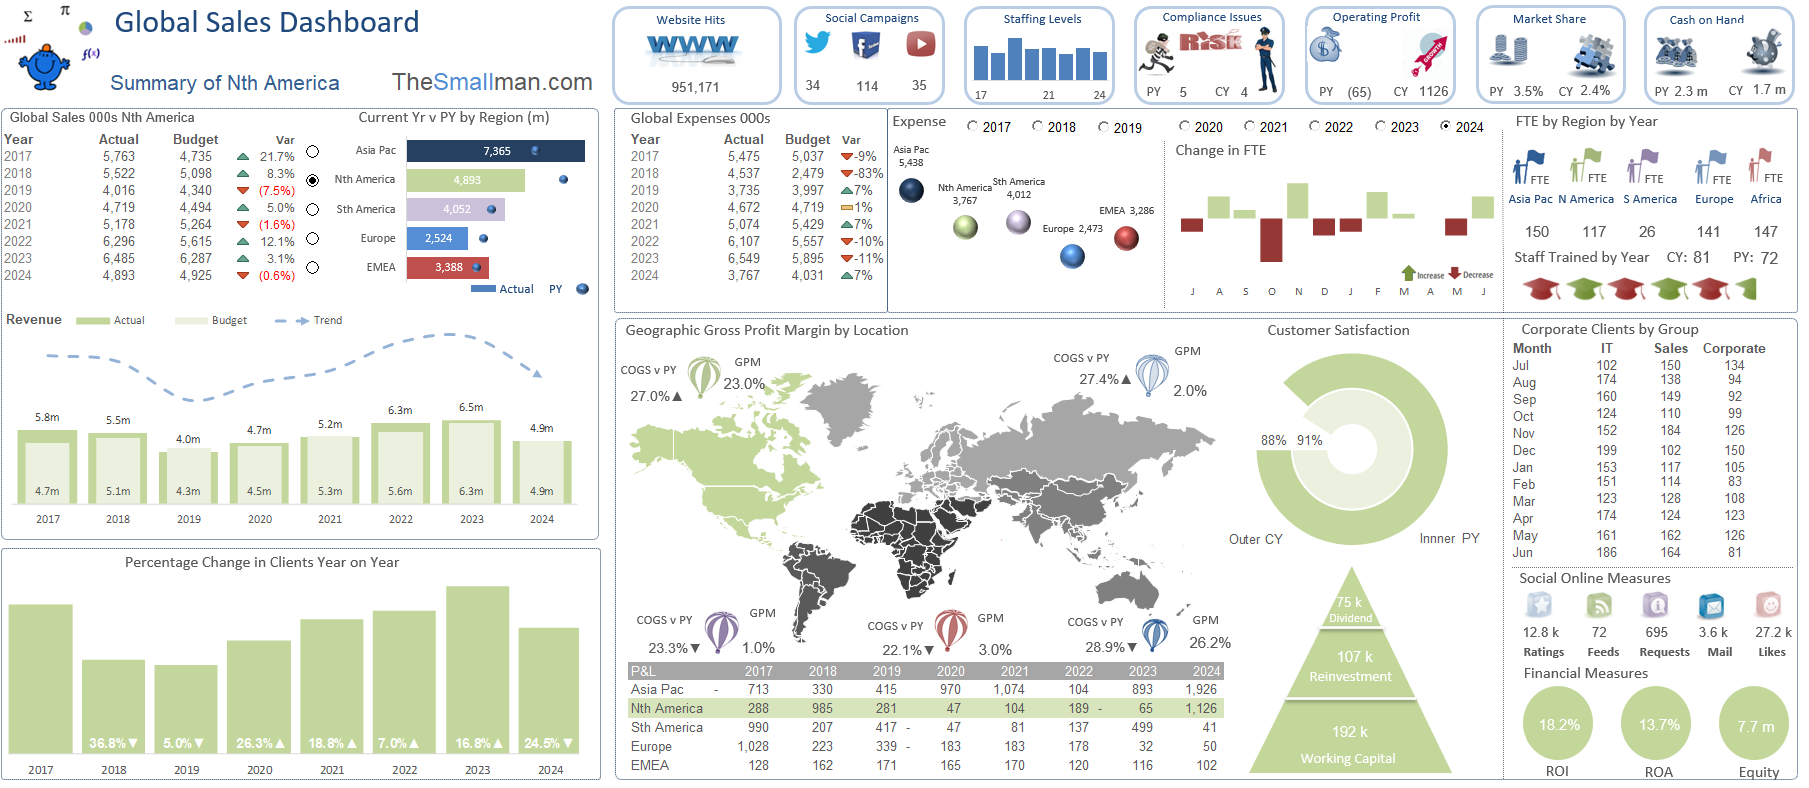
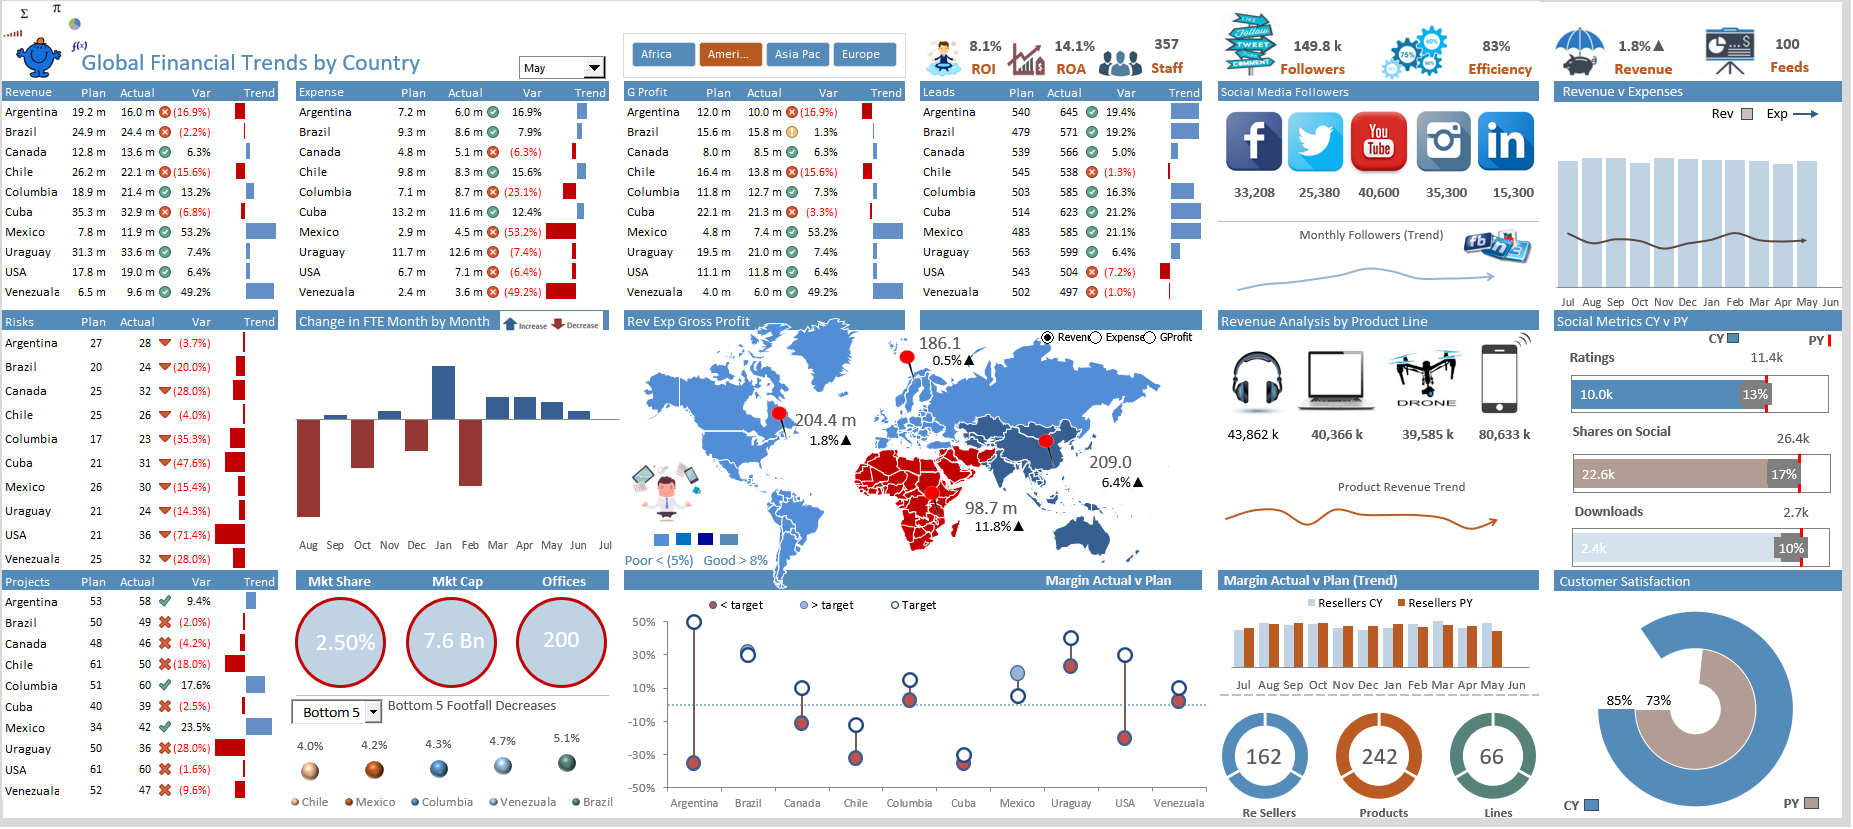
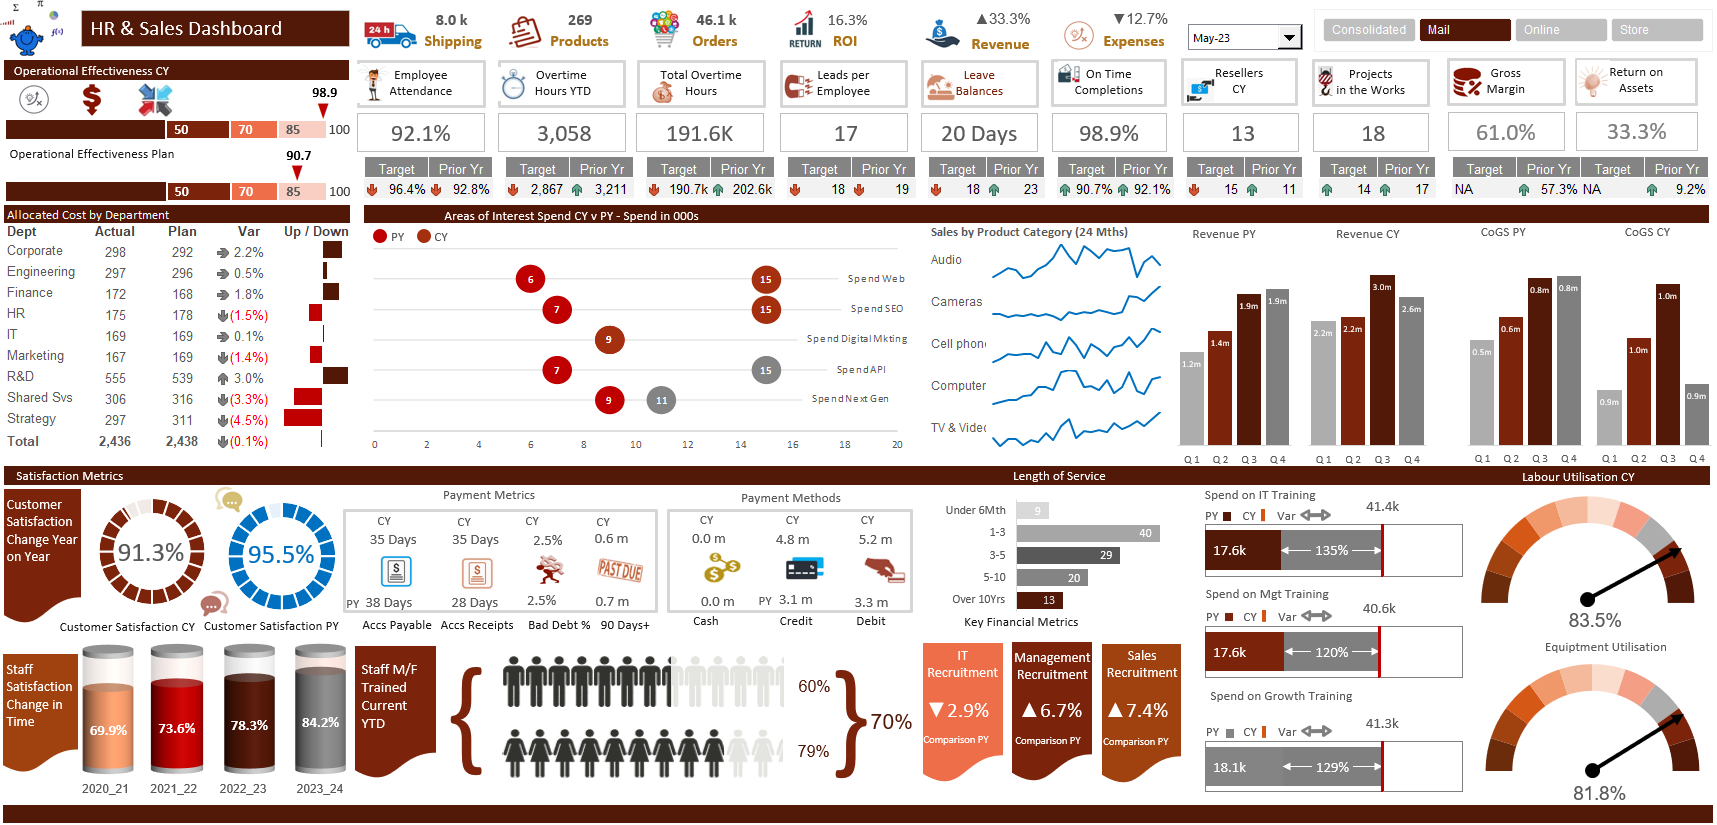
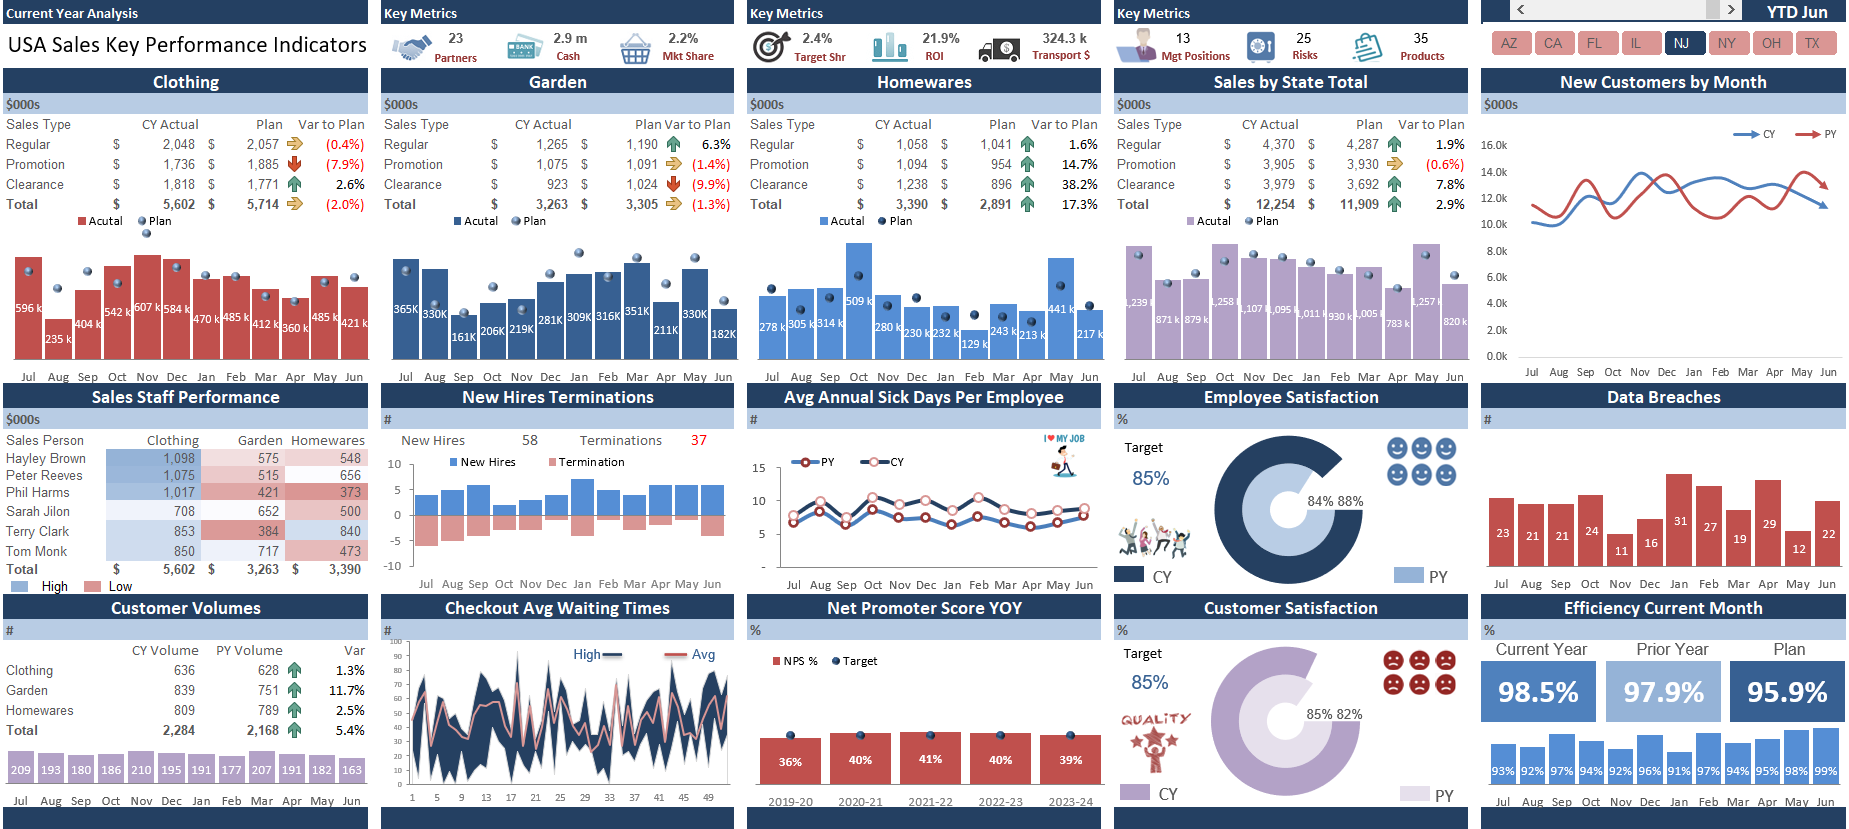
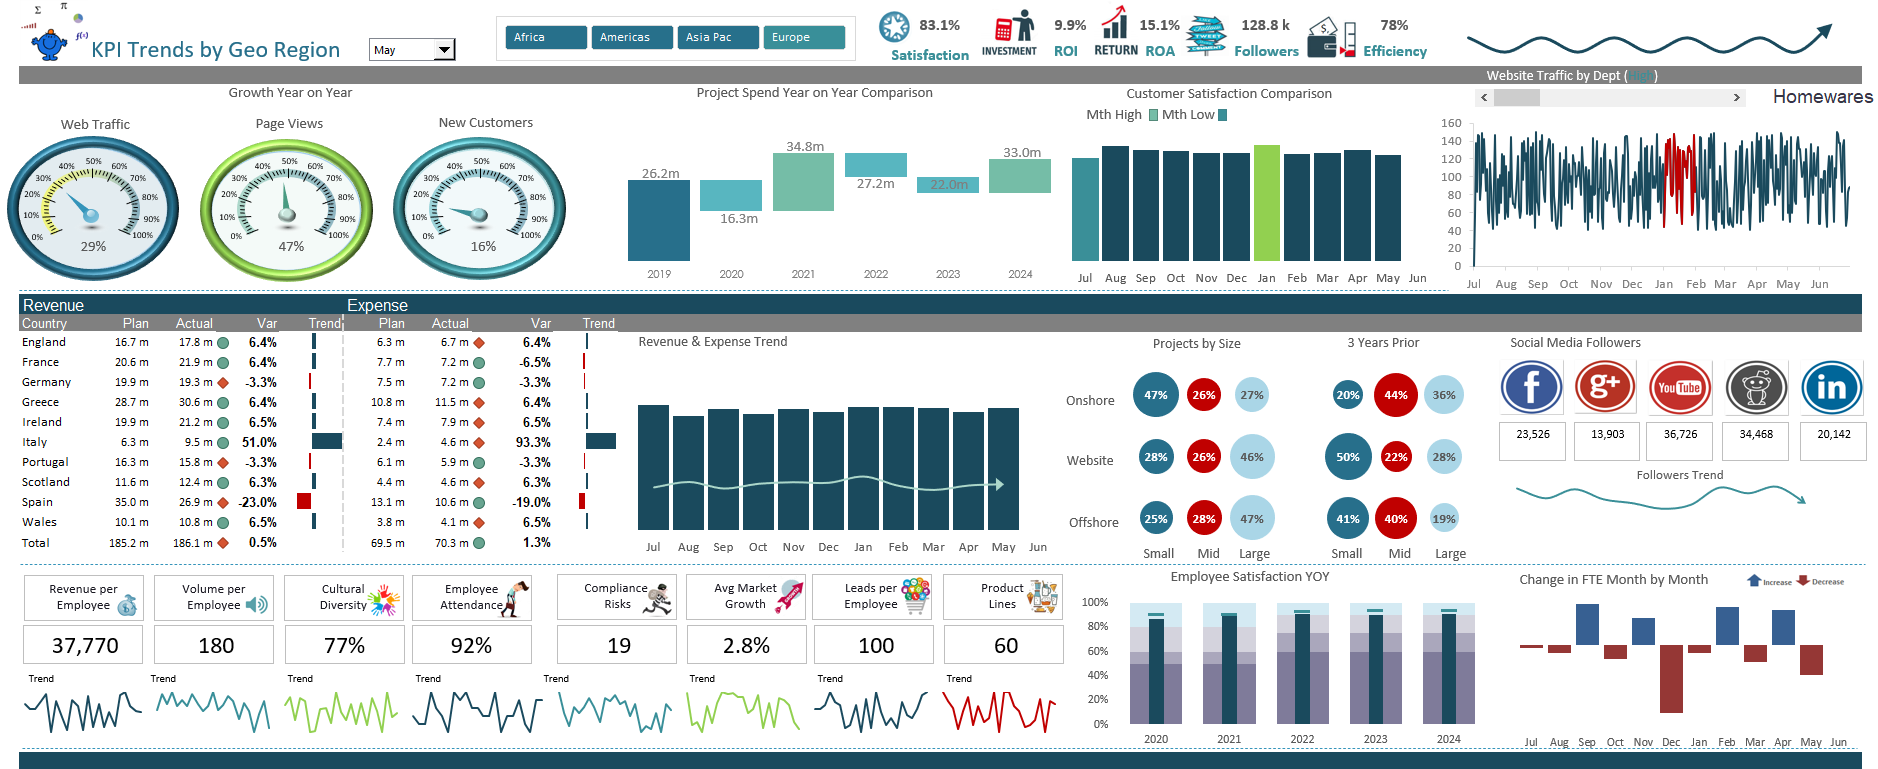
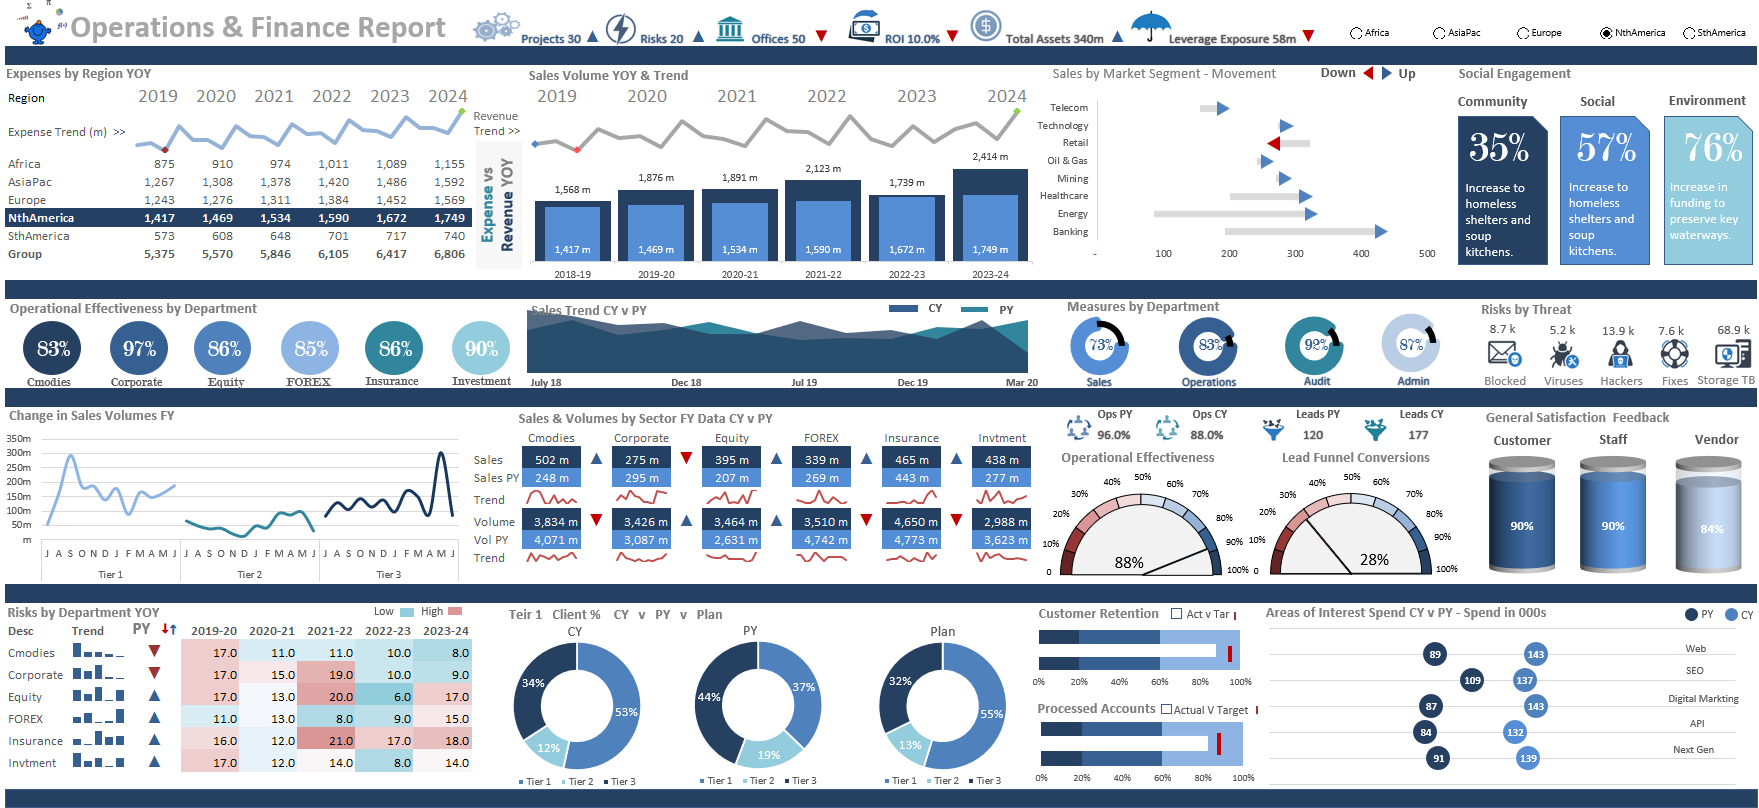
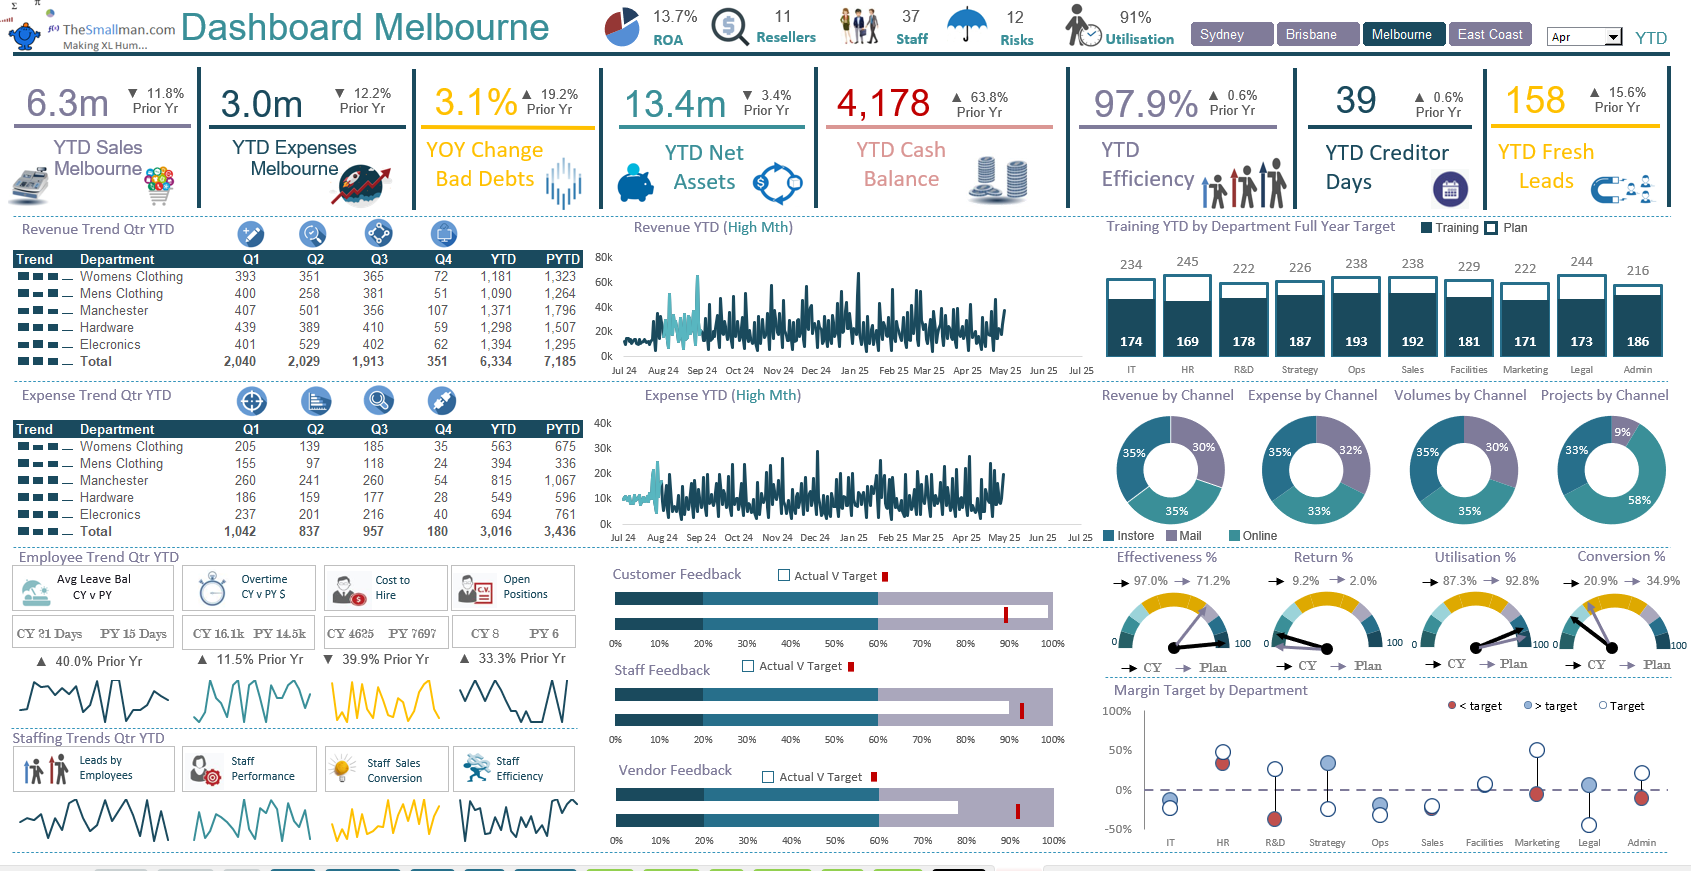
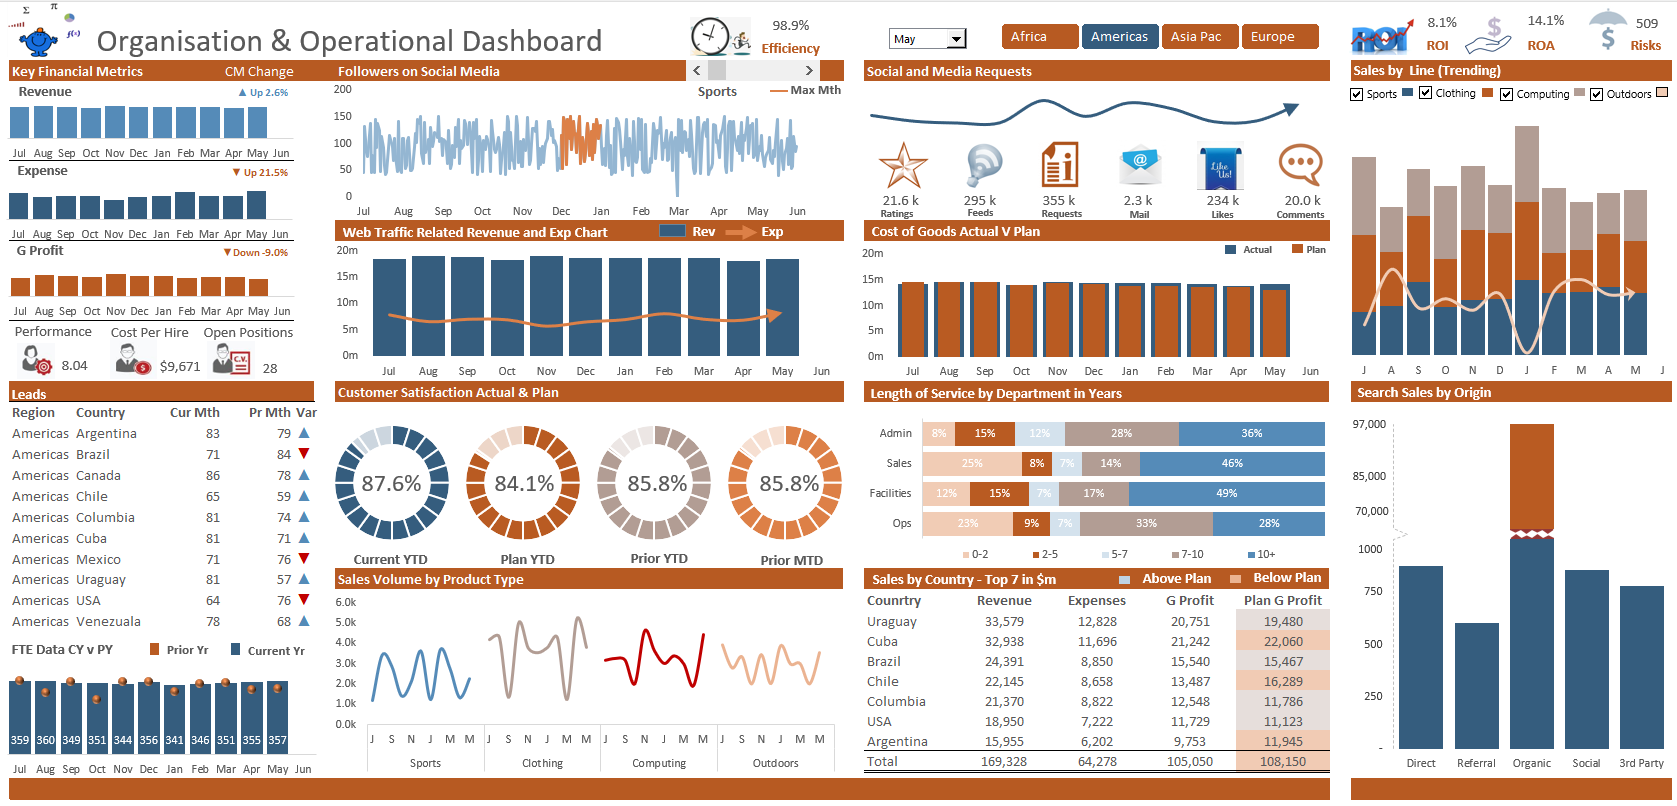
Premium Dashboard Models (the very best)
These premium Excel dashboards are ready to use. Create stunning visuals by adding your own data. That simple.
Further information
To provide ready to use Excel workbooks which only require the input of an individuals data-set. The structure, layout, formulas, charts and tables are inside the model. Users only need to add their data-sets.
These models are diverse enough to meet the reporting needs of a multitude of organisations. Simply apply your data and the dashboards will display your key performance metrics in the format presented.
