
Originally published: 06/09/2019 16:22
Publication number: ELQ-99861-1
View all versions & Certificate
Publication number: ELQ-99861-1
View all versions & Certificate

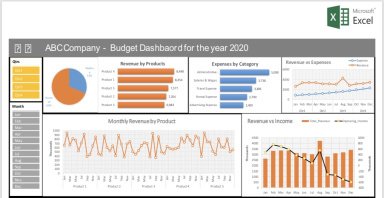
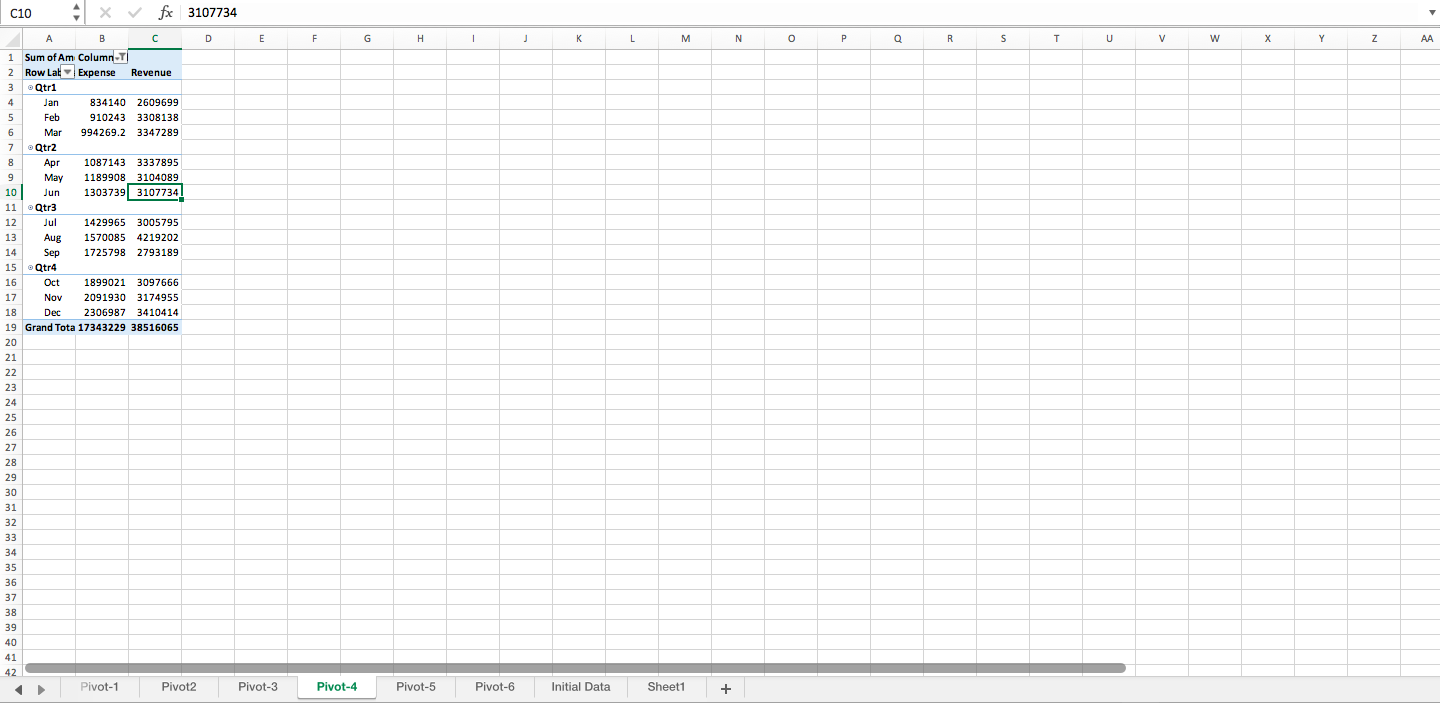
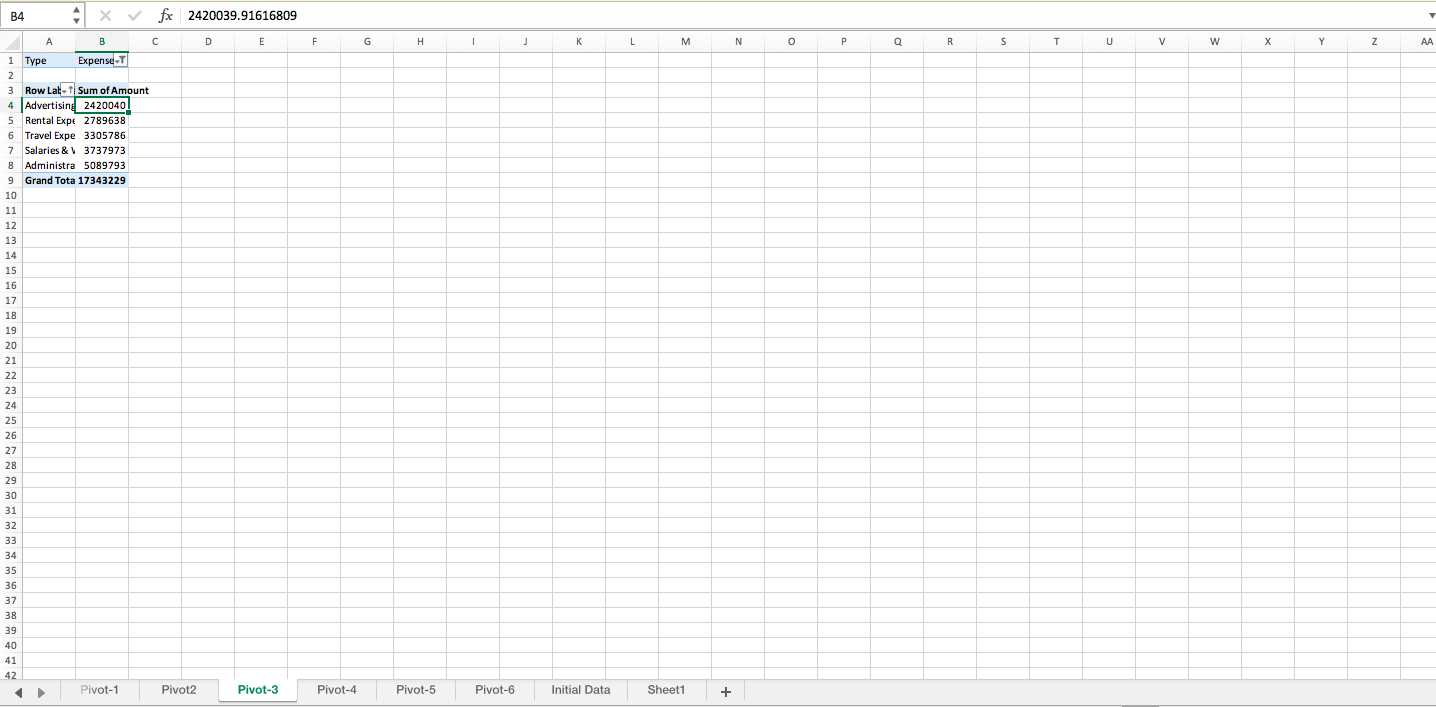
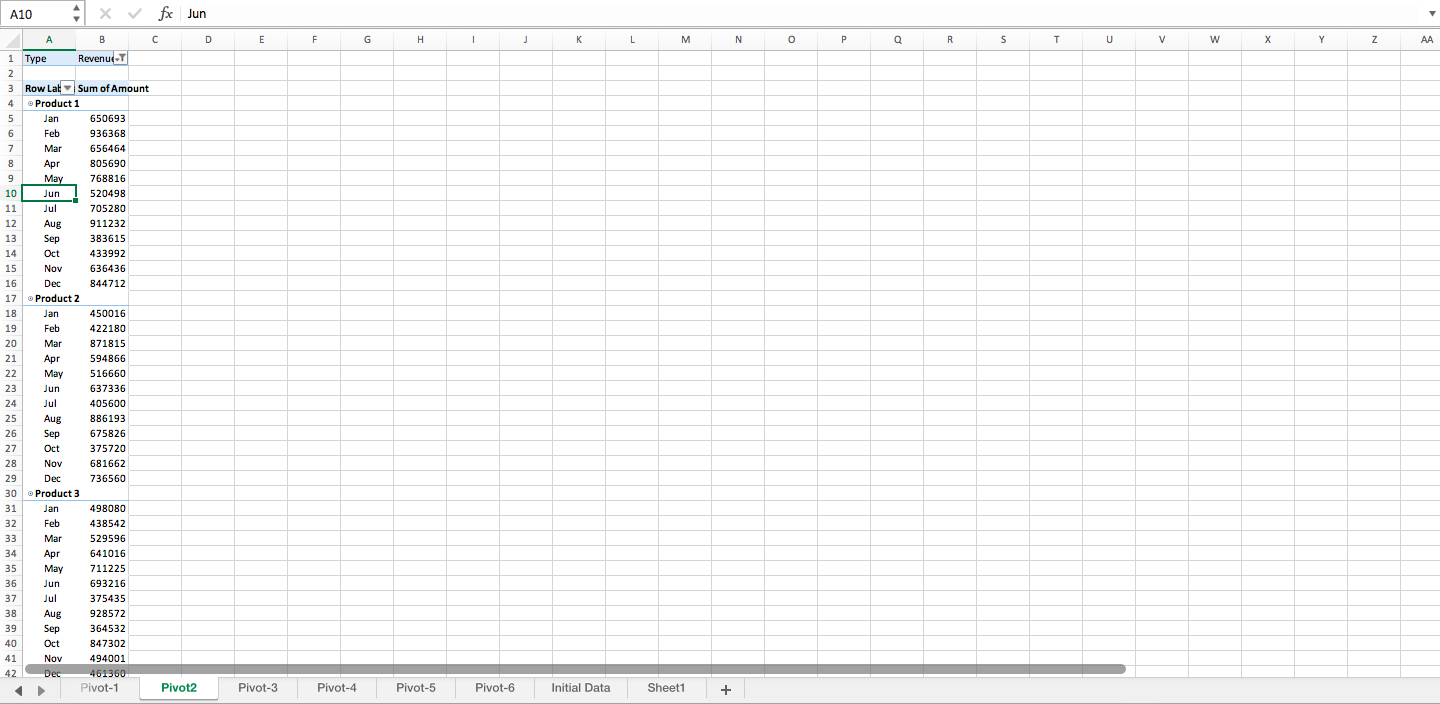
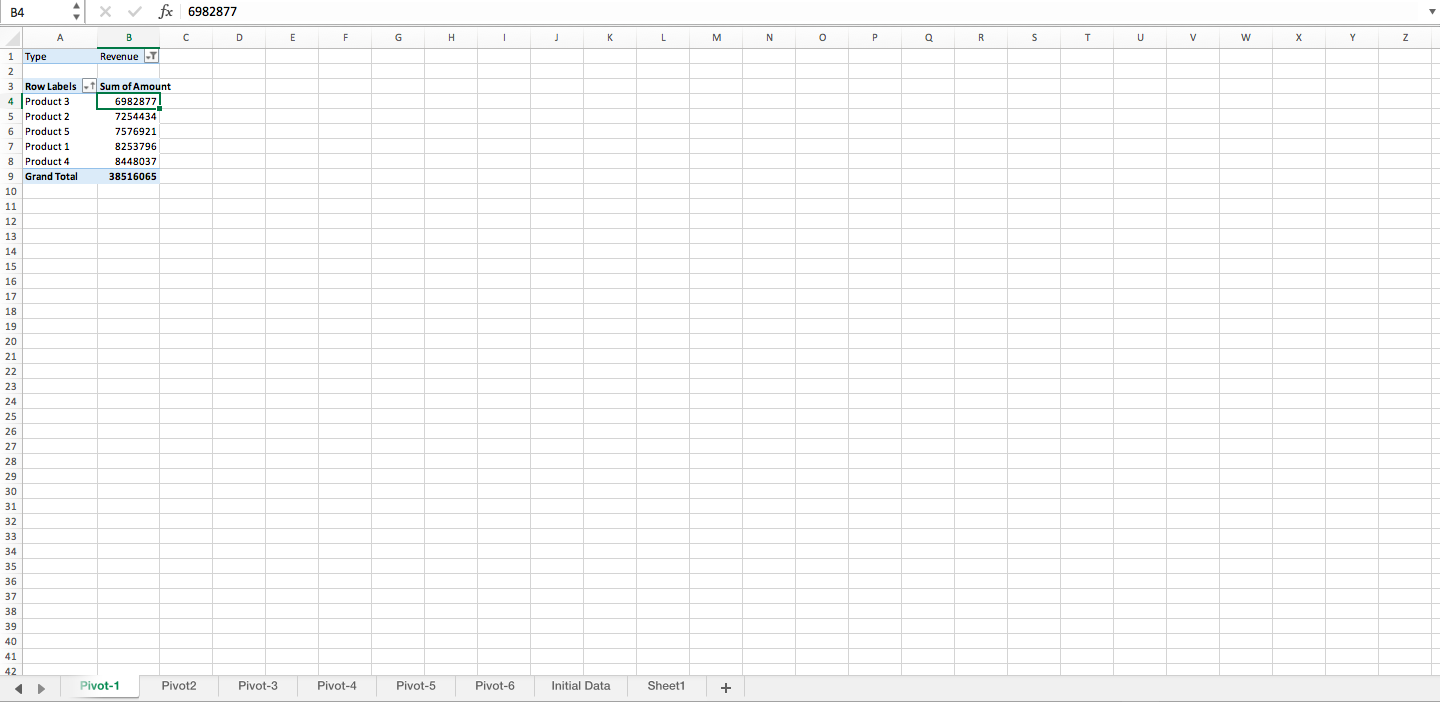
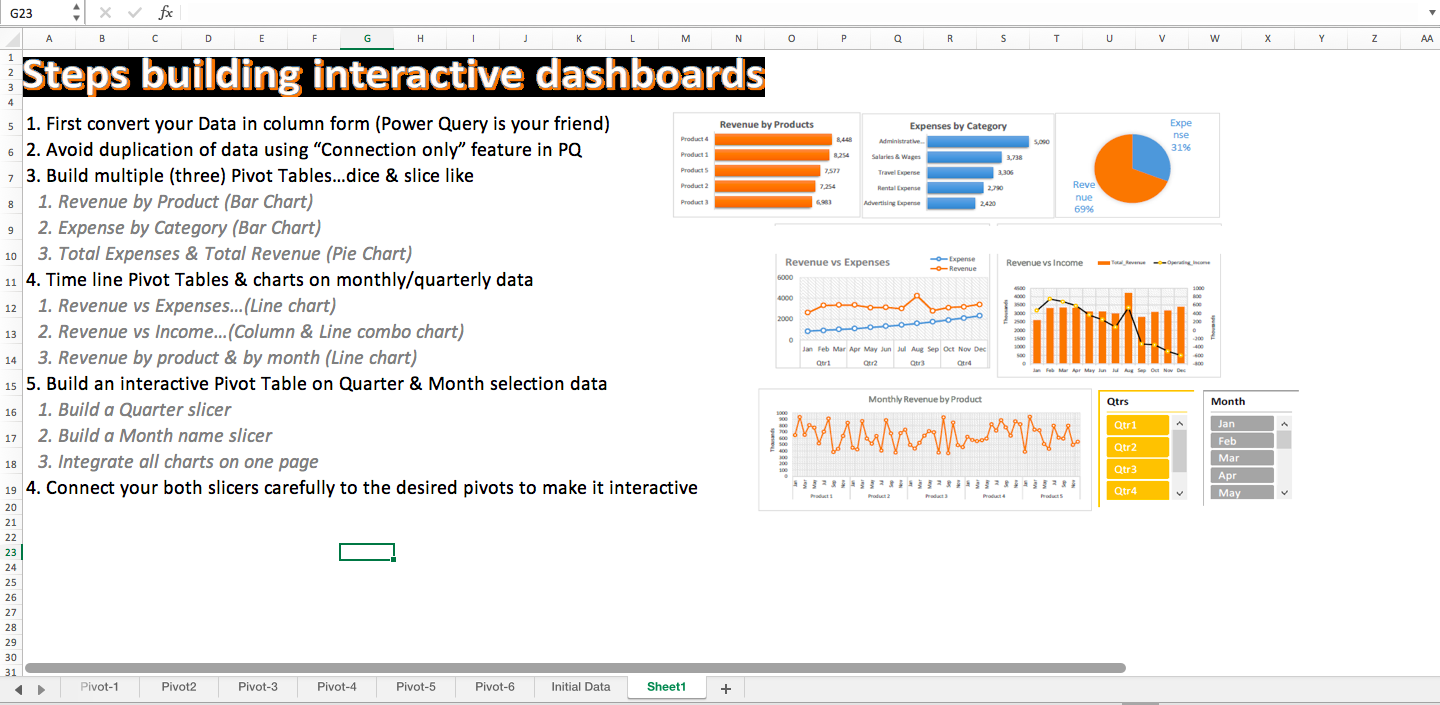
Dashboard for Budget Data (Updated Version)
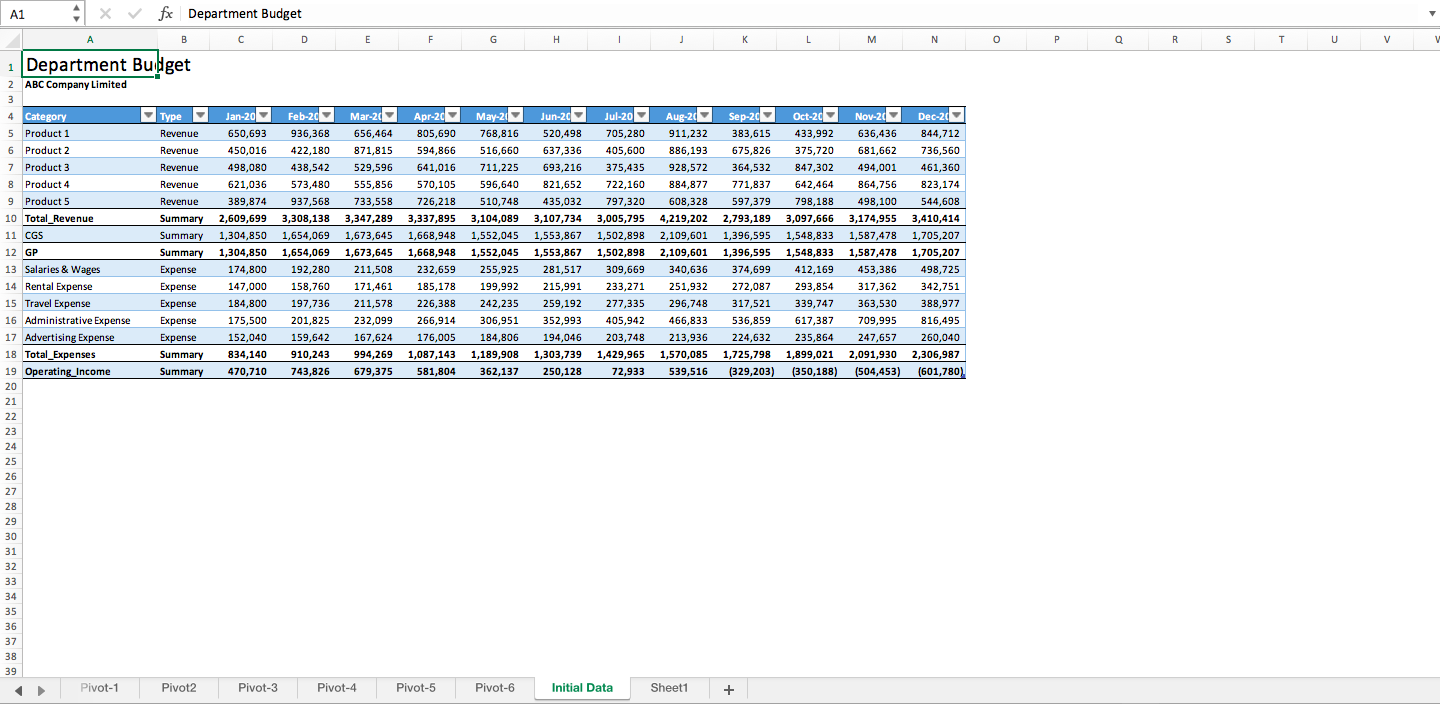
Detailed and extensive dashboard tool for monitoring and visualising your budgeting
Finance Manager│Financial Analyst│Financial Modeling |Oracle│ Power BI | DAX | Oil & Gas│Petrochemical Exp.│FMCG|TradingFollow 45
Asif Hafeez, CMA, MS, MBA, MOS offers you this Best Practice for free!
download for free
Add to bookmarks
