

Originally published: 31/05/2019 15:31
Last version published: 22/07/2019 07:31
Publication number: ELQ-73532-3
View all versions & Certificate
Last version published: 22/07/2019 07:31
Publication number: ELQ-73532-3
View all versions & Certificate

Steel Industry Financial Model Excel Template
This Model presents the case of the operation of a steel plant using the mini mill technology.
steelfinancial modelexcel model3 statement financial modeldiscounted cash flowsfree cash flows to the firmvaluationweighted average cost of capitalcost of equitycost of debt
Description
Steel Industry Financial Model presents the business case of the operation of a steel plant using the mini mill technology. The model generates the three financial statements as well as the cash flows and calculates the relevant metrics (Discounted Cash Flows, Free Cash Flows to the Firm, Equity Value, Enterprise Value, Sensitivity Analysis). The financing options for the project include standard bank loans and overdraft facilities (short term loans) and of course equity funding from investors.
So a quick overview of the model, in the contents tab you can see the structure of the model and by clicking on any of the headlines to be redirected to the relevant worksheet.
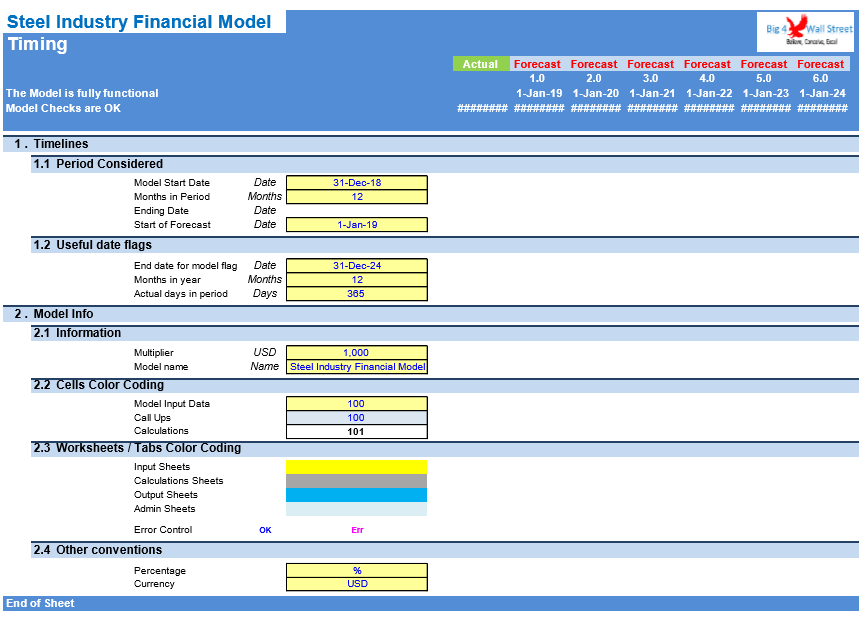
On the manual tab you are able to feed the general information for the model such as: project title, responsible, timeline of the model and date and currency conventions.
Additionally there is a description of the color coding of the model in the same tab. Inputs are always depicted with a yellow fill and blue letters, call apps (that is direct links from other cells) are filled in light blue with blue letters while calculations are depicted with white fill and black characters.
There is also a color coding for the various tabs of the model. Yellow tabs are mostly assumptions tabs, grey tabs are calculations tabs, blue tabs are outputs tabs (that is effectively results or graphs) and finally light blue tabs are admin tabs (for example: the cover page, contents and checks).
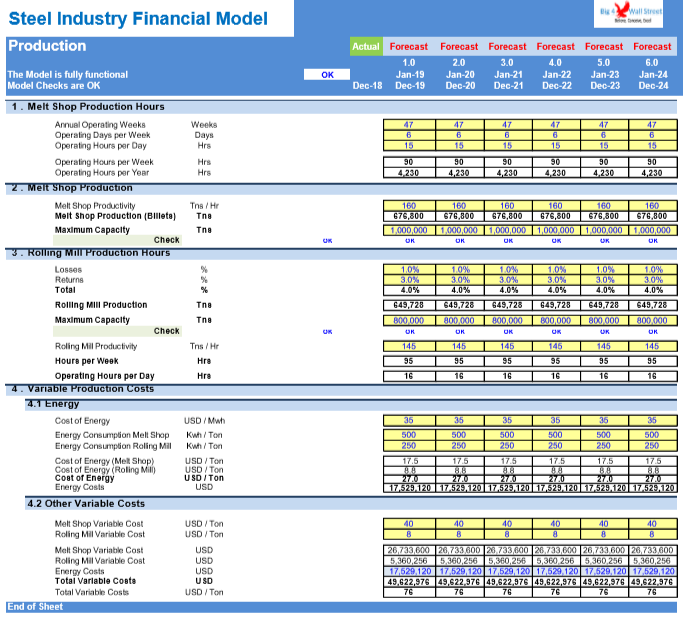
So moving on to the inputs we start with the production tab, in this tab we are able to assign inputs for the operating weeks during the year, the operating days per week and the operating hours per day. We will also be able to adjust the productivity of both the Melt Shop and the Rolling Mill. Additionally the losses and returns can be adjusted. The user can set the maximum capacity of both plant facilities.
Moving on the user can set the cost of energy as well as the energy consumption and additionally make assumptions regarding the variable costs of the Melt Shop and the Rolling Mill.
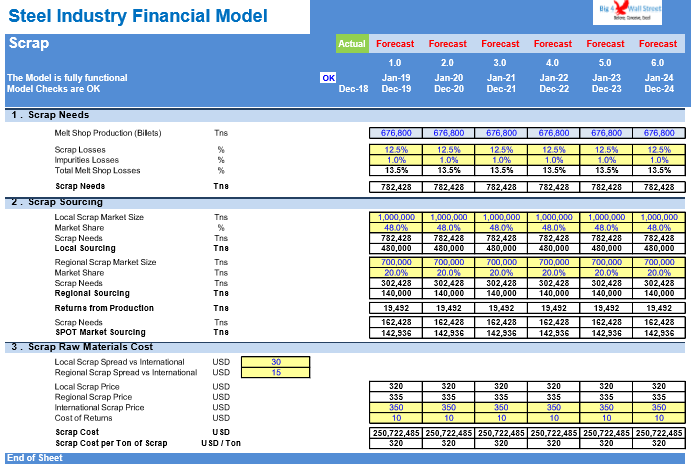
On the scrap tab the required billet materials have been called up. And the scrap needs have been calculated taking into account the scrap and the impurity losses.
The scrap sourcing can be fed from the local market, the regional Market and the spot Market. Additionally the user can adjust the scrap materials costs from these three sources.
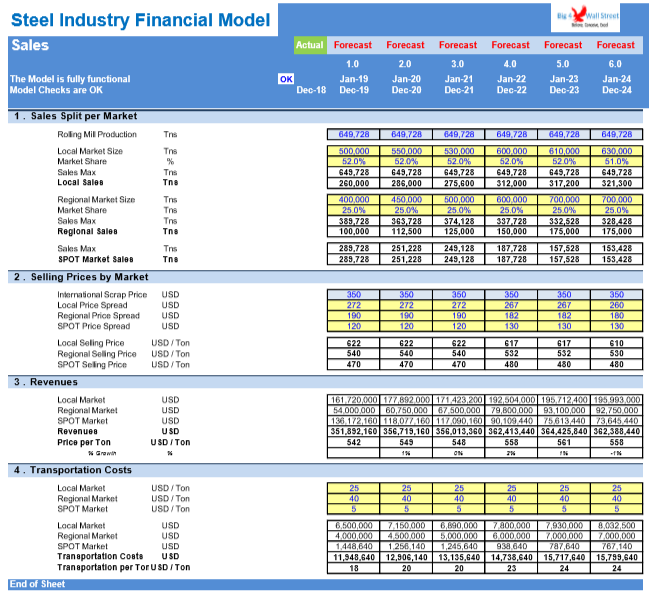
Based on the production and the market size of the local, Regional and International sales market, the user can Define the size of each market and their market share.
Furthermore the user is able to set the prices for each Market. The user can also set the various Transportation costs that are required in order to fulfil the final product sales.
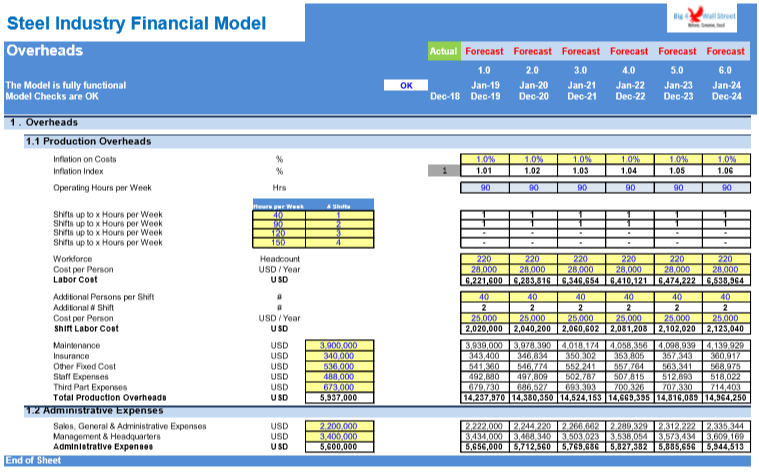
Moving on to the overheads tab the user will be able to set the maximum number of hours per week for each shift and the number of shifts required per operating hours per week. Additionally the user will be able to set the headcount of the workforce as well as the cost per person and the additional persons per shift. The various overheads can be set in this tab such as maintenance, Insurance, other fixed costs, staff expenses, and third party expenses. Of course the administrative expenses which consists of general and administrative expenses as well as the management and the headquarters expenses can also be adjusted.
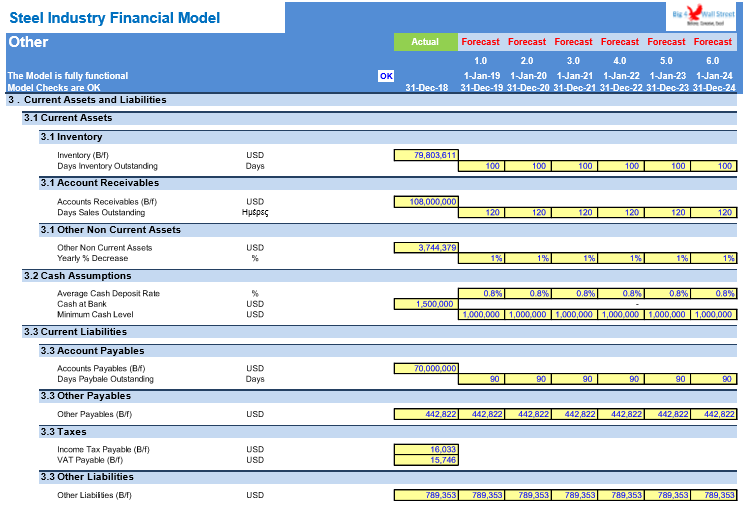
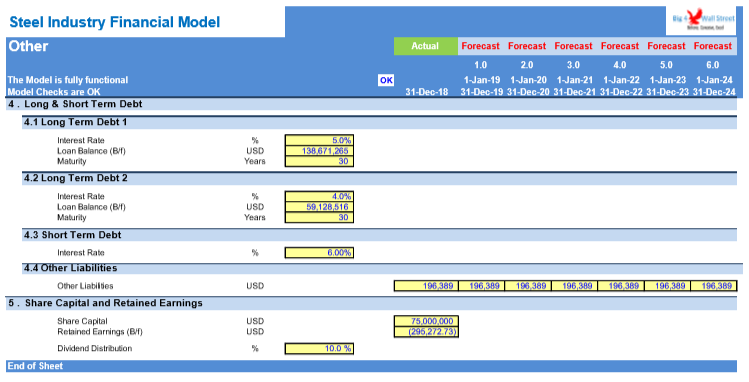
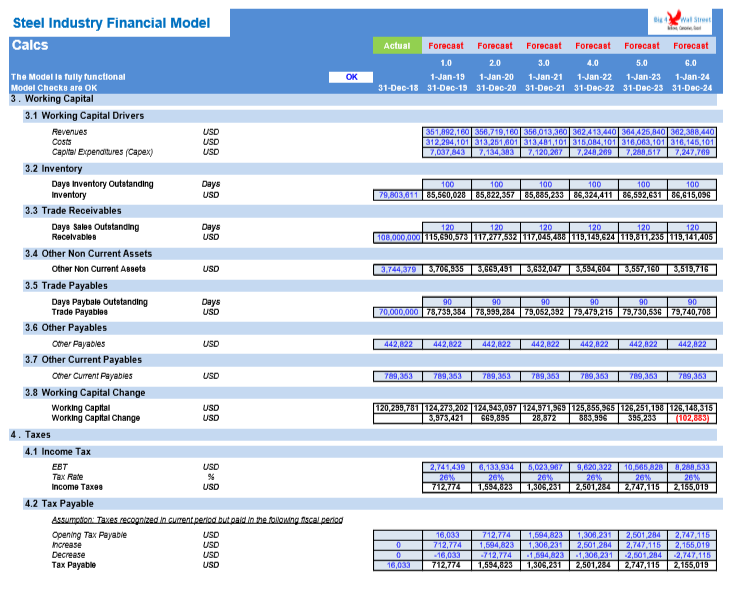
In the next tab all the other assumptions have been aggregated such as the tax rate, the depreciation assumptions, and the capital expenditures as well as the working capital, cash deposits, tax payable, financing like long-term and short-term debt. Finally the share capital, retained earnings and dividend distribution can be also adjusted in this tab.
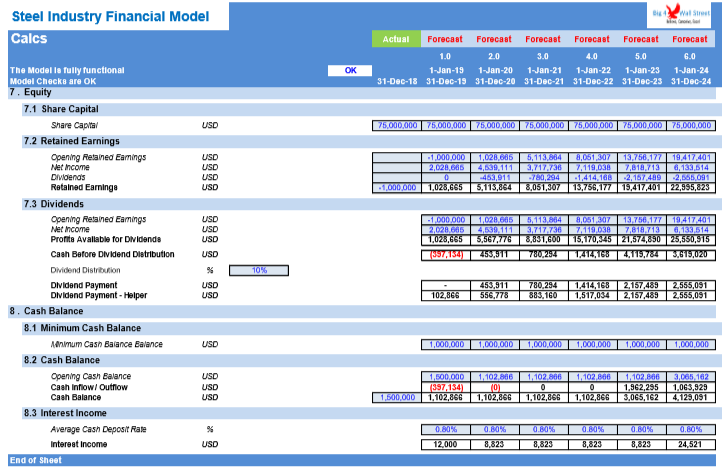
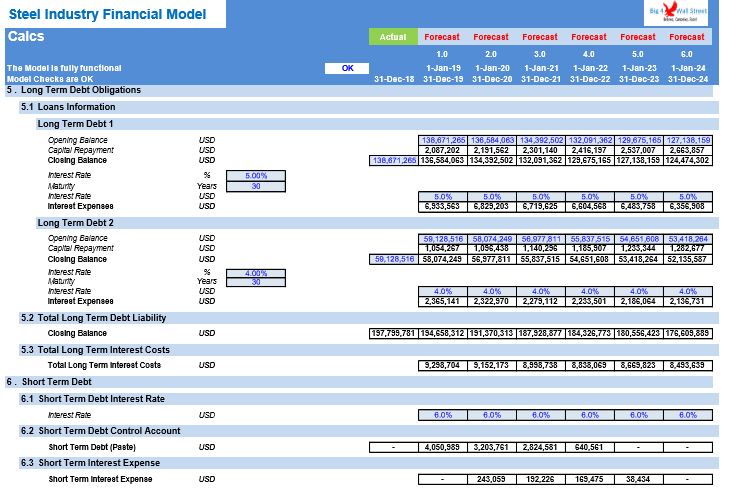
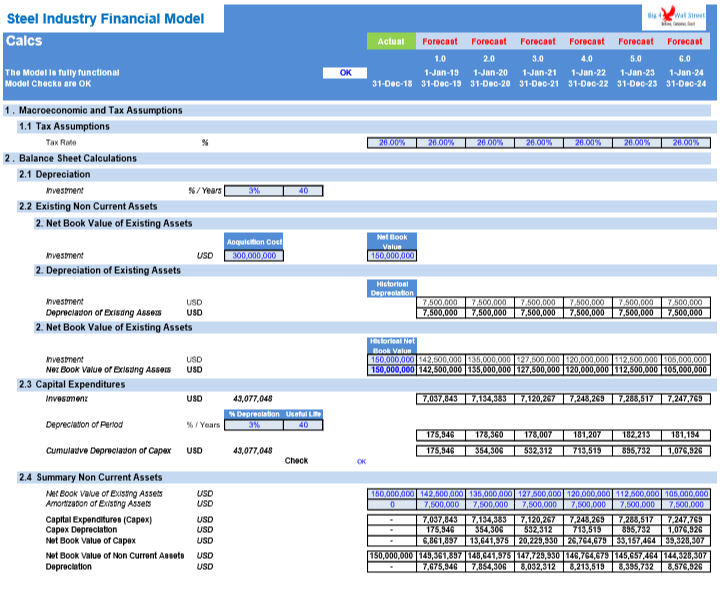
In the calculation tab all the calculations are performed in this tab so essentially Balance Sheet calculations such as Depreciation, Capital expenditures, working capital, taxes, long-term debt, short-term debt, dividends, and cash balance.
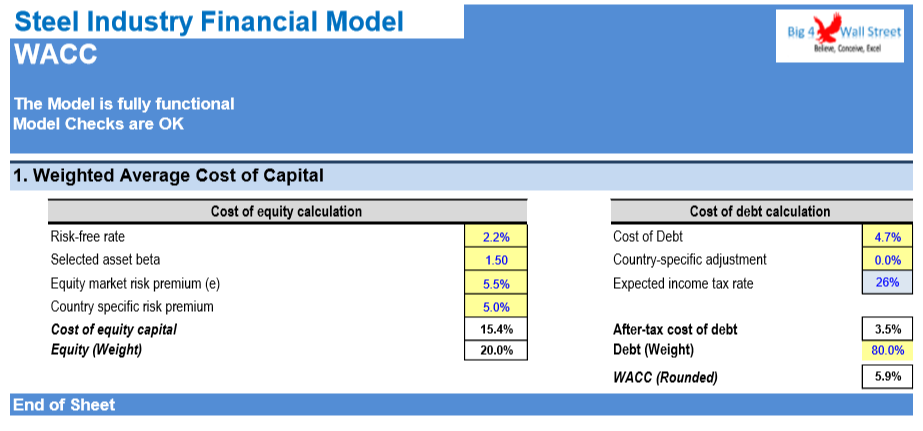
The weighted average cost of capital tab has the assumptions required to calculate the cost of equity and the cost of debt and by setting the level of the leverage the weighted average cost of capital is calculated.
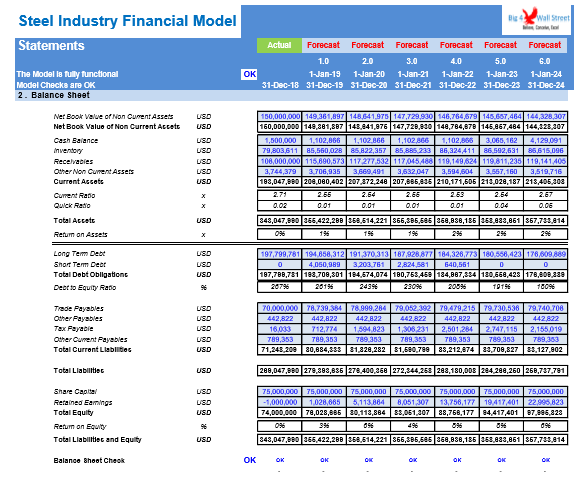
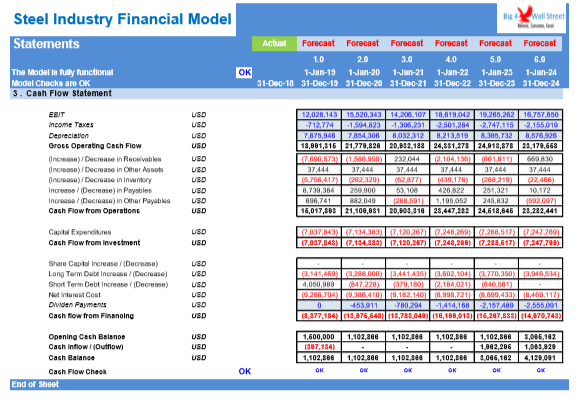
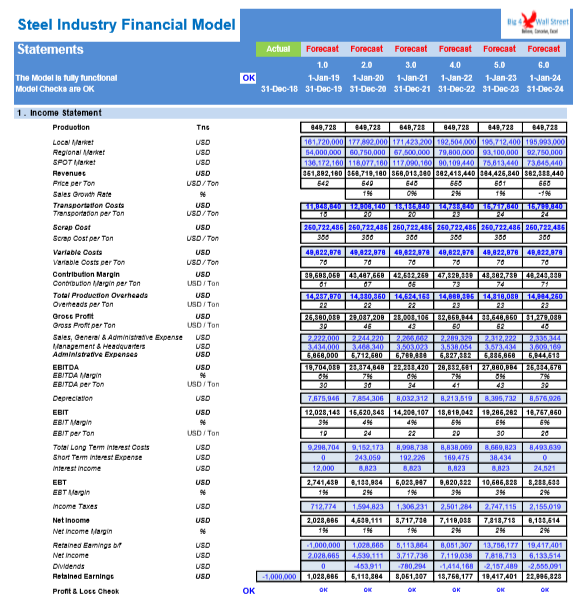
Moving on to the next tab, we are able to see all the resulting three financial statements such as income statement, balance sheet and the cash flow.
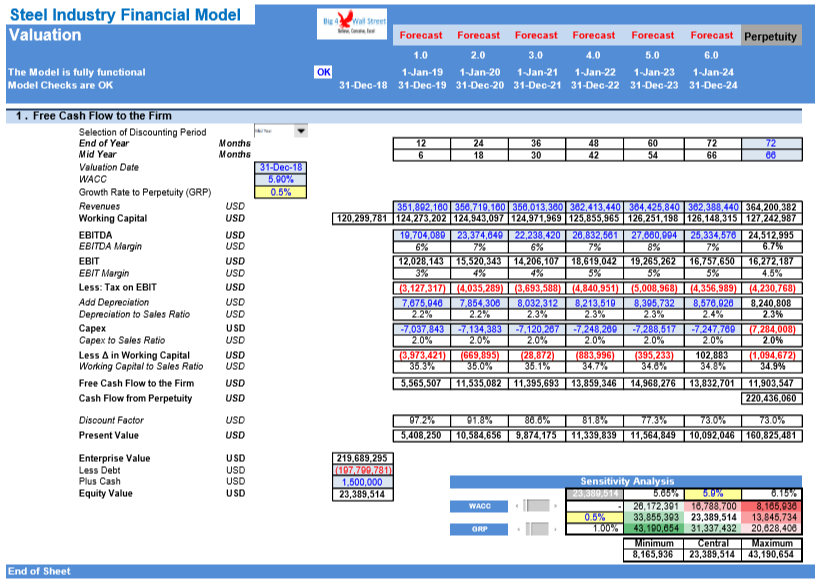
In the valuation tab a free cash flow to the firm is implemented and a valuation is performed. both Enterprise Value and Equity Value are calculated. Additionally a sensitivity table will allow you to play with the discount rate and the growth rate to perpetuity and see the impact on the equity value of the business.
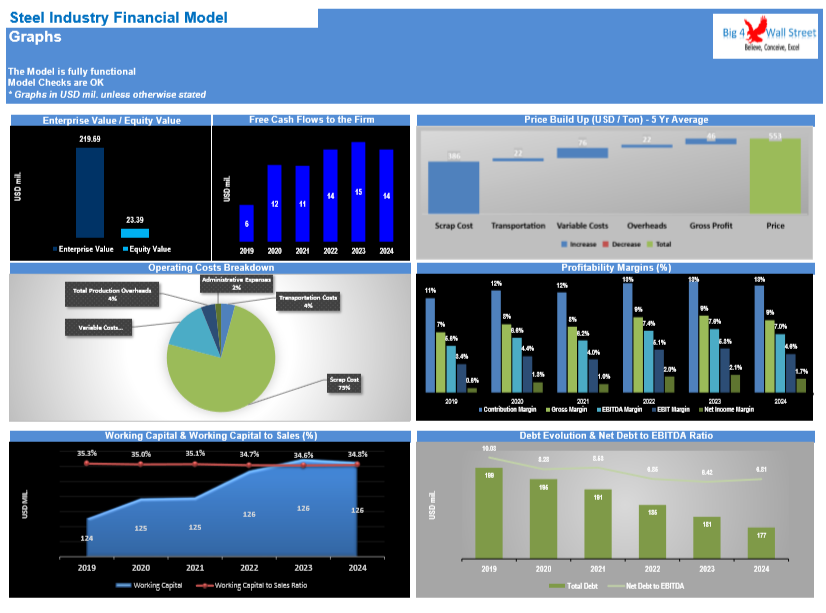
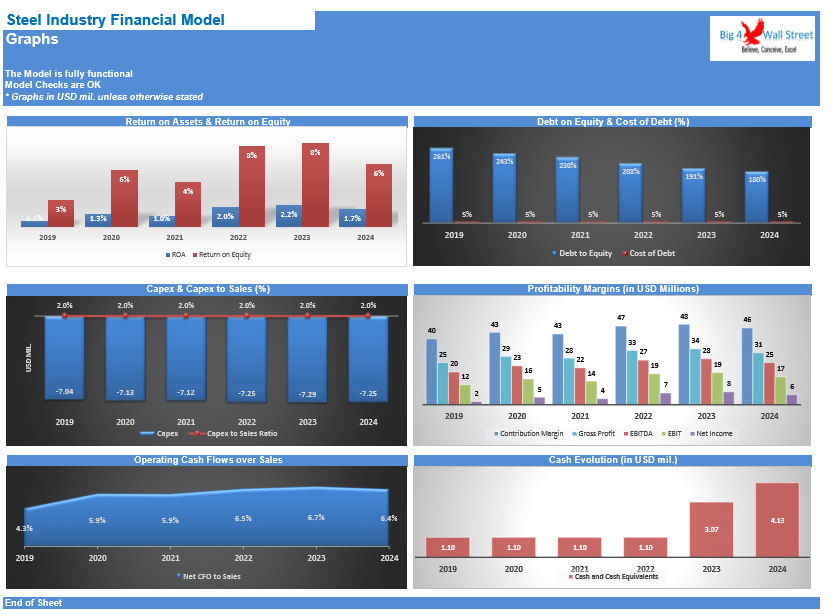
Finally we have a set of graphs that summarize all the major KPIs of the business, so we start from the free cash flows, the valuation of the company, price build up, operating costs, profitability margins, working capital, debt evolution, the return on assets and on equity, Debt on Equity ratio and cost of debt, capex and capex to sales, operating cash flows over sales, and cash evolution,
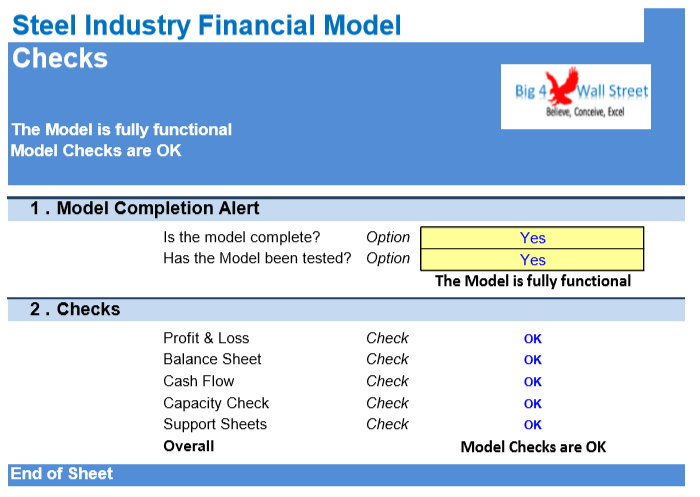
Finally in the last tab, various checks are performed and, or are aggregated here from the various worksheets. This tab ensures that everything in this model is working as it should.
Steel Industry Financial Model presents the business case of the operation of a steel plant using the mini mill technology. The model generates the three financial statements as well as the cash flows and calculates the relevant metrics (Discounted Cash Flows, Free Cash Flows to the Firm, Equity Value, Enterprise Value, Sensitivity Analysis). The financing options for the project include standard bank loans and overdraft facilities (short term loans) and of course equity funding from investors.
So a quick overview of the model, in the contents tab you can see the structure of the model and by clicking on any of the headlines to be redirected to the relevant worksheet.
On the manual tab you are able to feed the general information for the model such as: project title, responsible, timeline of the model and date and currency conventions.
Additionally there is a description of the color coding of the model in the same tab. Inputs are always depicted with a yellow fill and blue letters, call apps (that is direct links from other cells) are filled in light blue with blue letters while calculations are depicted with white fill and black characters.
There is also a color coding for the various tabs of the model. Yellow tabs are mostly assumptions tabs, grey tabs are calculations tabs, blue tabs are outputs tabs (that is effectively results or graphs) and finally light blue tabs are admin tabs (for example: the cover page, contents and checks).
So moving on to the inputs we start with the production tab, in this tab we are able to assign inputs for the operating weeks during the year, the operating days per week and the operating hours per day. We will also be able to adjust the productivity of both the Melt Shop and the Rolling Mill. Additionally the losses and returns can be adjusted. The user can set the maximum capacity of both plant facilities.
Moving on the user can set the cost of energy as well as the energy consumption and additionally make assumptions regarding the variable costs of the Melt Shop and the Rolling Mill.
On the scrap tab the required billet materials have been called up. And the scrap needs have been calculated taking into account the scrap and the impurity losses.
The scrap sourcing can be fed from the local market, the regional Market and the spot Market. Additionally the user can adjust the scrap materials costs from these three sources.
Based on the production and the market size of the local, Regional and International sales market, the user can Define the size of each market and their market share.
Furthermore the user is able to set the prices for each Market. The user can also set the various Transportation costs that are required in order to fulfil the final product sales.
Moving on to the overheads tab the user will be able to set the maximum number of hours per week for each shift and the number of shifts required per operating hours per week. Additionally the user will be able to set the headcount of the workforce as well as the cost per person and the additional persons per shift. The various overheads can be set in this tab such as maintenance, Insurance, other fixed costs, staff expenses, and third party expenses. Of course the administrative expenses which consists of general and administrative expenses as well as the management and the headquarters expenses can also be adjusted.
In the next tab all the other assumptions have been aggregated such as the tax rate, the depreciation assumptions, and the capital expenditures as well as the working capital, cash deposits, tax payable, financing like long-term and short-term debt. Finally the share capital, retained earnings and dividend distribution can be also adjusted in this tab.
In the calculation tab all the calculations are performed in this tab so essentially Balance Sheet calculations such as Depreciation, Capital expenditures, working capital, taxes, long-term debt, short-term debt, dividends, and cash balance.
The weighted average cost of capital tab has the assumptions required to calculate the cost of equity and the cost of debt and by setting the level of the leverage the weighted average cost of capital is calculated.
Moving on to the next tab, we are able to see all the resulting three financial statements such as income statement, balance sheet and the cash flow.
In the valuation tab a free cash flow to the firm is implemented and a valuation is performed. both Enterprise Value and Equity Value are calculated. Additionally a sensitivity table will allow you to play with the discount rate and the growth rate to perpetuity and see the impact on the equity value of the business.
Finally we have a set of graphs that summarize all the major KPIs of the business, so we start from the free cash flows, the valuation of the company, price build up, operating costs, profitability margins, working capital, debt evolution, the return on assets and on equity, Debt on Equity ratio and cost of debt, capex and capex to sales, operating cash flows over sales, and cash evolution,
Finally in the last tab, various checks are performed and, or are aggregated here from the various worksheets. This tab ensures that everything in this model is working as it should.
This Best Practice includes
1 Excel and 1 PDF
