Originally published: 23/11/2021 08:44
Last version published: 07/02/2022 15:31
Publication number: ELQ-22568-2
View all versions & Certificate
Last version published: 07/02/2022 15:31
Publication number: ELQ-22568-2
View all versions & Certificate

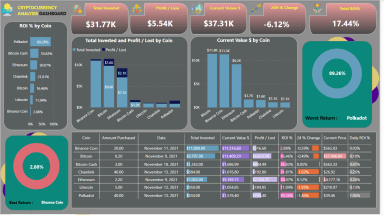
Power BI Cryptocurrency Investment Tracking /Cryptocurrency Live Analysis Dashboard/Cryptocurrency Portfolio Dashboard
This is Power BI Cryptocurrency Investment Tracking /Cryptocurrency Live Analysis Dashboard/Cryptocurrency Portfolio Dashboard .
BI Analyst | Power BI Reporting | Data Analyst | Data Visualization Expert | Power Automation | SQLFollow 49
Further information
You can use this report for your real time crypto investment analysis or learning purposes or entering into a competition or commercial use.
