Originally published: 30/11/2020 09:11
Publication number: ELQ-55929-1
View all versions & Certificate
Publication number: ELQ-55929-1
View all versions & Certificate

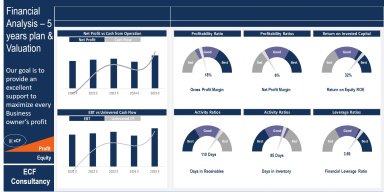
Financial Analysis - 5 Years Plan & Valuation
The main idea of the model is to provide professional and successful financial presentation
advances financial statementhorizontal analysisvertical analysisvariance analysisfinancial projectionratiosexecutive financial summaryvaluationirrnpv
Description
General overview
The main idea of the model is to provide professional and successful financial presentation for the management showing vertical and horizontal analysis, comparison vs last year and budget, financial performance, financial summary, 5 years plan and valuation
This information is the business intelligence decision makers use for determining future business decisions, and to make changes to steer your company towards more profitability and efficiency,
The model provides an extensive financial analysis comparison and has designed to be useful tools for beginners and advanced financial professionals.
Very simple to use, the user only needs to fill the green cells in the green tabs and the outputs in the blue tabs are updated instantly
In the contents sheet you can see the structure of the model and by clicking on any of the headlines will automatically redirected to the relevant sheet
Key inputs in the green tabs
Identify the fiscal year by choosing the selection box in the “3 Statement FYF” tab under column B, row 5
Select the current month on monthly basis by choosing the selection box in the “3 Statement FYF” tab under column C, row 5
All cells in green are input cells
You can find the green cells in the green tabs only
You will get the outcome in the dark blue tabs
You can read the instruction in the light blue tab
Key outcome in the dark blue tabs
The inputs in the green cells will dynamically flow into the following below:
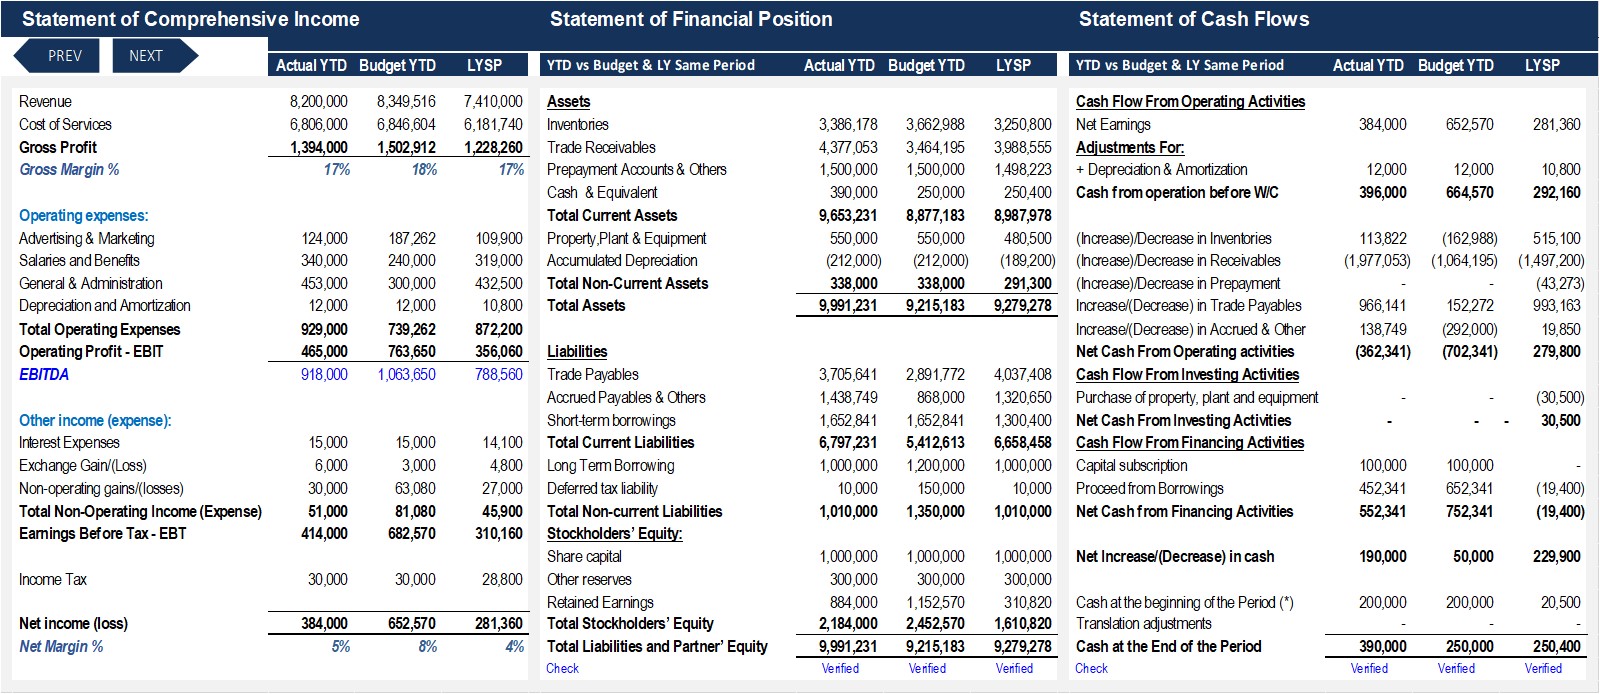
-3 financial statements by month showing actual and budget for the remaining months for the year
-3 financial statements YTD, Budget YTD and last year same period
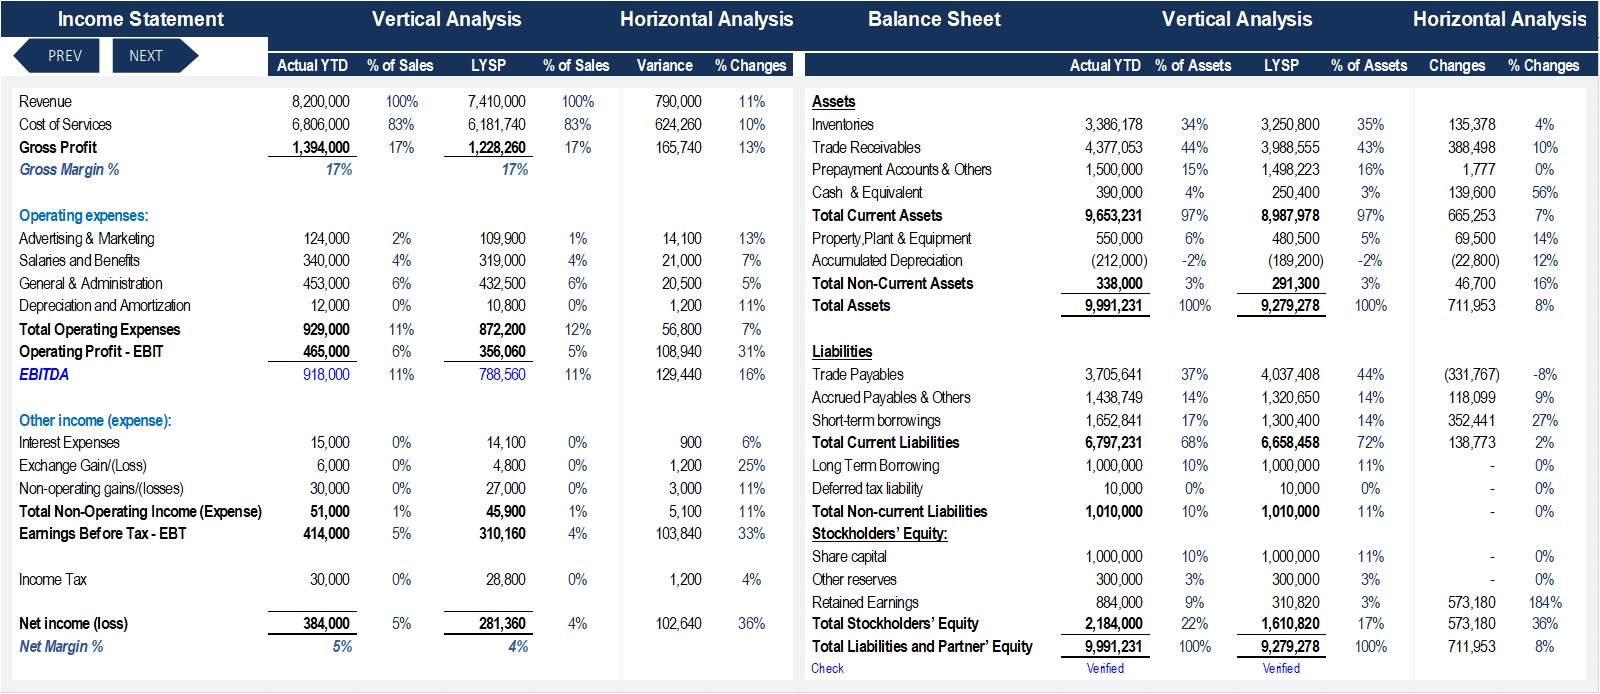
-Horizontal and vertical analysis for the income statement and balance sheet
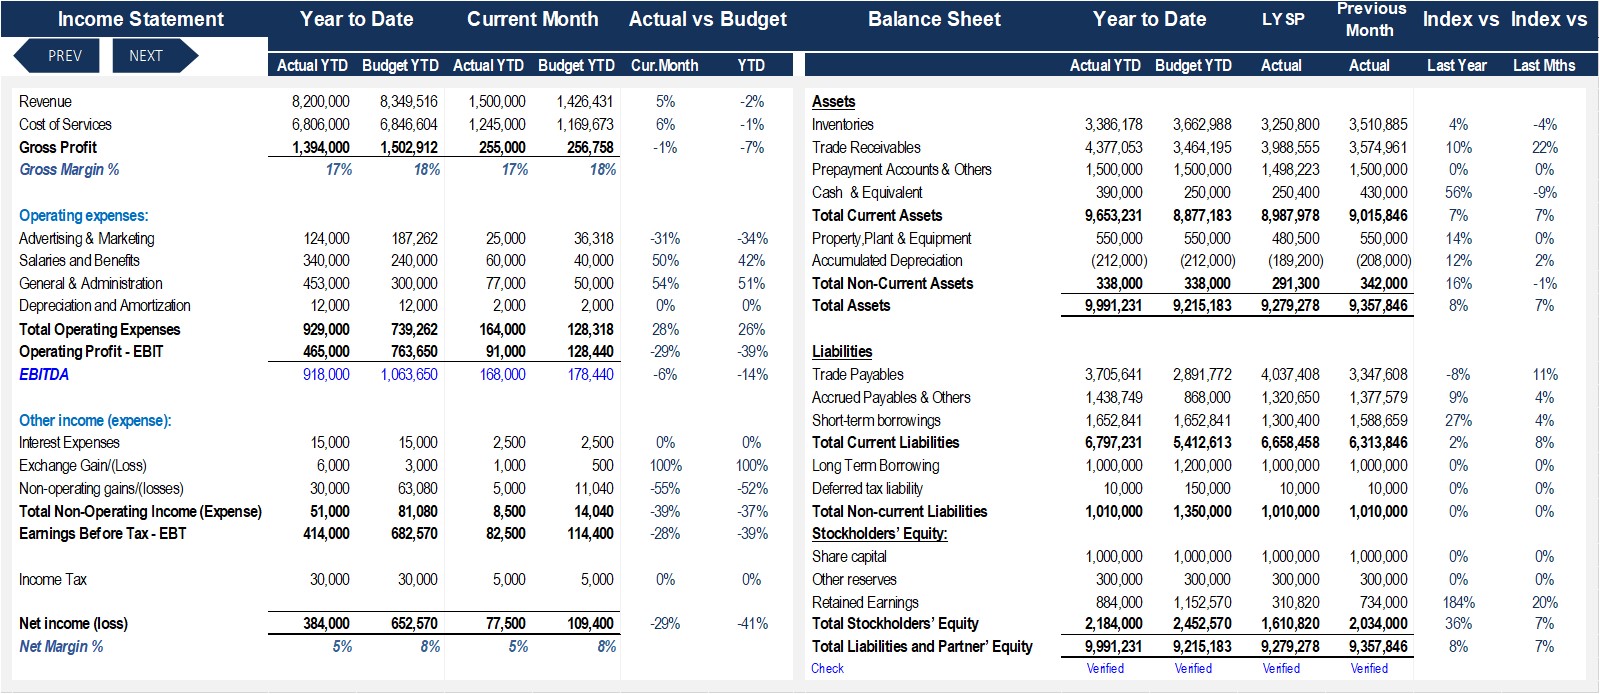
-P&L Actual vs LYSP and budget for the current month
-P&L Actual vs LYSP and budget year to date
-Balance sheet comparison actual as of current month vs last year same period and budget
-Balance sheet comparison actual as of current month vs previous month
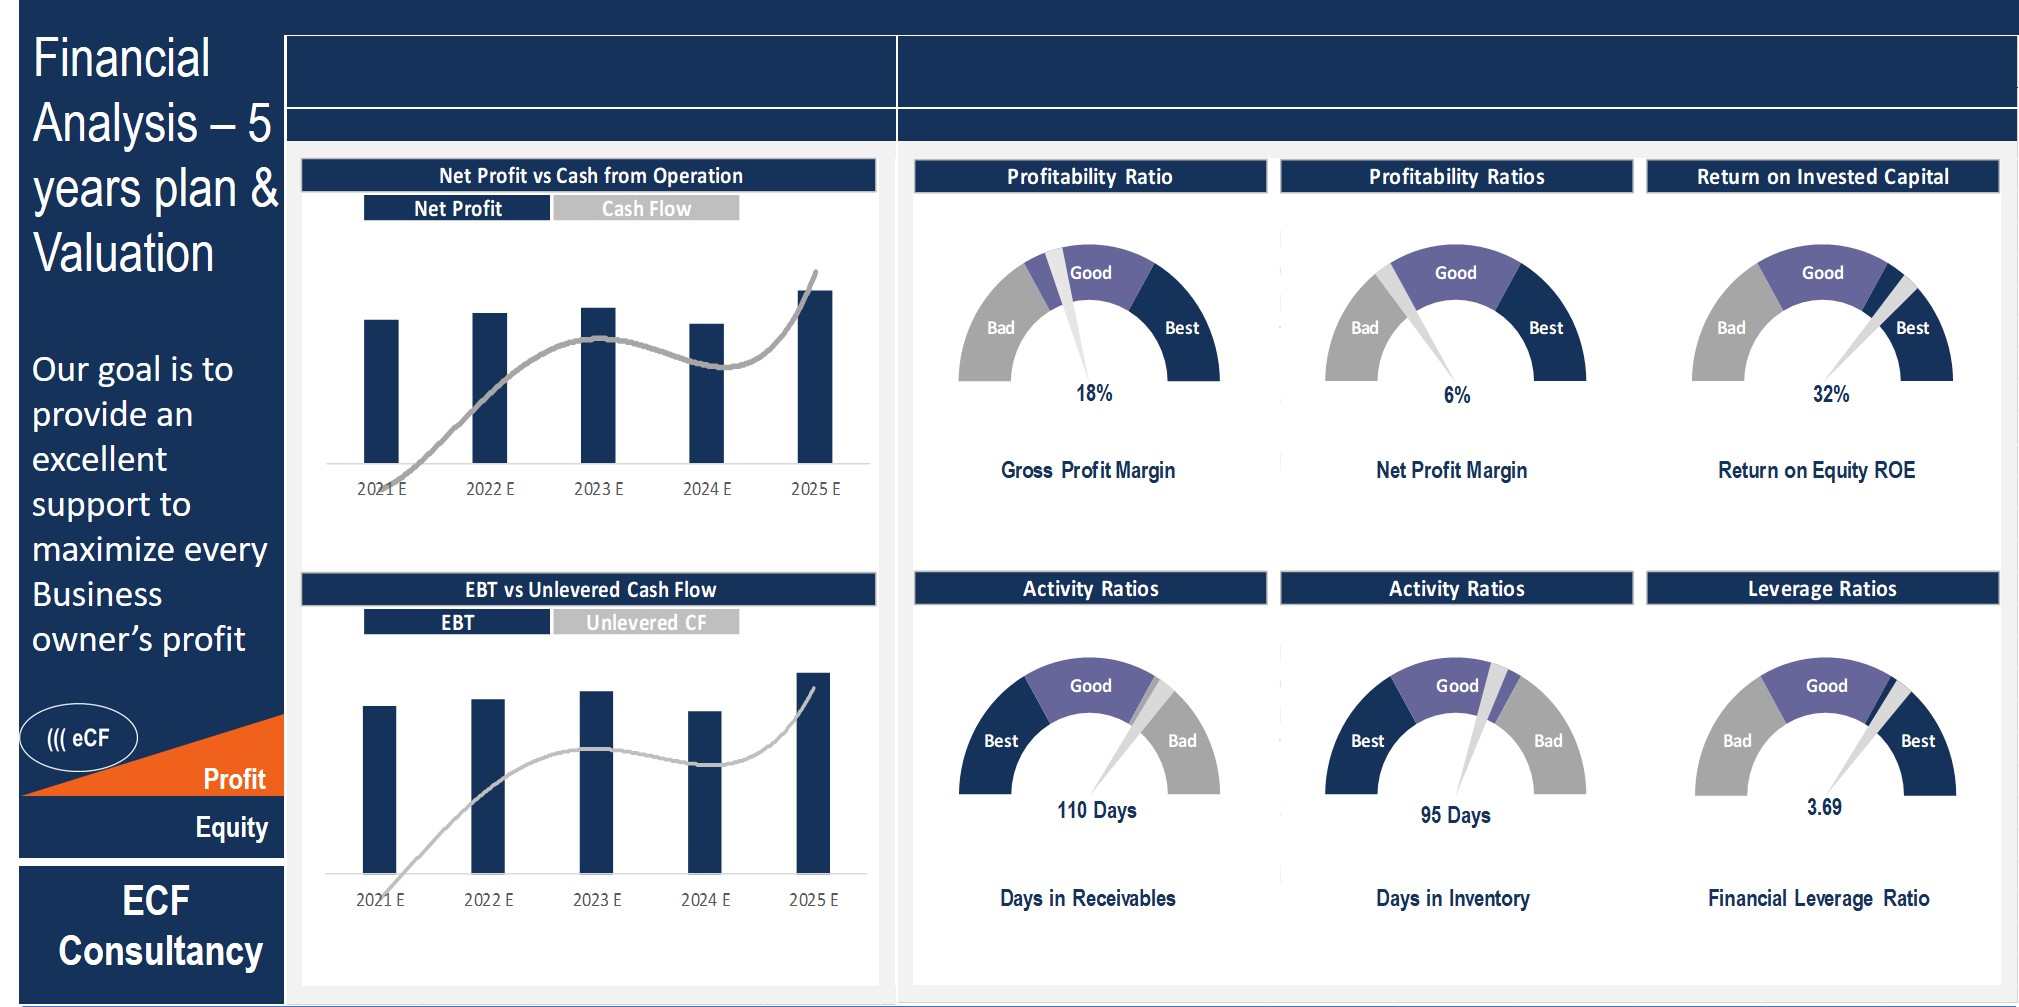
-Ratio for 5 years plan and dashboard
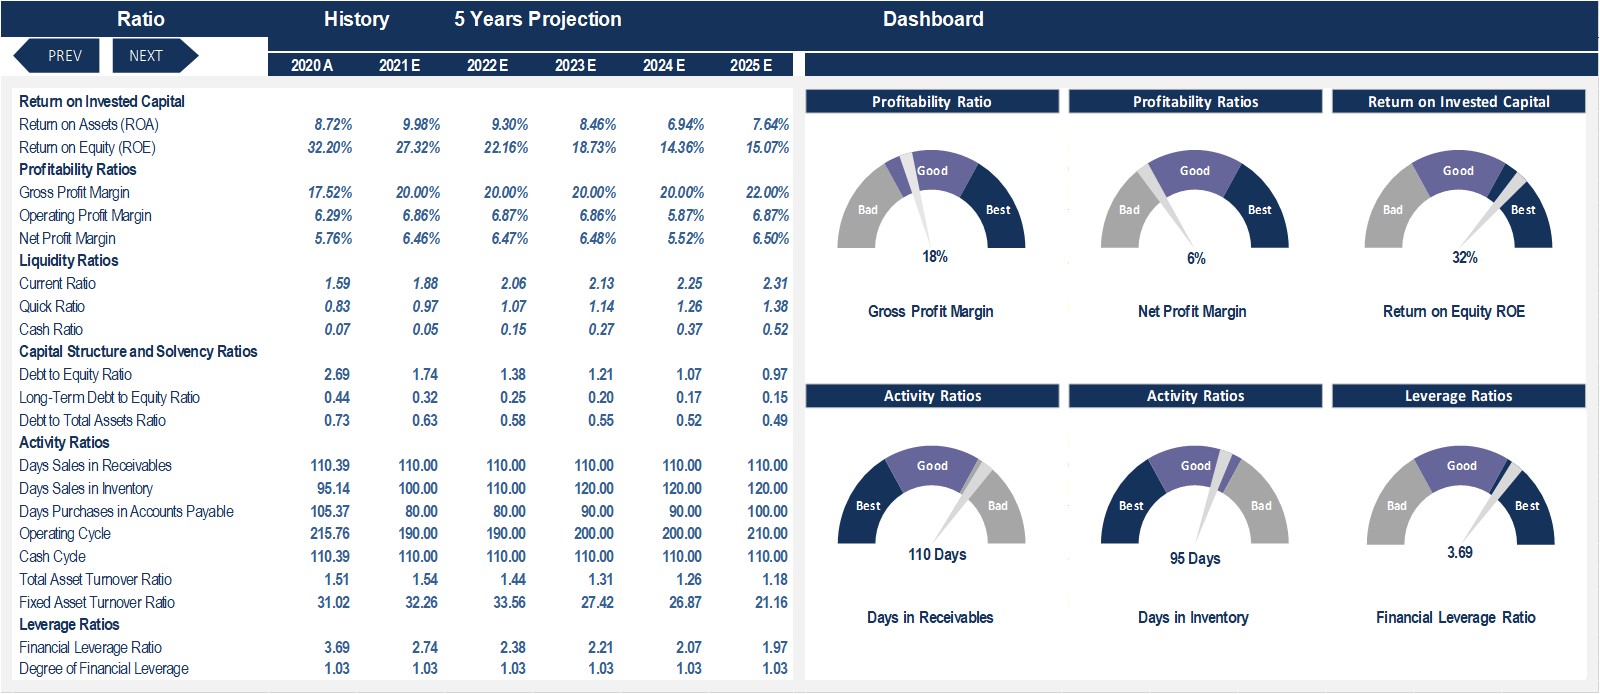
-Executive financial summary and dashboard
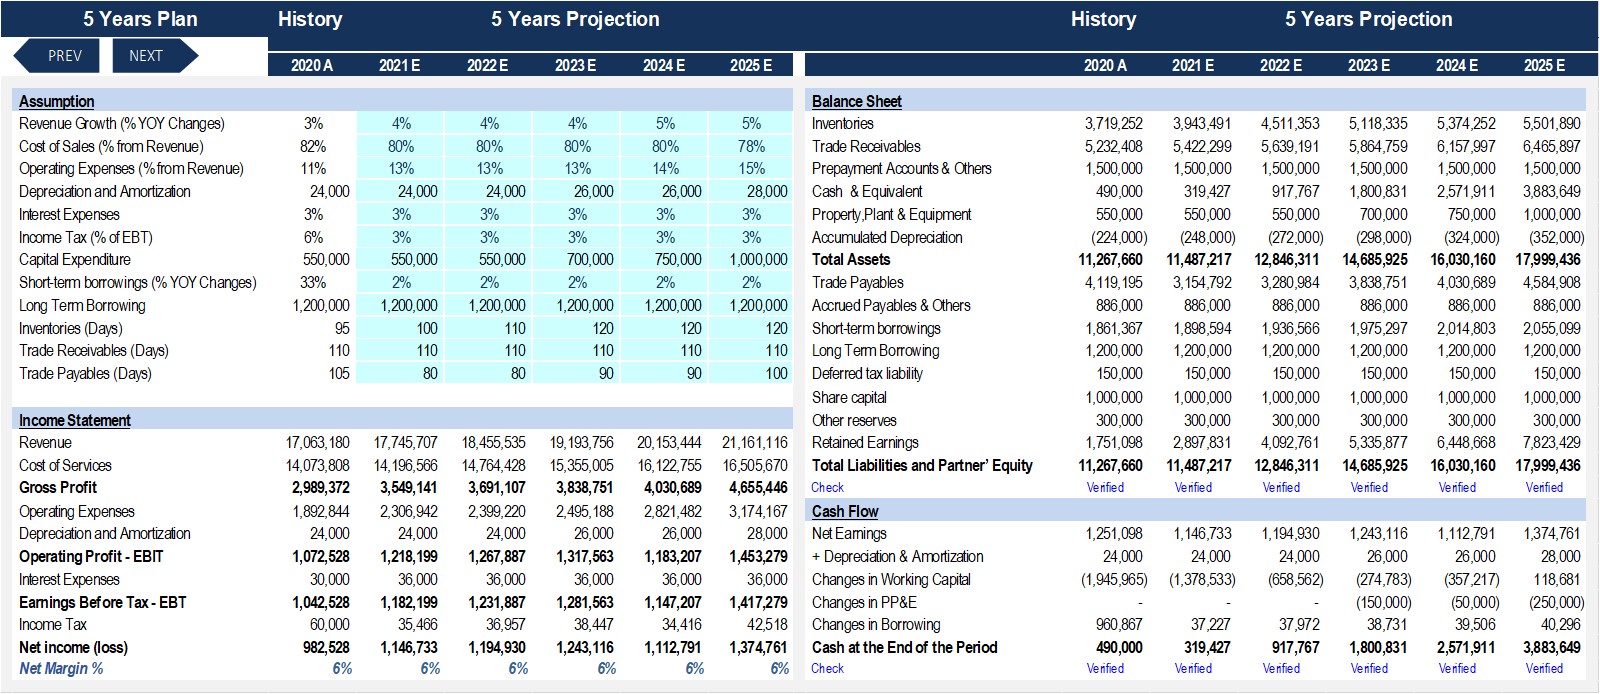
-5 years plan showing assumption, income statement, balance sheet and cash flow
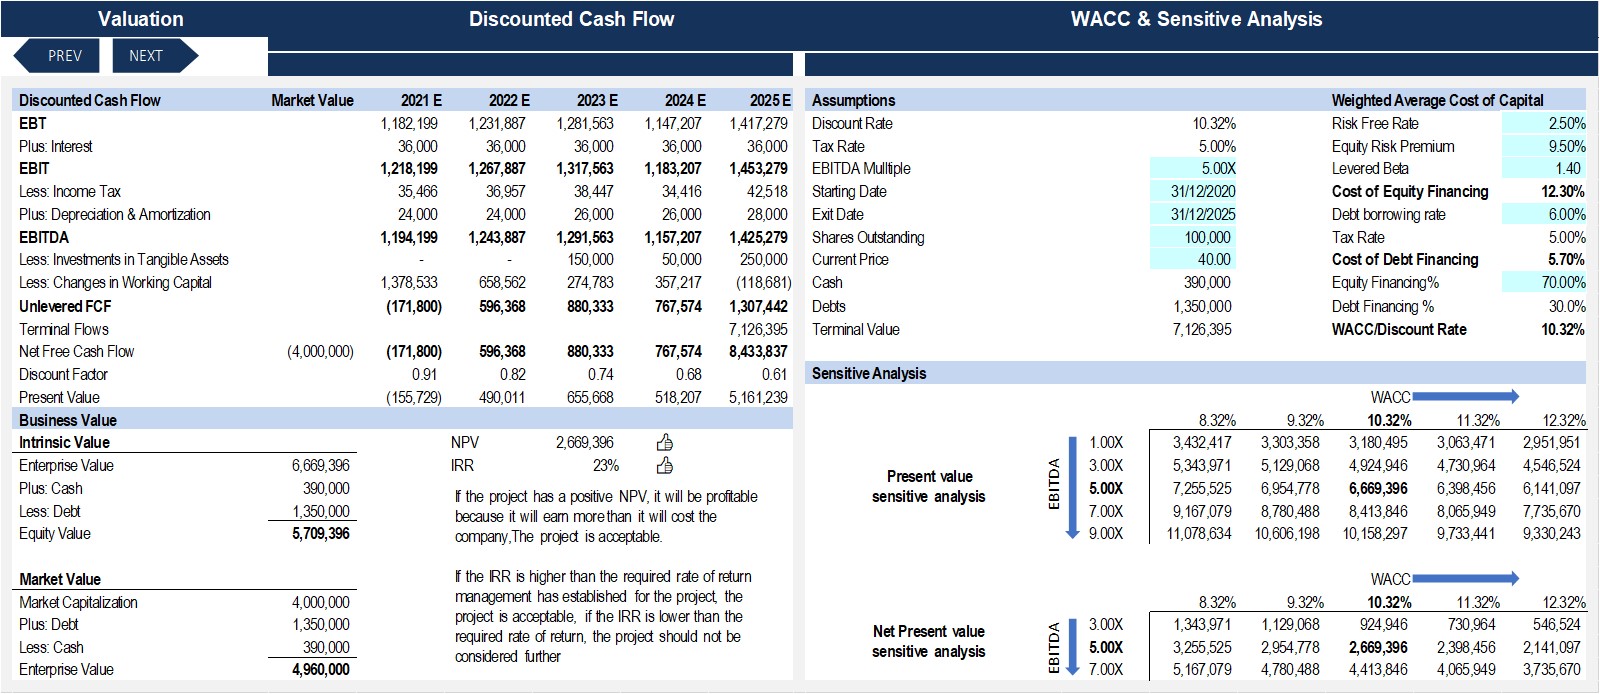
-Business valuation, NPV, IRR, WACC, and sensitive analysis
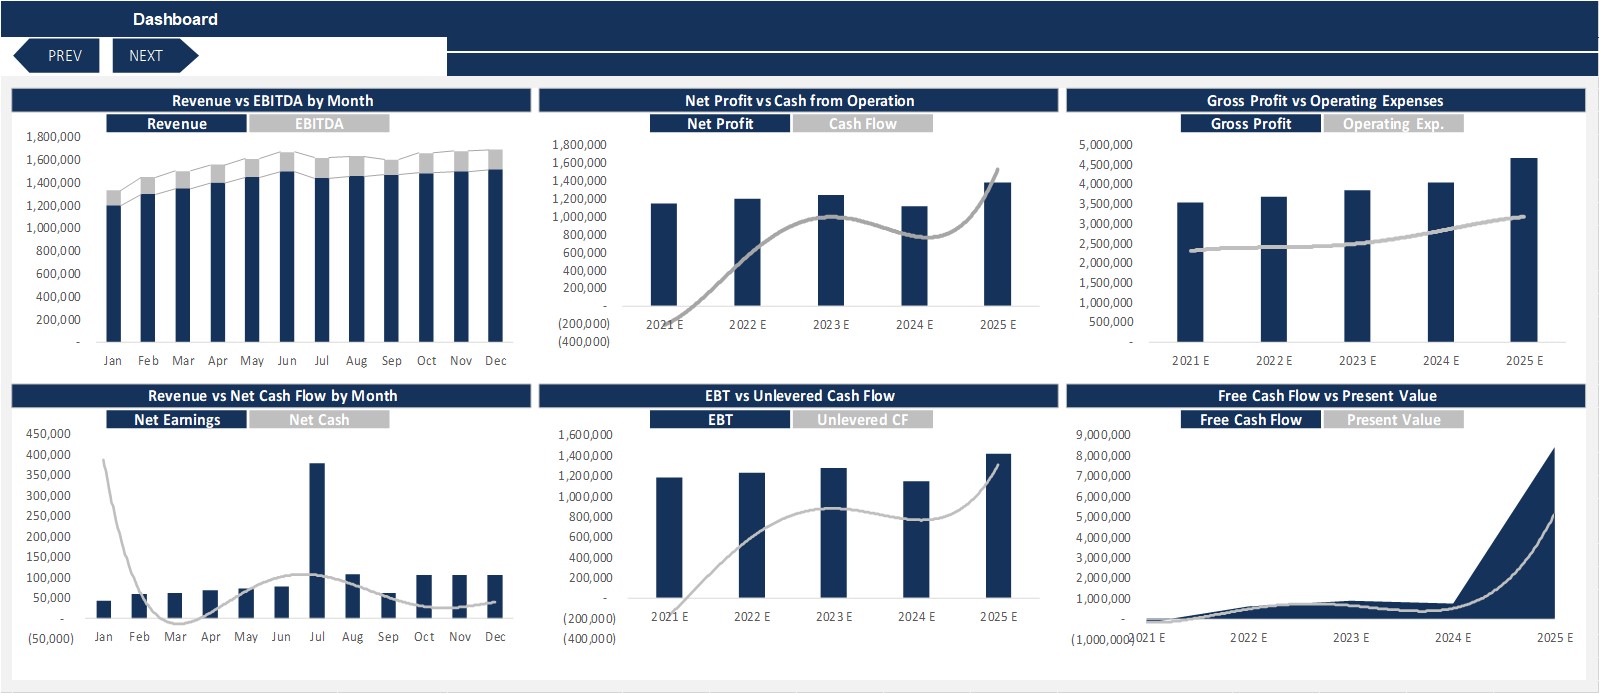
-Dashboard summary
Conclusion and customization
This is a highly versatile, very sophisticated financial model template, and is also user-friendly.
If you have any inquiries, modification request or other requests of assistance to customize the model template for your business case please contact us here: https://www.eloquens.com/channel/ecorporatefinance
General overview
The main idea of the model is to provide professional and successful financial presentation for the management showing vertical and horizontal analysis, comparison vs last year and budget, financial performance, financial summary, 5 years plan and valuation
This information is the business intelligence decision makers use for determining future business decisions, and to make changes to steer your company towards more profitability and efficiency,
The model provides an extensive financial analysis comparison and has designed to be useful tools for beginners and advanced financial professionals.
Very simple to use, the user only needs to fill the green cells in the green tabs and the outputs in the blue tabs are updated instantly
In the contents sheet you can see the structure of the model and by clicking on any of the headlines will automatically redirected to the relevant sheet
Key inputs in the green tabs
Identify the fiscal year by choosing the selection box in the “3 Statement FYF” tab under column B, row 5
Select the current month on monthly basis by choosing the selection box in the “3 Statement FYF” tab under column C, row 5
All cells in green are input cells
You can find the green cells in the green tabs only
You will get the outcome in the dark blue tabs
You can read the instruction in the light blue tab
Key outcome in the dark blue tabs
The inputs in the green cells will dynamically flow into the following below:
-3 financial statements by month showing actual and budget for the remaining months for the year
-3 financial statements YTD, Budget YTD and last year same period
-Horizontal and vertical analysis for the income statement and balance sheet
-P&L Actual vs LYSP and budget for the current month
-P&L Actual vs LYSP and budget year to date
-Balance sheet comparison actual as of current month vs last year same period and budget
-Balance sheet comparison actual as of current month vs previous month
-Ratio for 5 years plan and dashboard
-Executive financial summary and dashboard
-5 years plan showing assumption, income statement, balance sheet and cash flow
-Business valuation, NPV, IRR, WACC, and sensitive analysis
-Dashboard summary
Conclusion and customization
This is a highly versatile, very sophisticated financial model template, and is also user-friendly.
If you have any inquiries, modification request or other requests of assistance to customize the model template for your business case please contact us here: https://www.eloquens.com/channel/ecorporatefinance
This Best Practice includes
Excel Template
