

Originally published: 08/06/2023 07:56
Last version published: 09/06/2023 14:51
Publication number: ELQ-73261-2
View all versions & Certificate
Last version published: 09/06/2023 14:51
Publication number: ELQ-73261-2
View all versions & Certificate

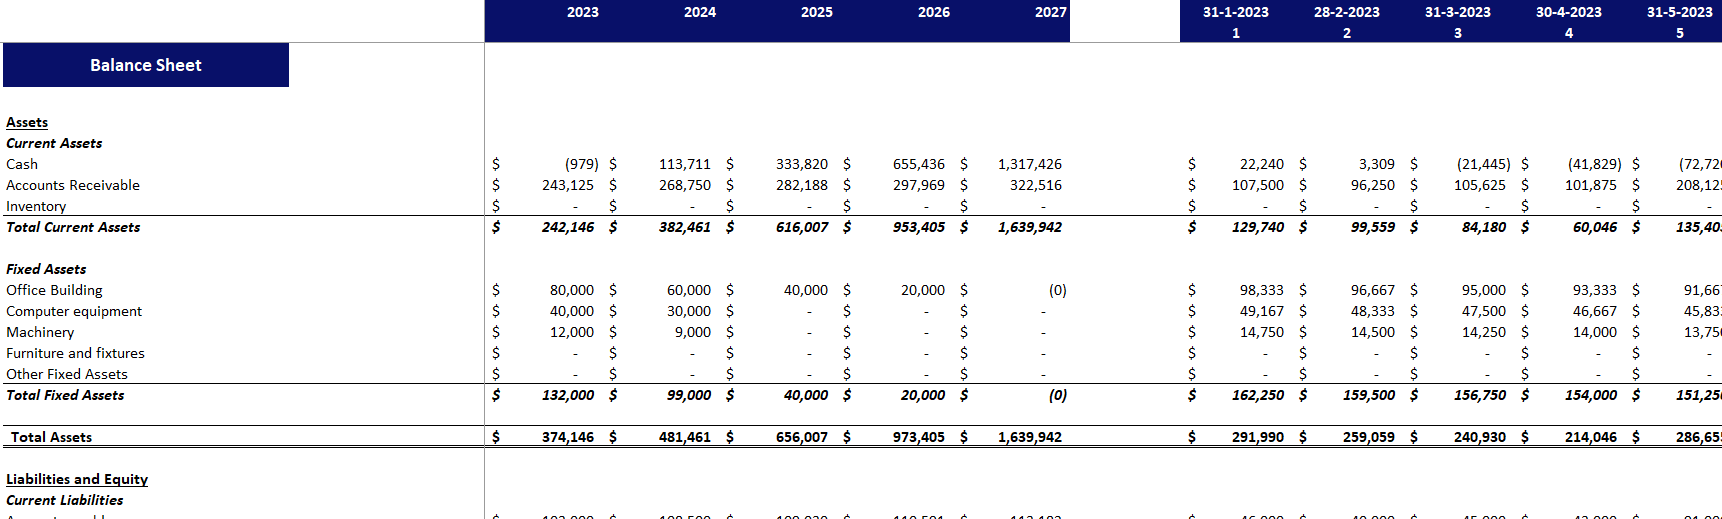
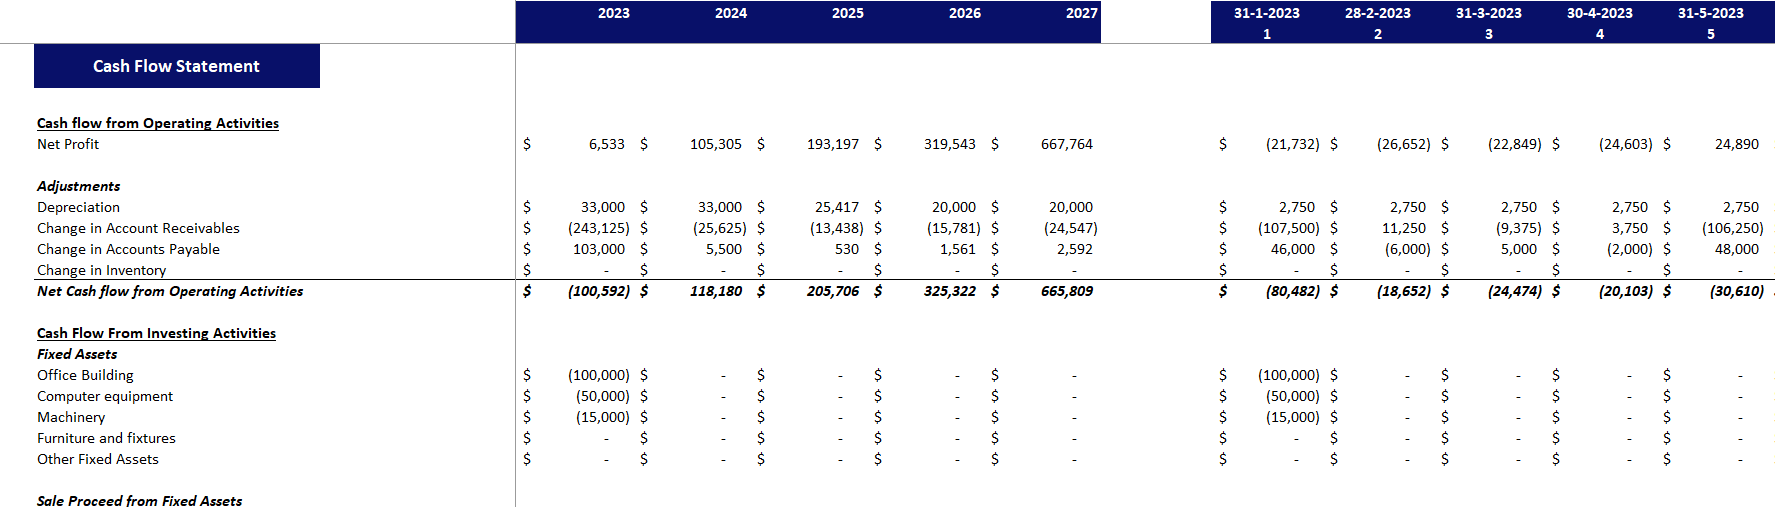
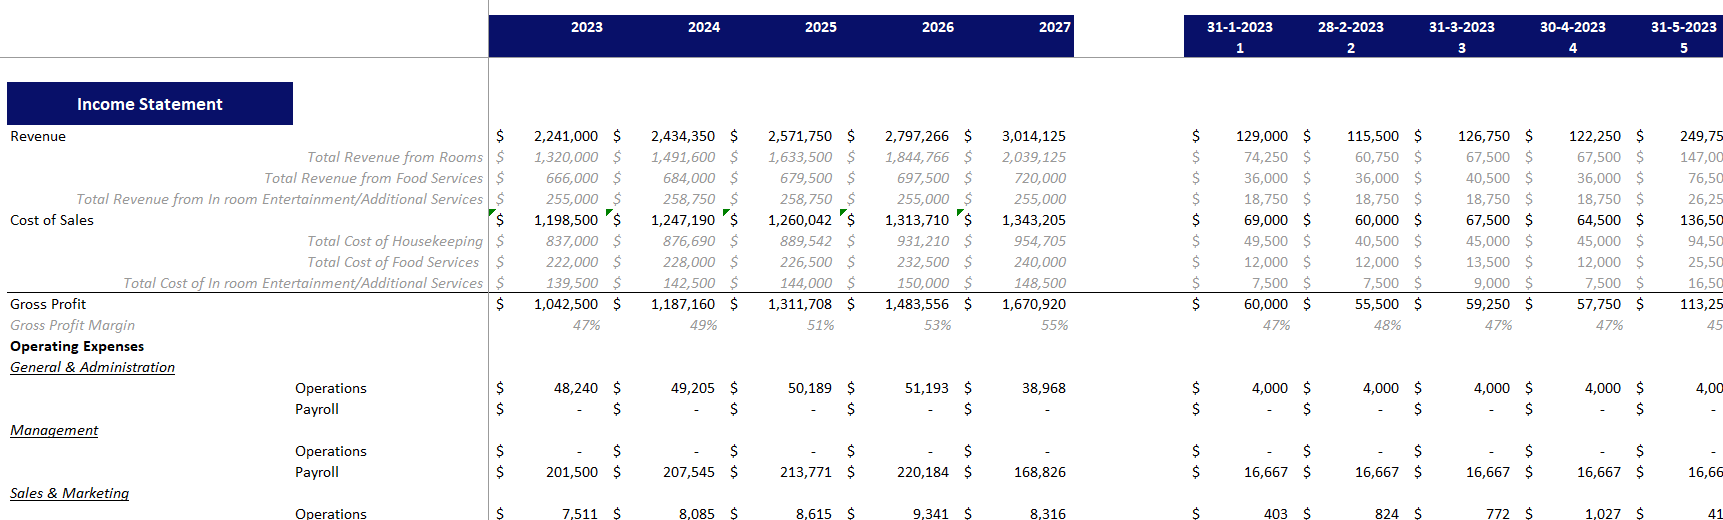
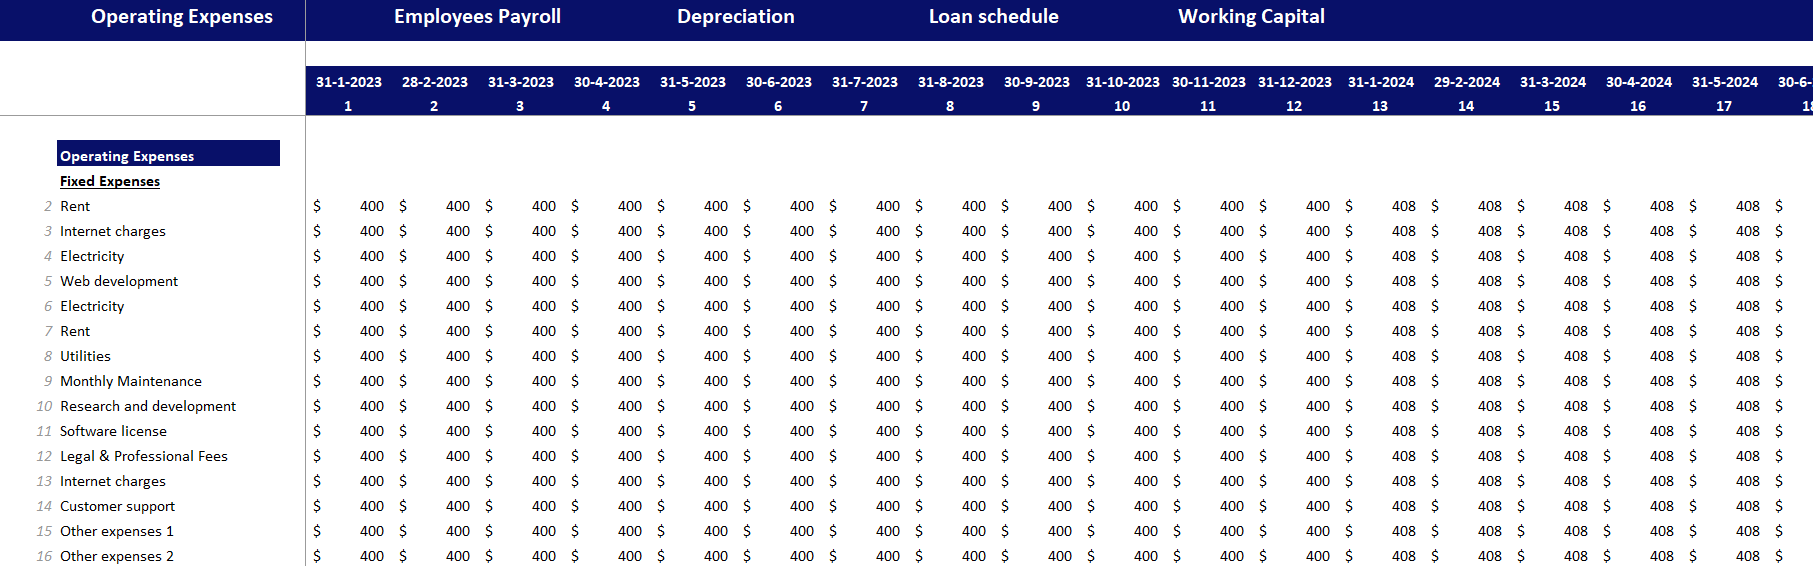
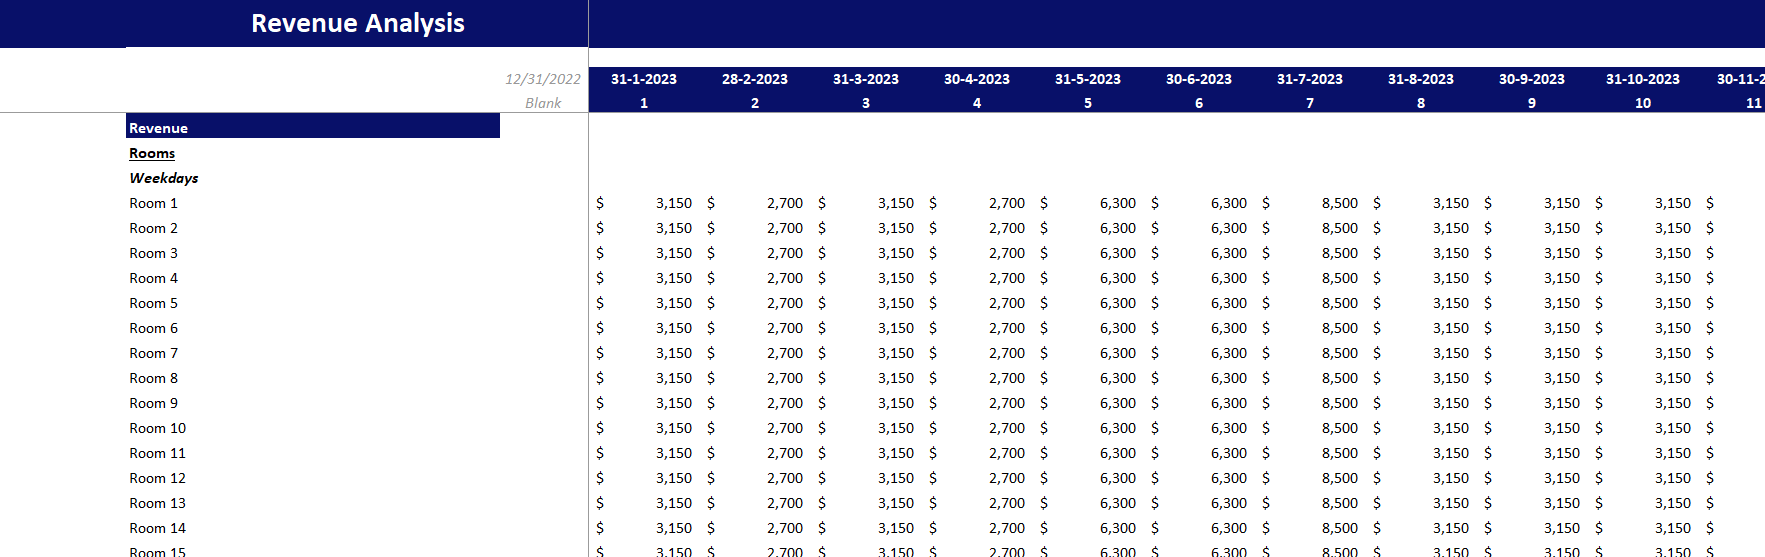
Boutique Hotel Excel Financial Model
The Template Contains 5 years of financial projections, including an Income statement, Cashflow Statement, balance sheet, and dashboard.
Our mission is to be the industrial leader and pioneer in our business domainFollow 17
Further information
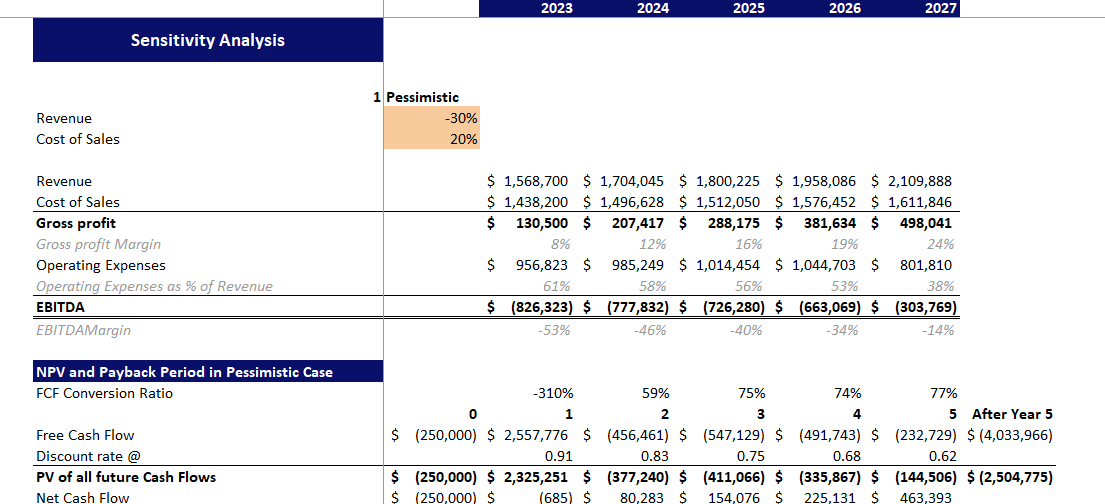
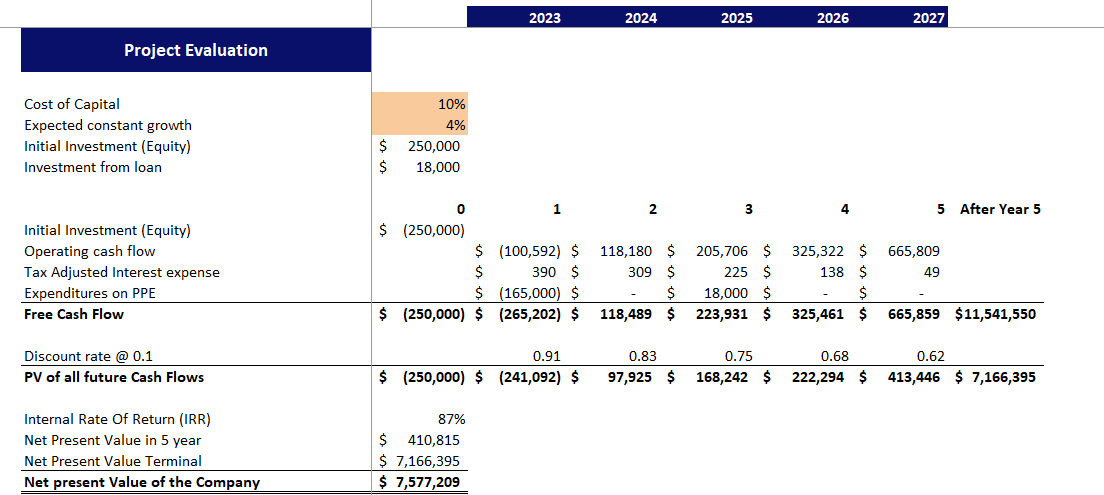
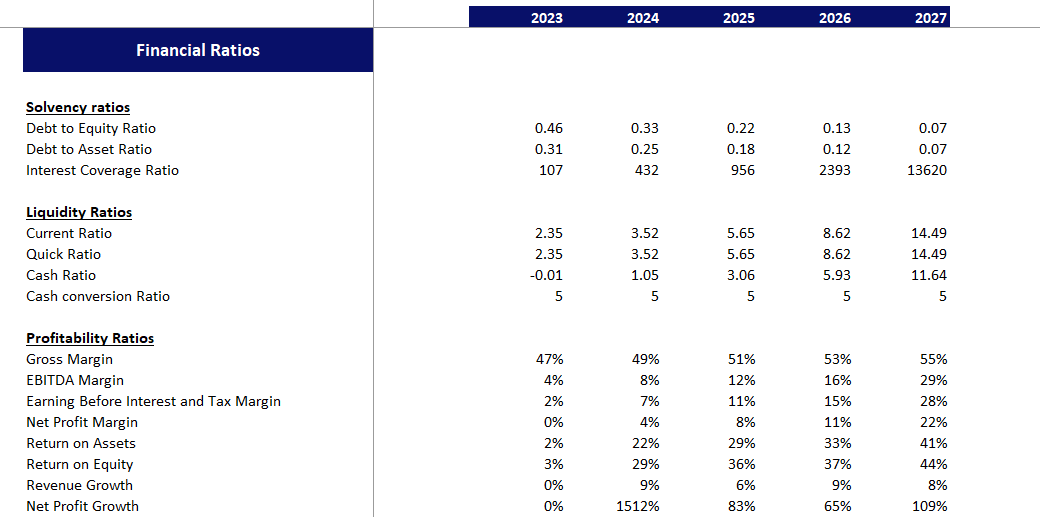
The objective of The Boutique Hotel Financial Model Excel Template is to provide startups in the boutique hotel business with a comprehensive tool to analyze and project their financial performance over a period of 5 years.
For Boutique Hotel excel financial model
