Originally published: 03/11/2024 15:25
Publication number: ELQ-13985-1
View all versions & Certificate
Publication number: ELQ-13985-1
View all versions & Certificate

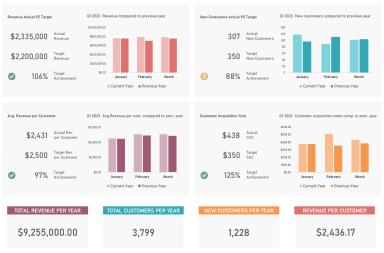
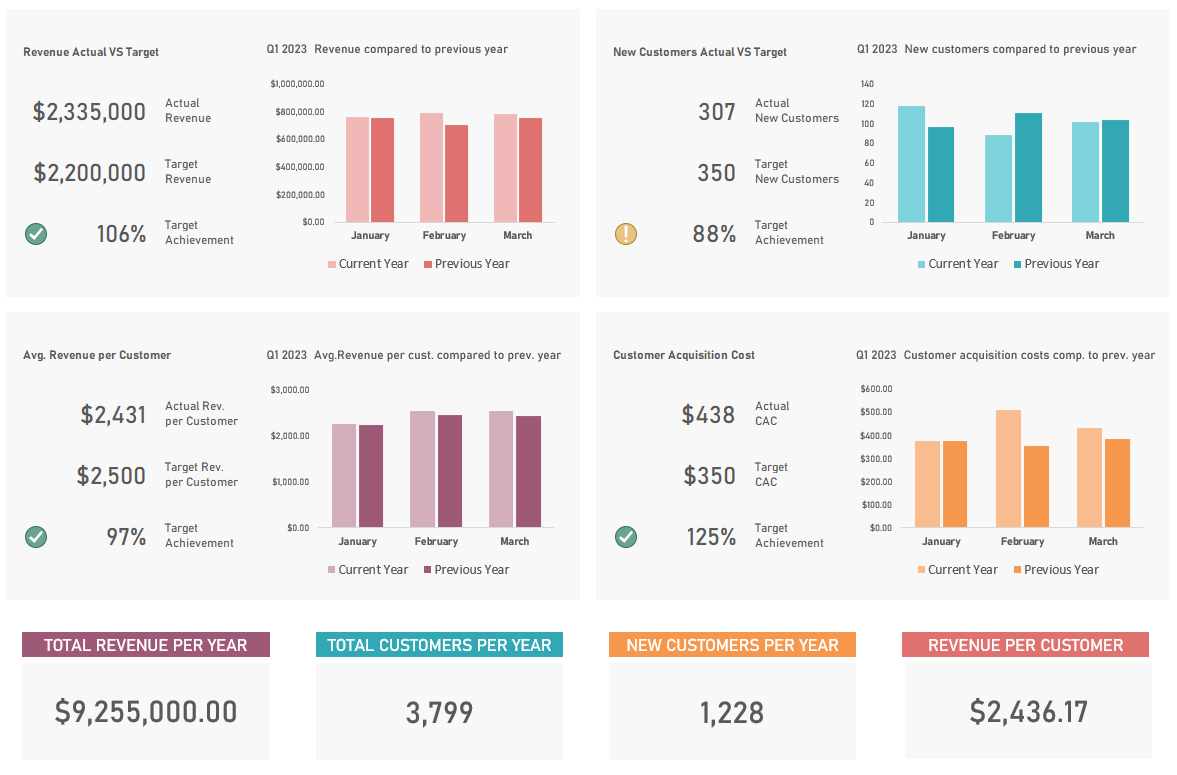
KPI Dashboard in Microsoft Excel
Achieve your sales targets! This dashboard boosts insights and performance.
