
Originally published: 14/01/2025 08:38
Last version published: 20/01/2025 08:12
Publication number: ELQ-37684-2
View all versions & Certificate
Last version published: 20/01/2025 08:12
Publication number: ELQ-37684-2
View all versions & Certificate

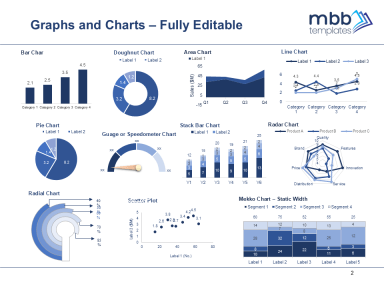
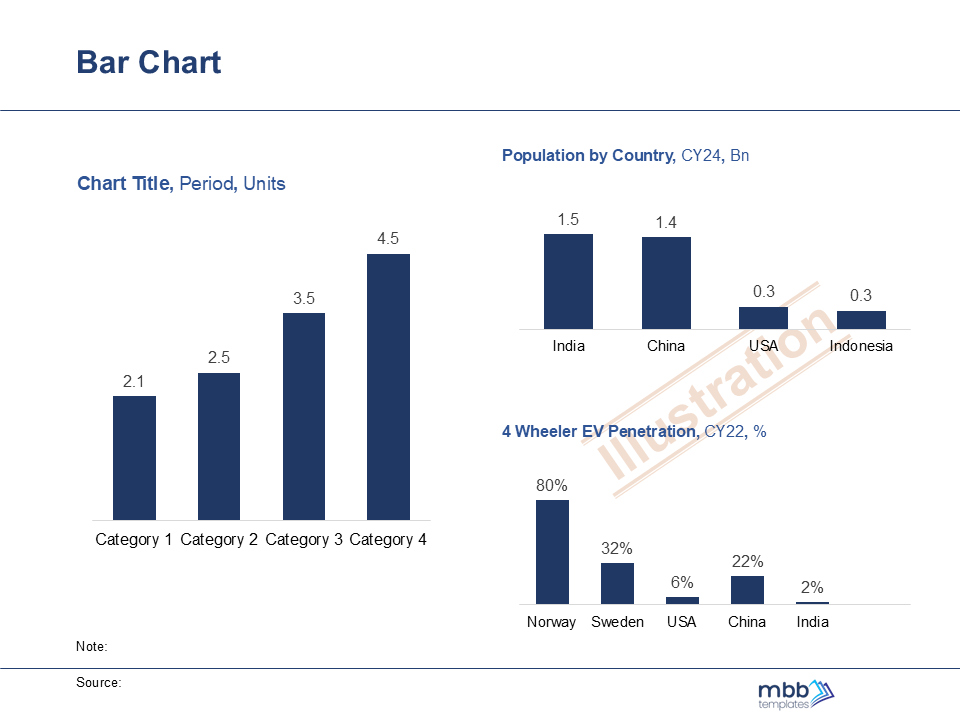
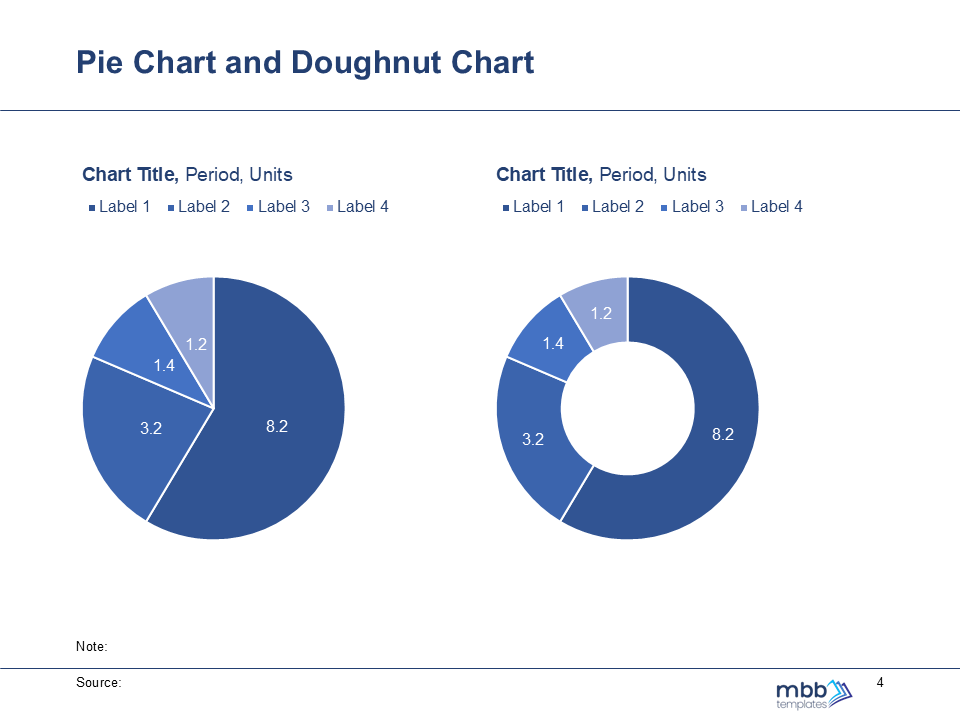
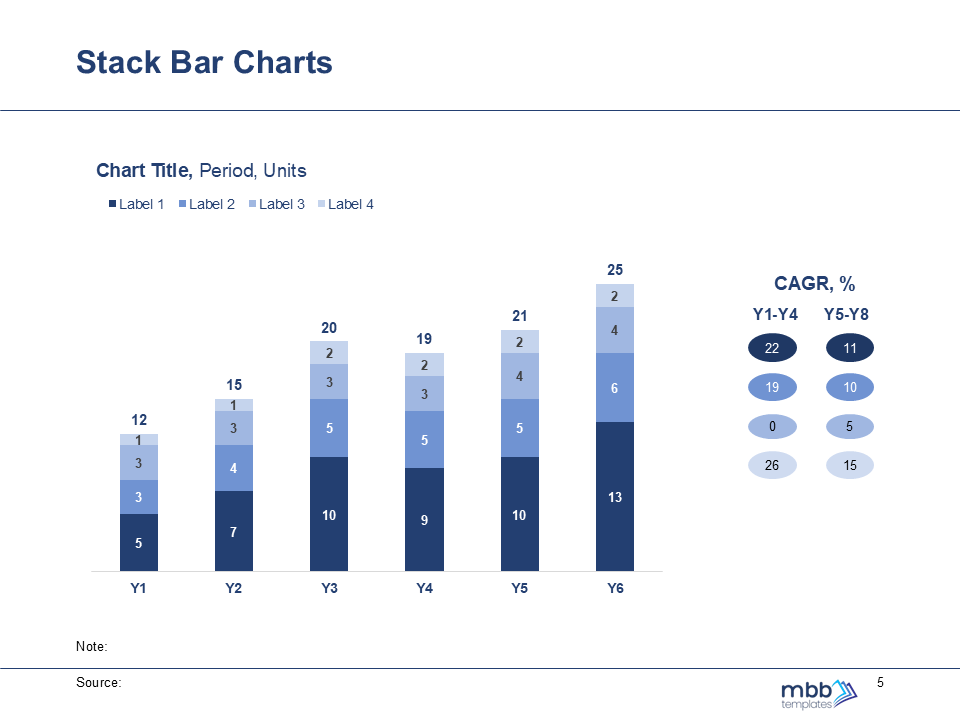
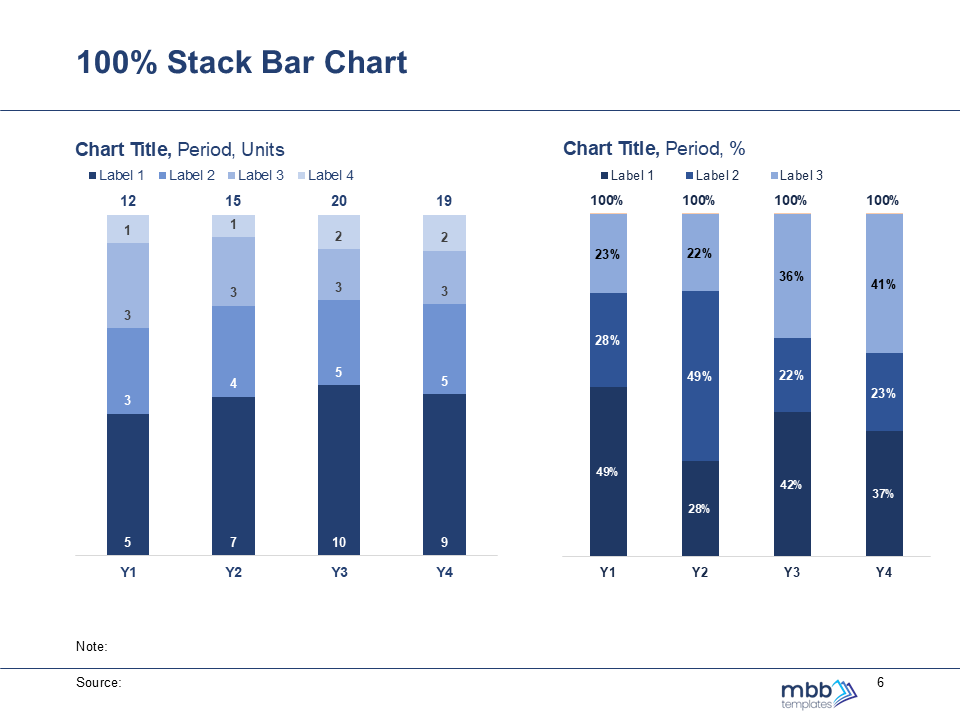
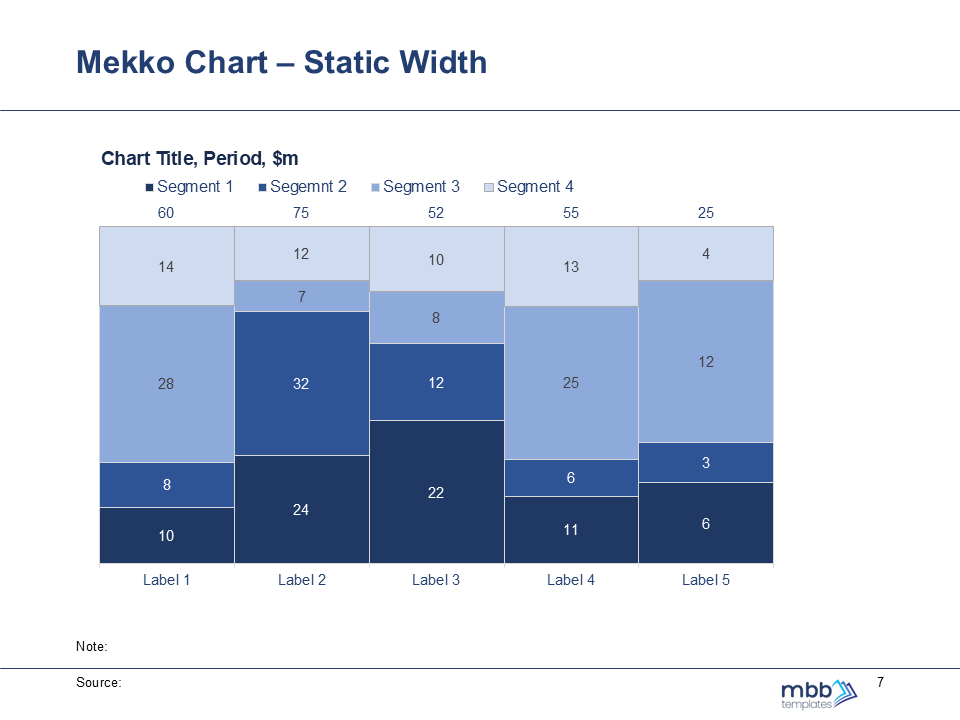
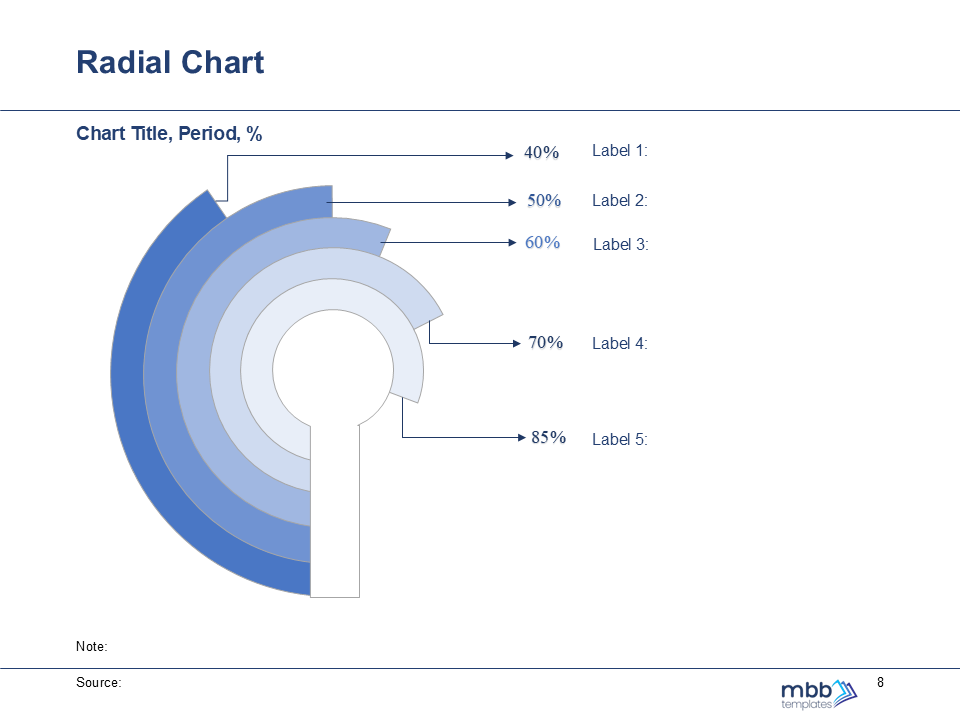
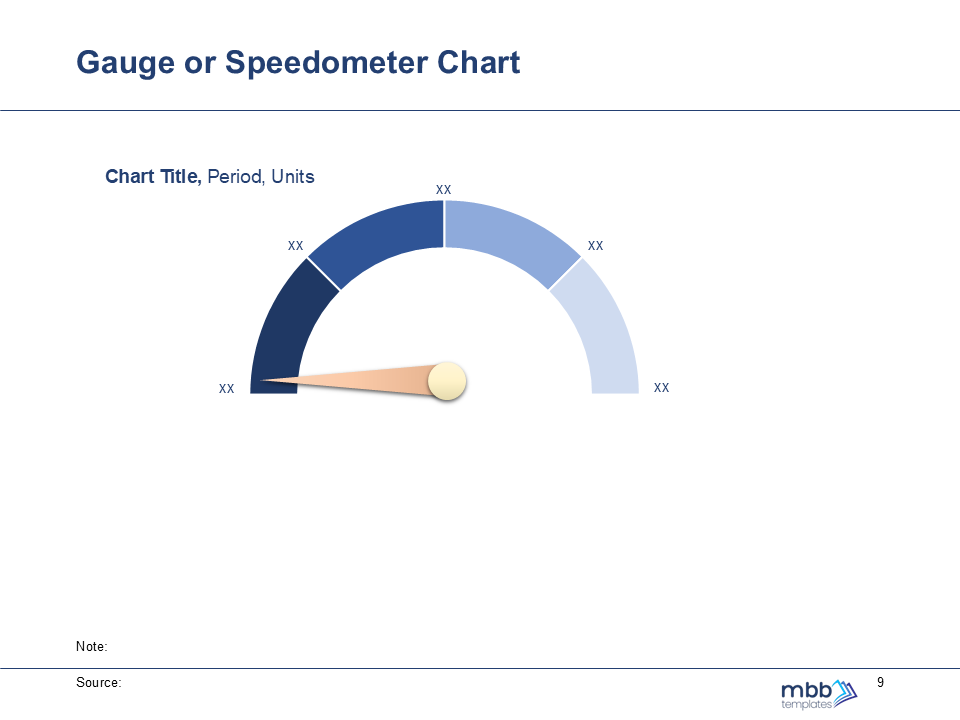
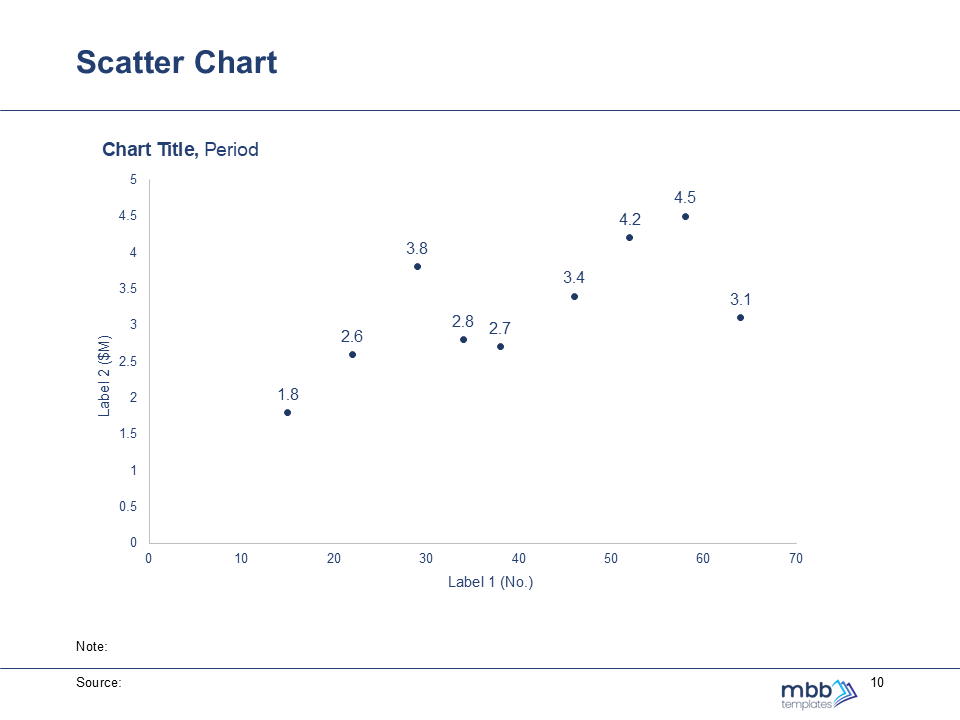
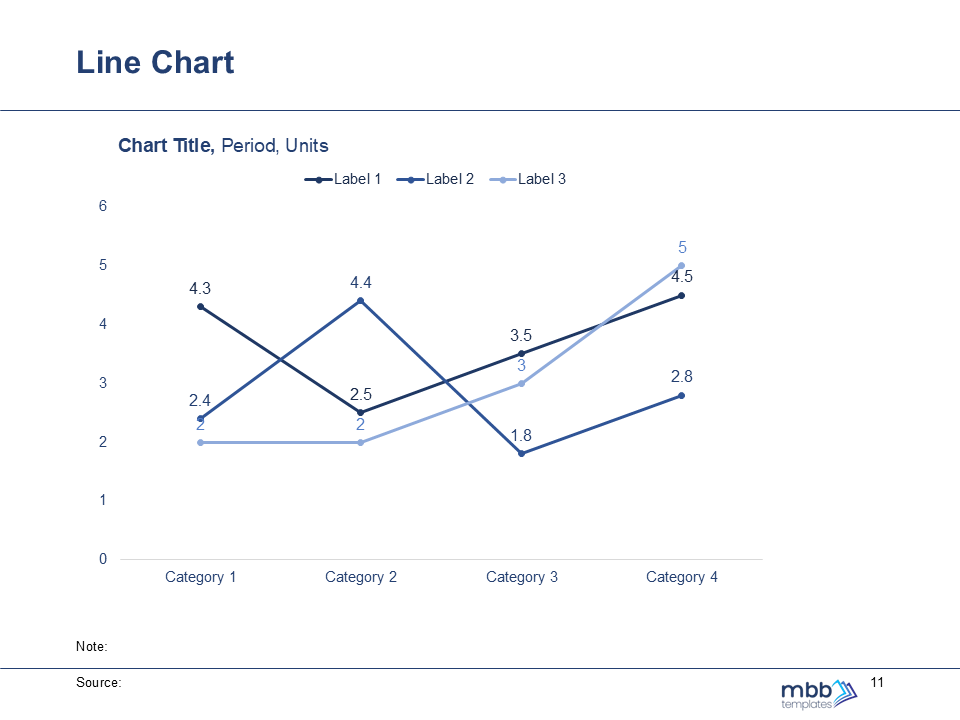
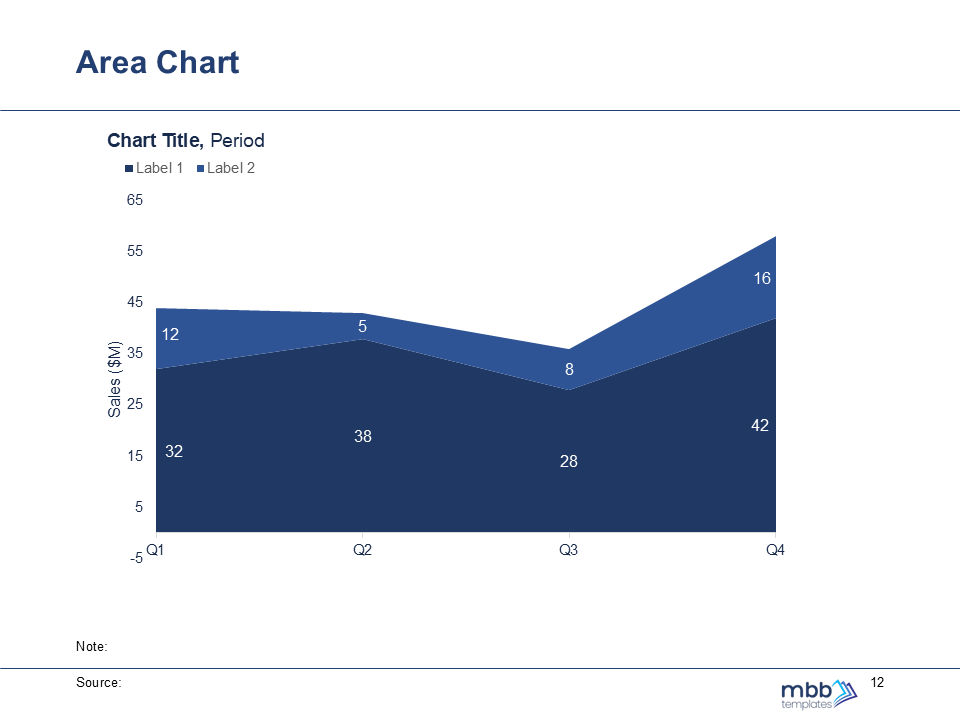
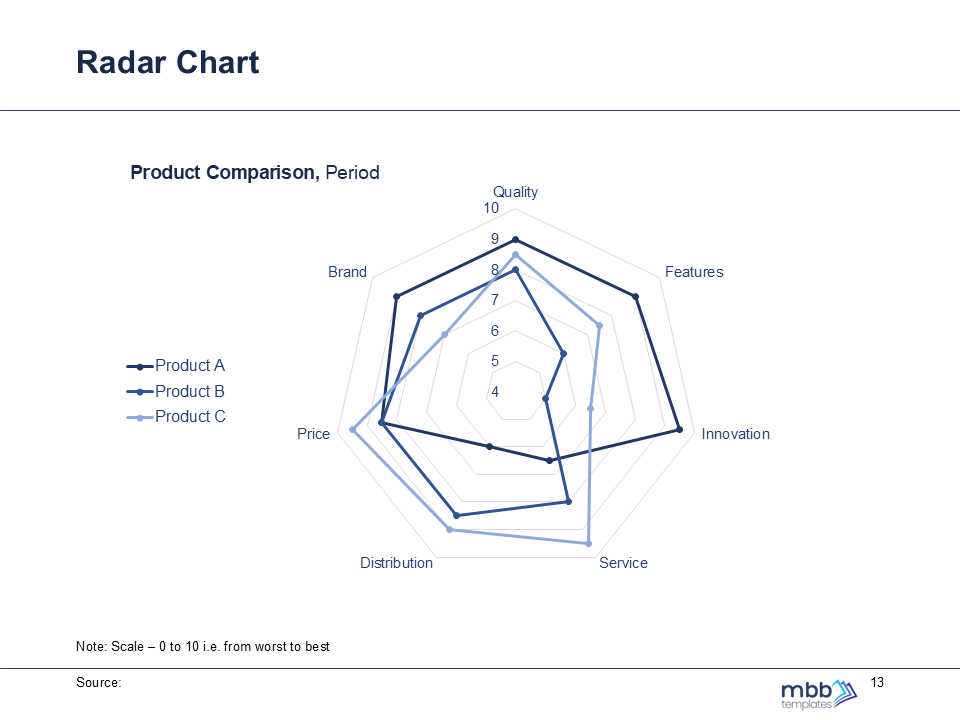
Graphs and Charts - Fully Editable
Fully Editable and Well Formatted Graphs and Charts for Business Presentations
