MXDataKPI automated data cleansing and KPI dashboards
Originally published: 13/05/2026 08:09
Publication number: ELQ-78616-1
View all versions & Certificate
certified

MXDataKPI automated data cleansing and KPI dashboards

MXDataKPI is a game changing analytics engine that transforms Excel into a fully automated KPI intelligence system in minutes using raw data files.

Description
MXDataKPI — Automated KPI Intelligence for Excel‑Driven Enterprises

MXDataKPI is a next‑generation analytics engine that transforms raw business data into a fully automated KPI intelligence system directly inside Microsoft Excel.
Designed for enterprises that demand speed, accuracy, and narrative‑driven insights, MXDataKPI eliminates manual reporting and replaces it with a guided, AI‑style analytics experience.
MXDataKPI automatically:
  • Profiles your data
  • Recommends the KPIs that matter
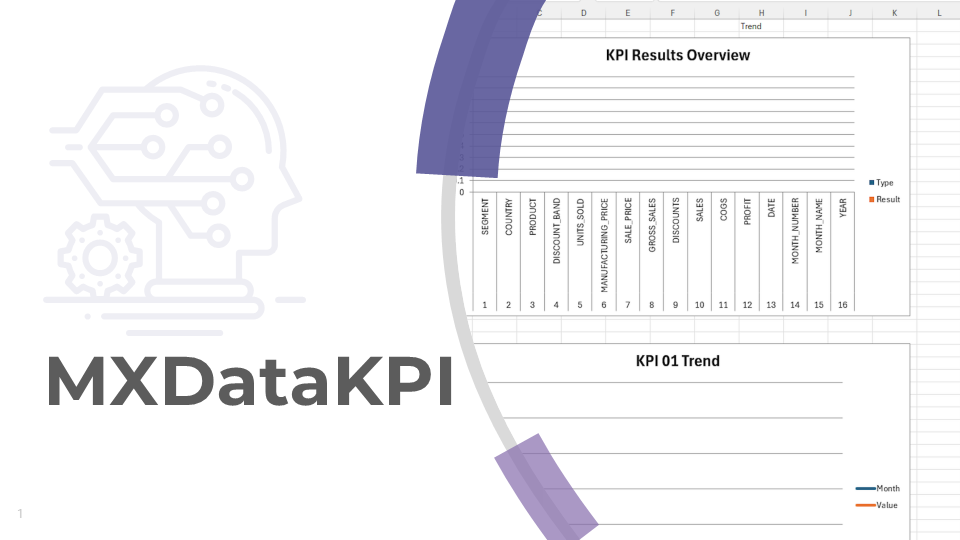
  • Builds KPI sheets with trend, forecast, and quality analysis
  • Generates a multi‑page executive storyboard PDF
  • Produces AI‑style narrative insights
  • Supports natural‑language questions (“What happened to revenue last quarter”)
  • Creates a fully interactive dashboard
  • Allows enterprise‑grade filtering, governance, and repeatability
MXDataKPI is built for leaders who need clarity, analysts who need automation, and teams who need consistent, repeatable KPI intelligence without the cost or complexity of enterprise BI platforms.


Who It’s For
  • Enterprise operations teams
  • Finance & FP&A
  • Marketing & growth teams
  • Customer success & retention teams
  • Manufacturing & supply chain
  • SaaS product analytics
  • Any business running Excel‑based reporting at scale


What Makes MXDataKPI Different
MXDataKPI is not a template.
It is not a dashboard.
It is a guided analytics engine that builds itself around your data.
You don’t adapt to the tool — the tool adapts to you.


PRODUCT SPECIFICATION (TECHNICAL + FUNCTIONAL)
Core Engine
  • Automated KPI creation engine
  • Automated KPI calculation engine
  • Automated KPI sheet builder (AN_KPI_xx)
  • Automated trend analysis
  • Automated forecasting (linear, moving average, seasonal)
  • Automated data quality profiling
  • Automated category insights
  • Automated outlier detection
  • Automated MoM / YoY analysis
  • Automated volatility analysis
  • Automated KPI dependency support (optional)

AI‑Style Narrative Engine
  • Trend commentary
  • Forecast commentary
  • Outlier commentary
  • Volatility commentary
  • MoM / YoY commentary
  • Driver analysis (“Why did this change?”)
  • Pattern explanation (“How is this KPI behaving?”)
  • Natural‑language follow‑ups

Natural‑Language Query Engine (NLQ)
Supports questions like:
  • “What happened to revenue last quarter”
  • “Why did churn increase”
  • “Explain customer satisfaction in simple terms”
  • “Tell me more about this KPI”
Includes conversational memory for follow‑ups.

Storyboard PDF Generator
  • Executive summary
  • KPI highlights
  • Trend pages
  • Forecast pages
  • Category insights
  • Data quality summary
  • Individual KPI pages
  • AI insights embedded
  • Fully filterable
  • One‑click export

Dashboard

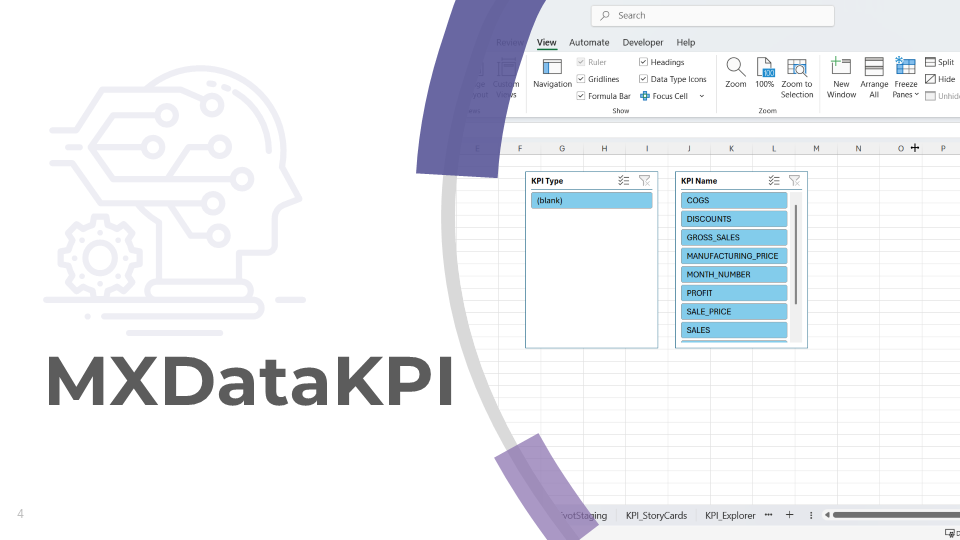
  • KPI selector
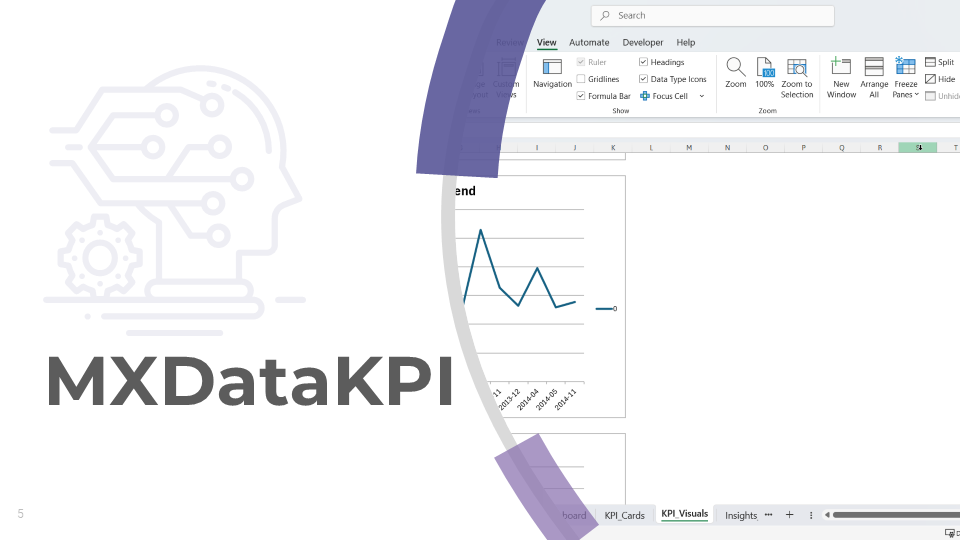
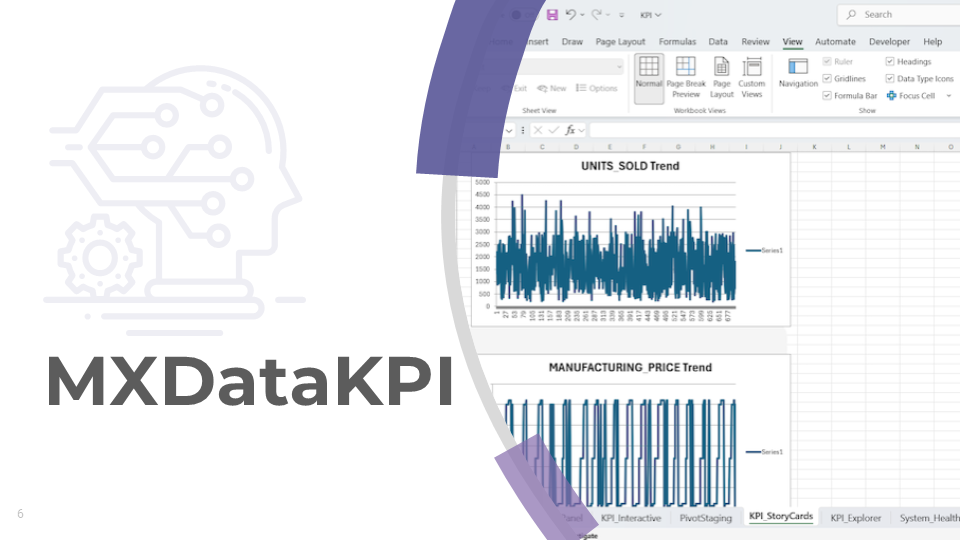
  • Trend visualisation
  • Forecast visualisation
  • AI insights panel
  • NLQ panel
  • Refresh engine
  • KPI comparison (optional)

This Best Practice includes
1 Excel file

Acquire business license for $112.00

Add to cart

Add to bookmarks

Discuss

Further information

Below is the full list of KPI analysis types included in MXDataKPI.
1. Trend Analysis
Identifies long term direction (upward, downward, stable).
Used when monitoring performance over time.
2. Forecasting
Predicts future values using statistical models.
Used for planning, budgeting, and capacity forecasting.
3. MoM (Month over Month) Change
Measures short term performance shifts.
Used for tactical decision making.
4. YoY (Year over Year) Change
Measures long term growth or decline.
Used for strategic performance evaluation.
5. Volatility Analysis
Measures variability and stability.
Used for risk assessment and operational control.
6. Outlier Detection
Identifies unusual spikes or drops.
Used for anomaly detection and root cause analysis.
7. Category Insights
Breaks KPIs down by category (product, region, segment).
Used for segmentation and prioritisation.
8. Data Quality Analysis
Measures completeness, missing values, and reliability.
Used to validate data integrity before decision making.
9. Forecast Confidence
Evaluates reliability of predictions.
Used for planning and scenario modelling.
10. KPI Dependency Analysis (optional)
Builds composite KPIs from other KPIs.
Used for advanced analytics and executive dashboards.

Technical Requirements
• Microsoft Excel (Windows)
• Macros enabled
• Standard enterprise datasets (CSV, XLSX, SQL extracts, etc.)


0.0 / 5 (0 votes)

please wait...