
Originally published: 27/04/2020 10:34
Publication number: ELQ-23544-1
View all versions & Certificate
Publication number: ELQ-23544-1
View all versions & Certificate

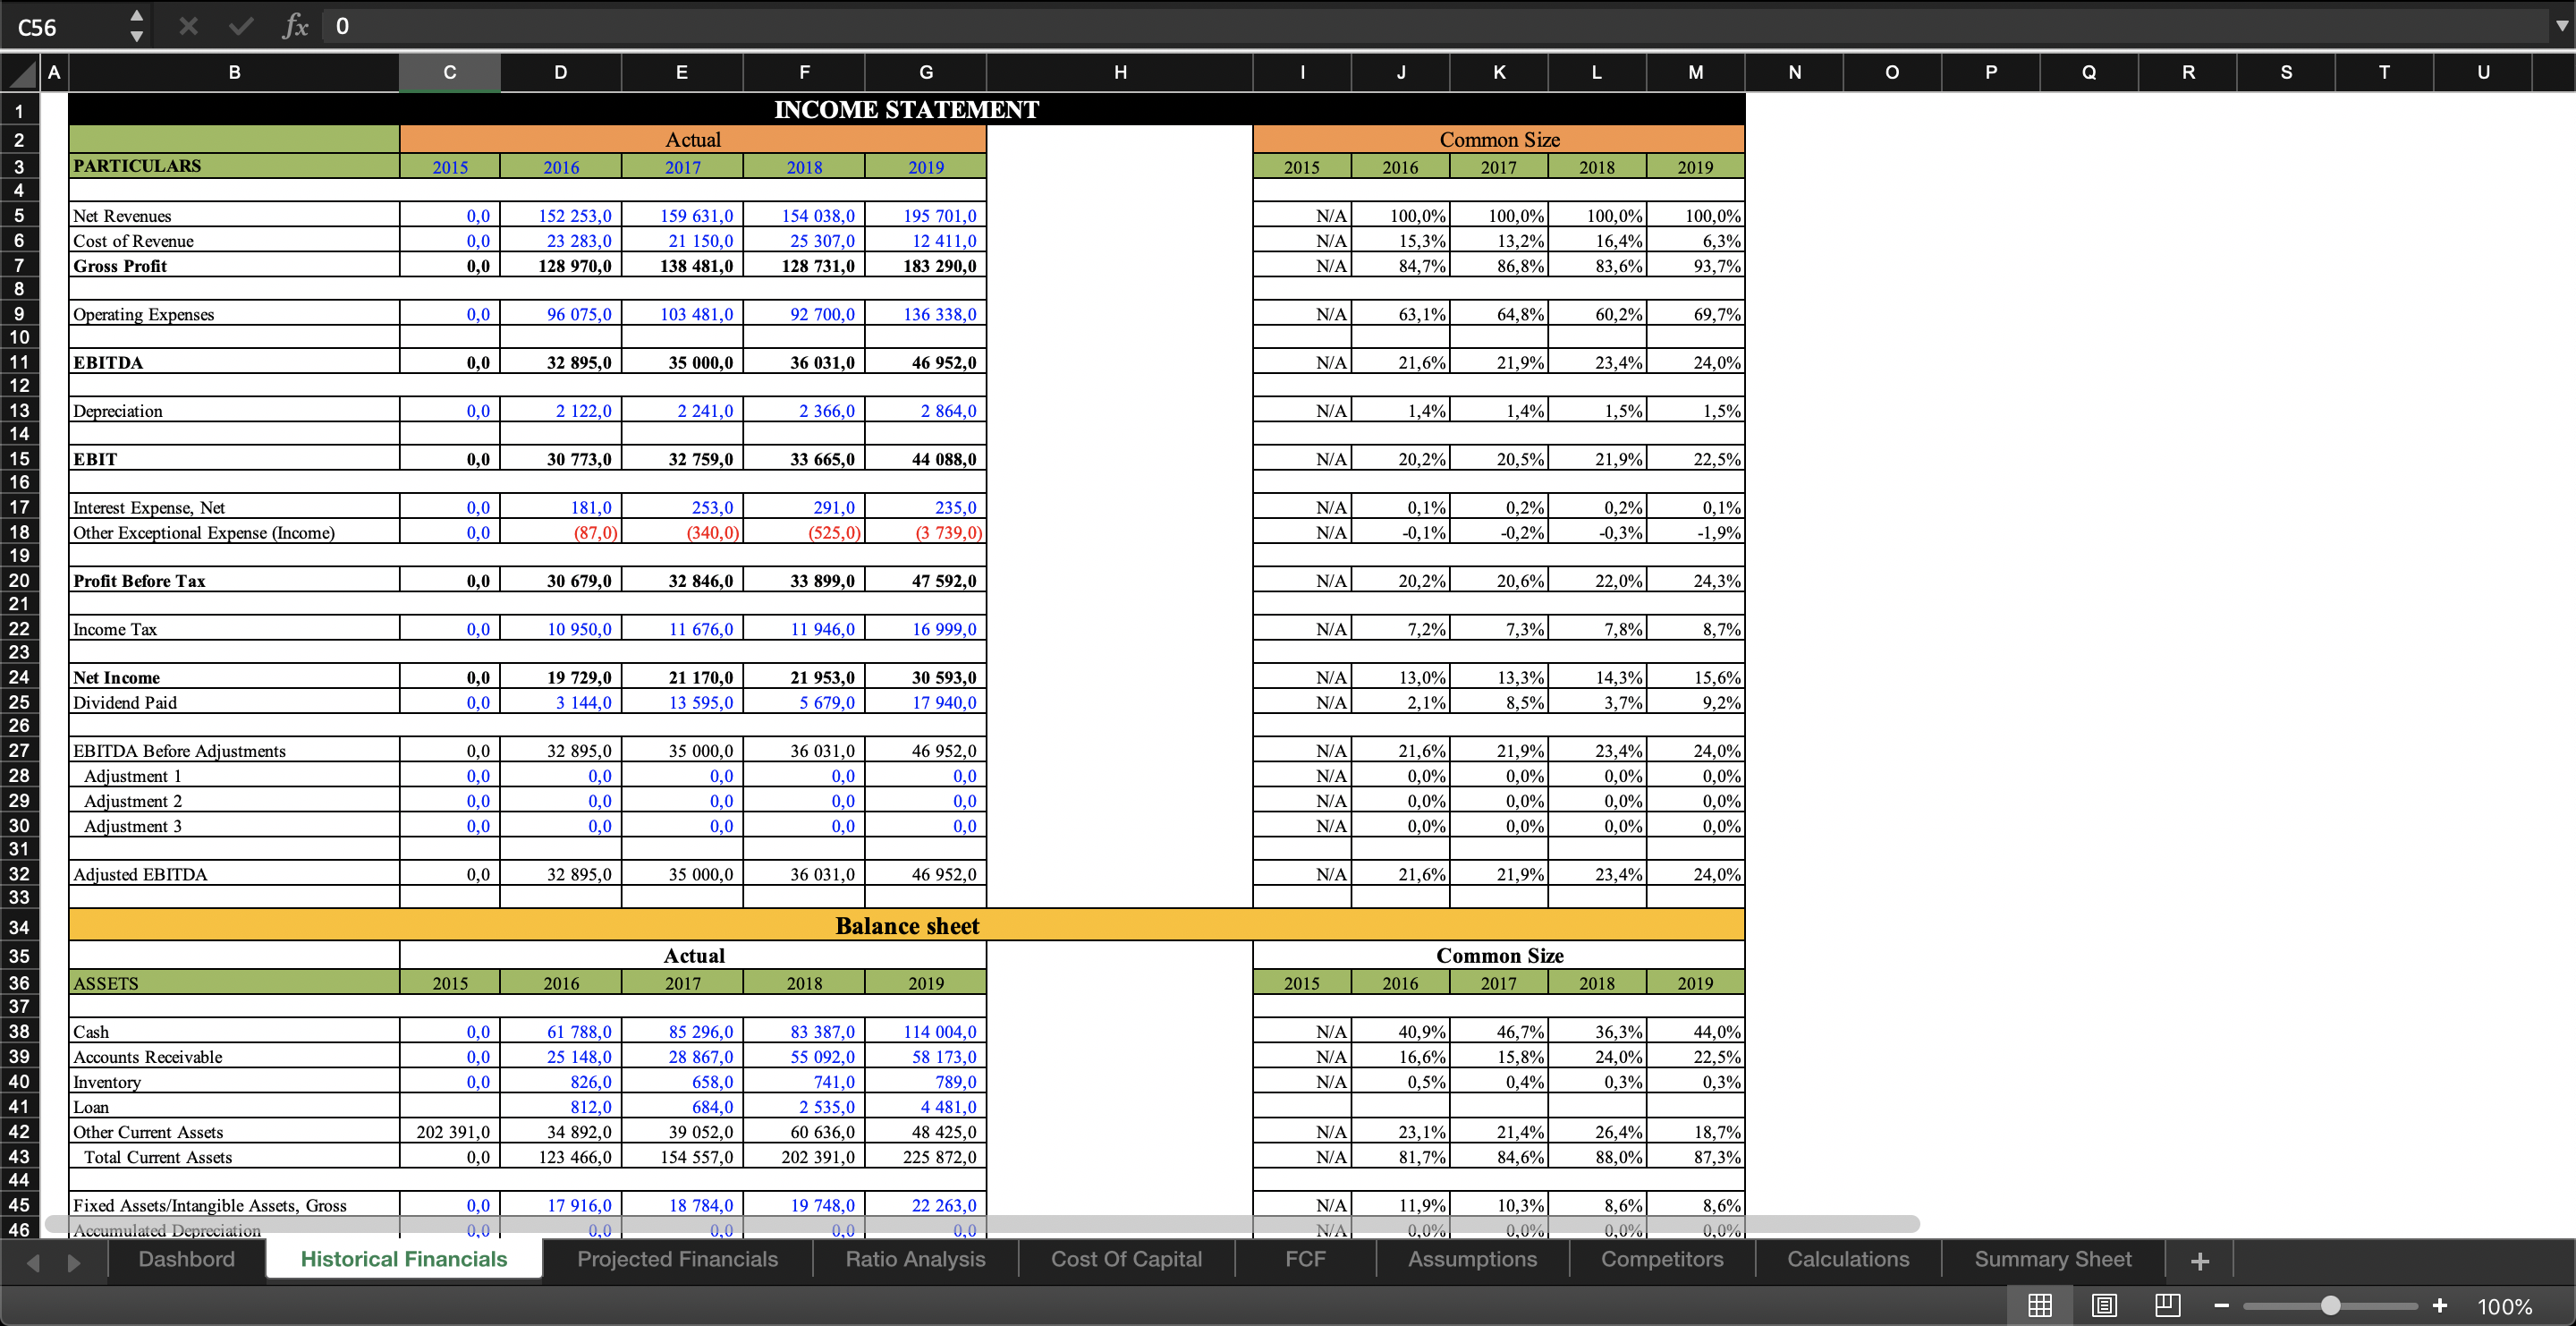
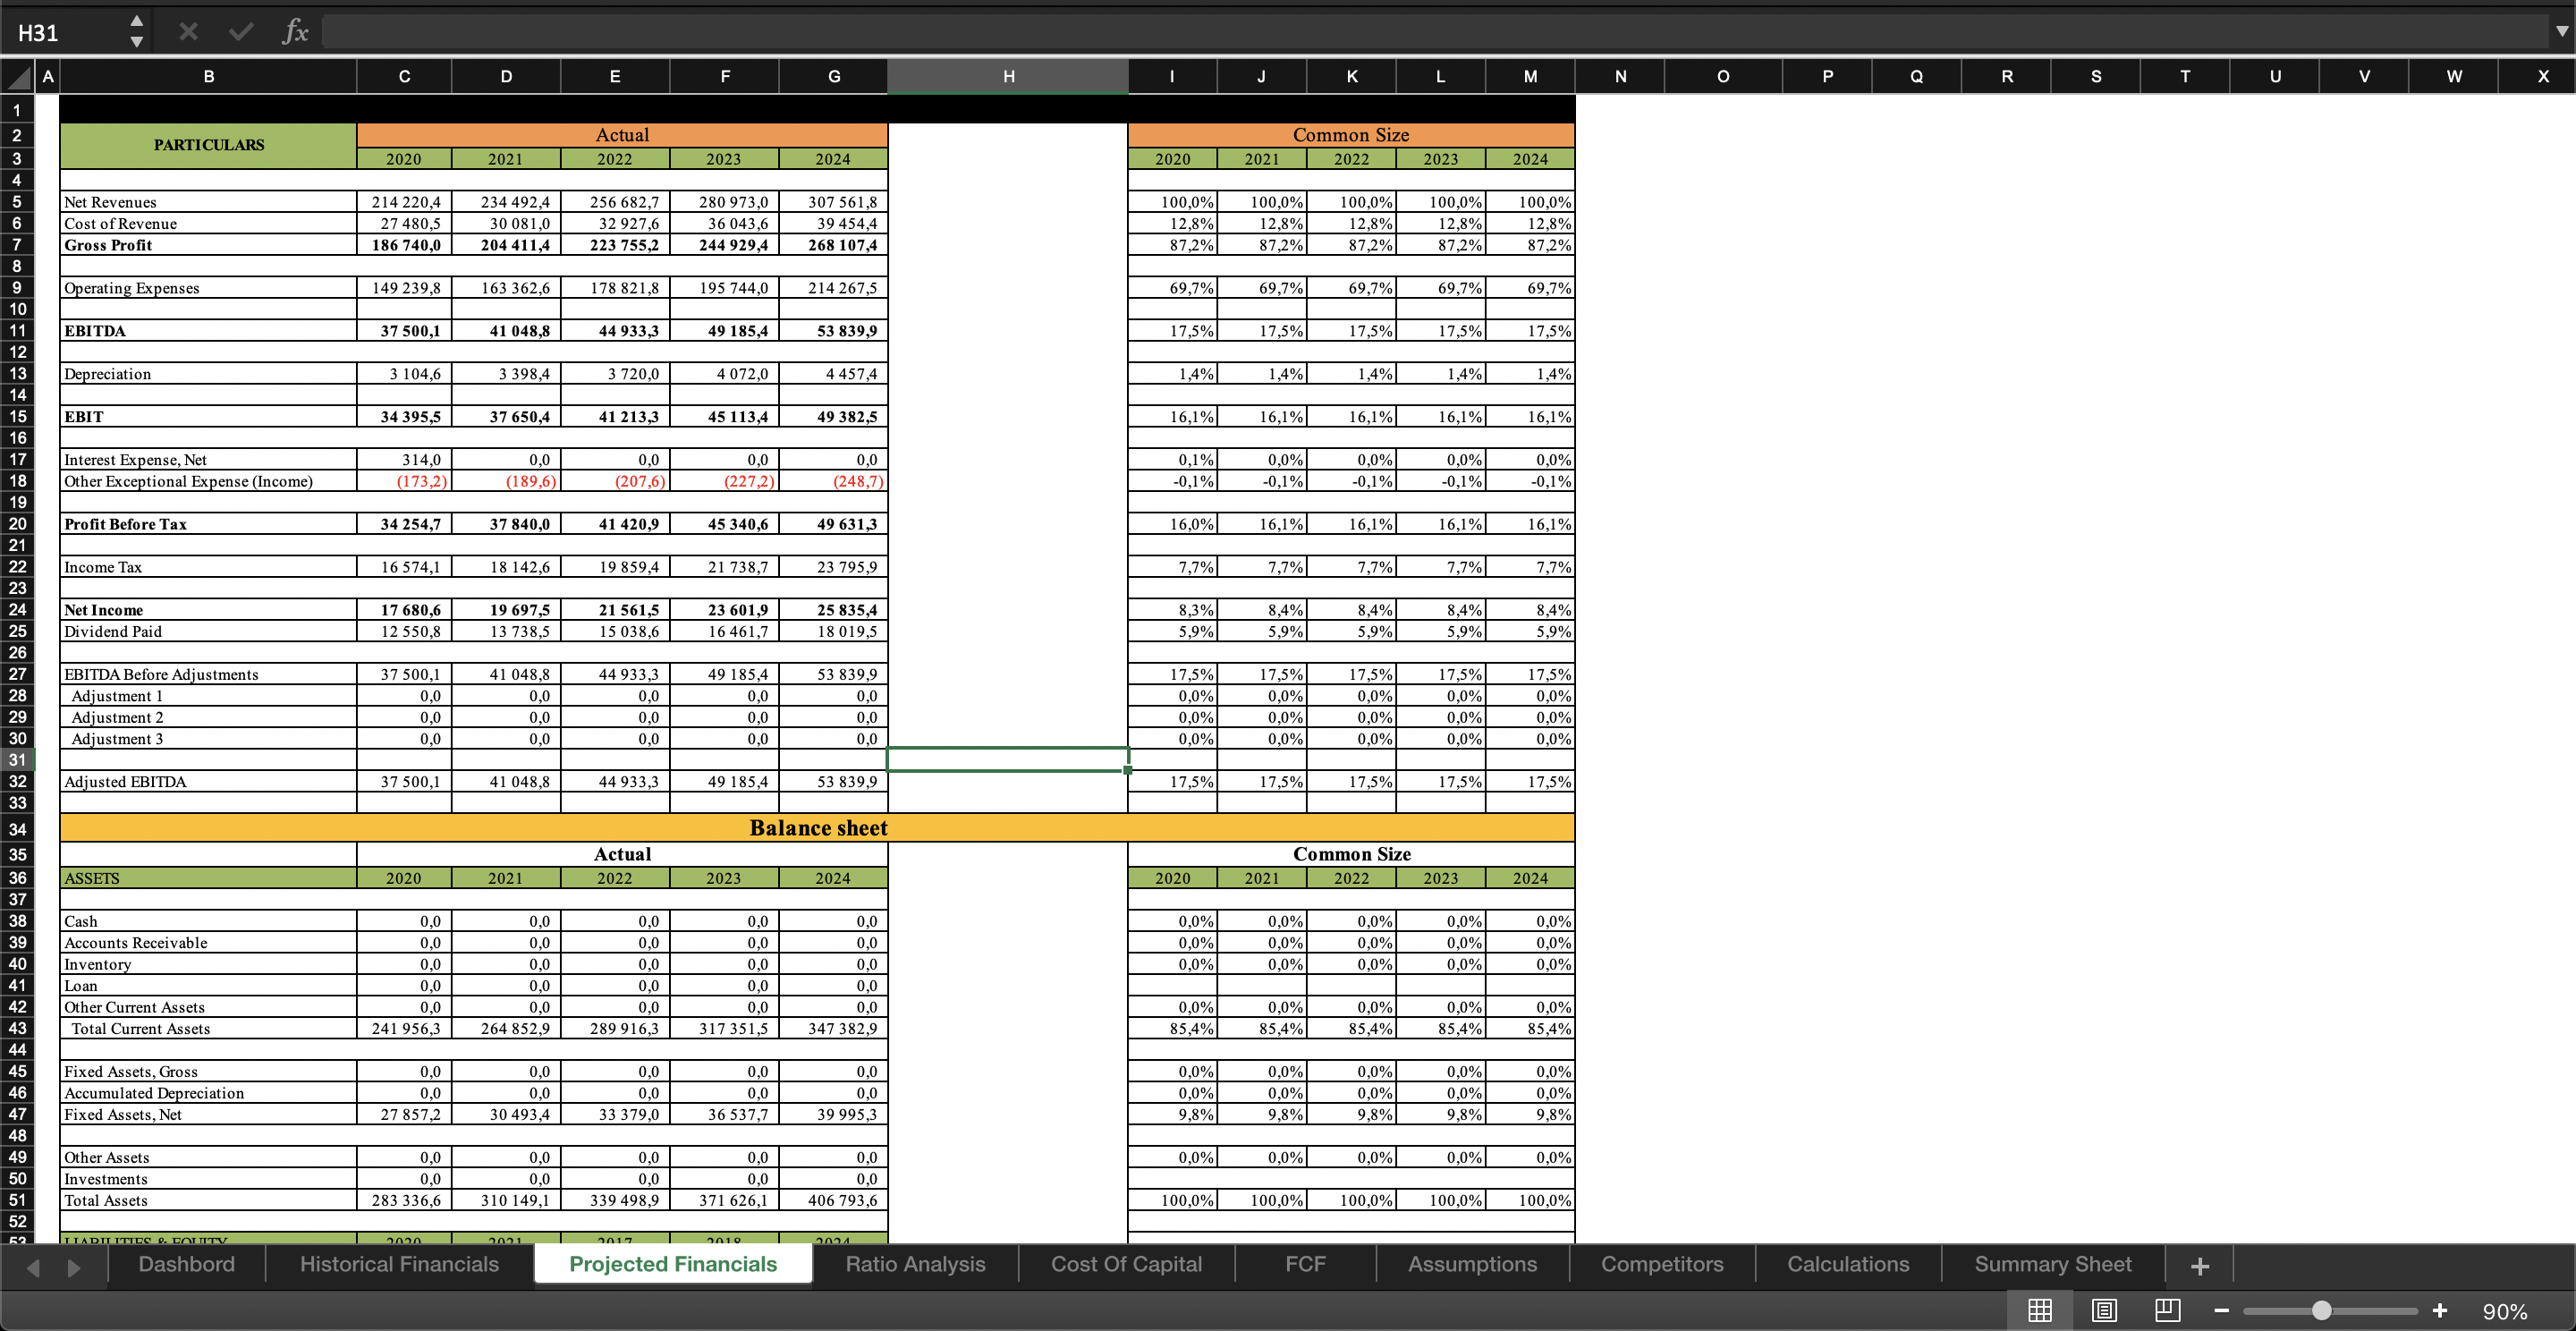
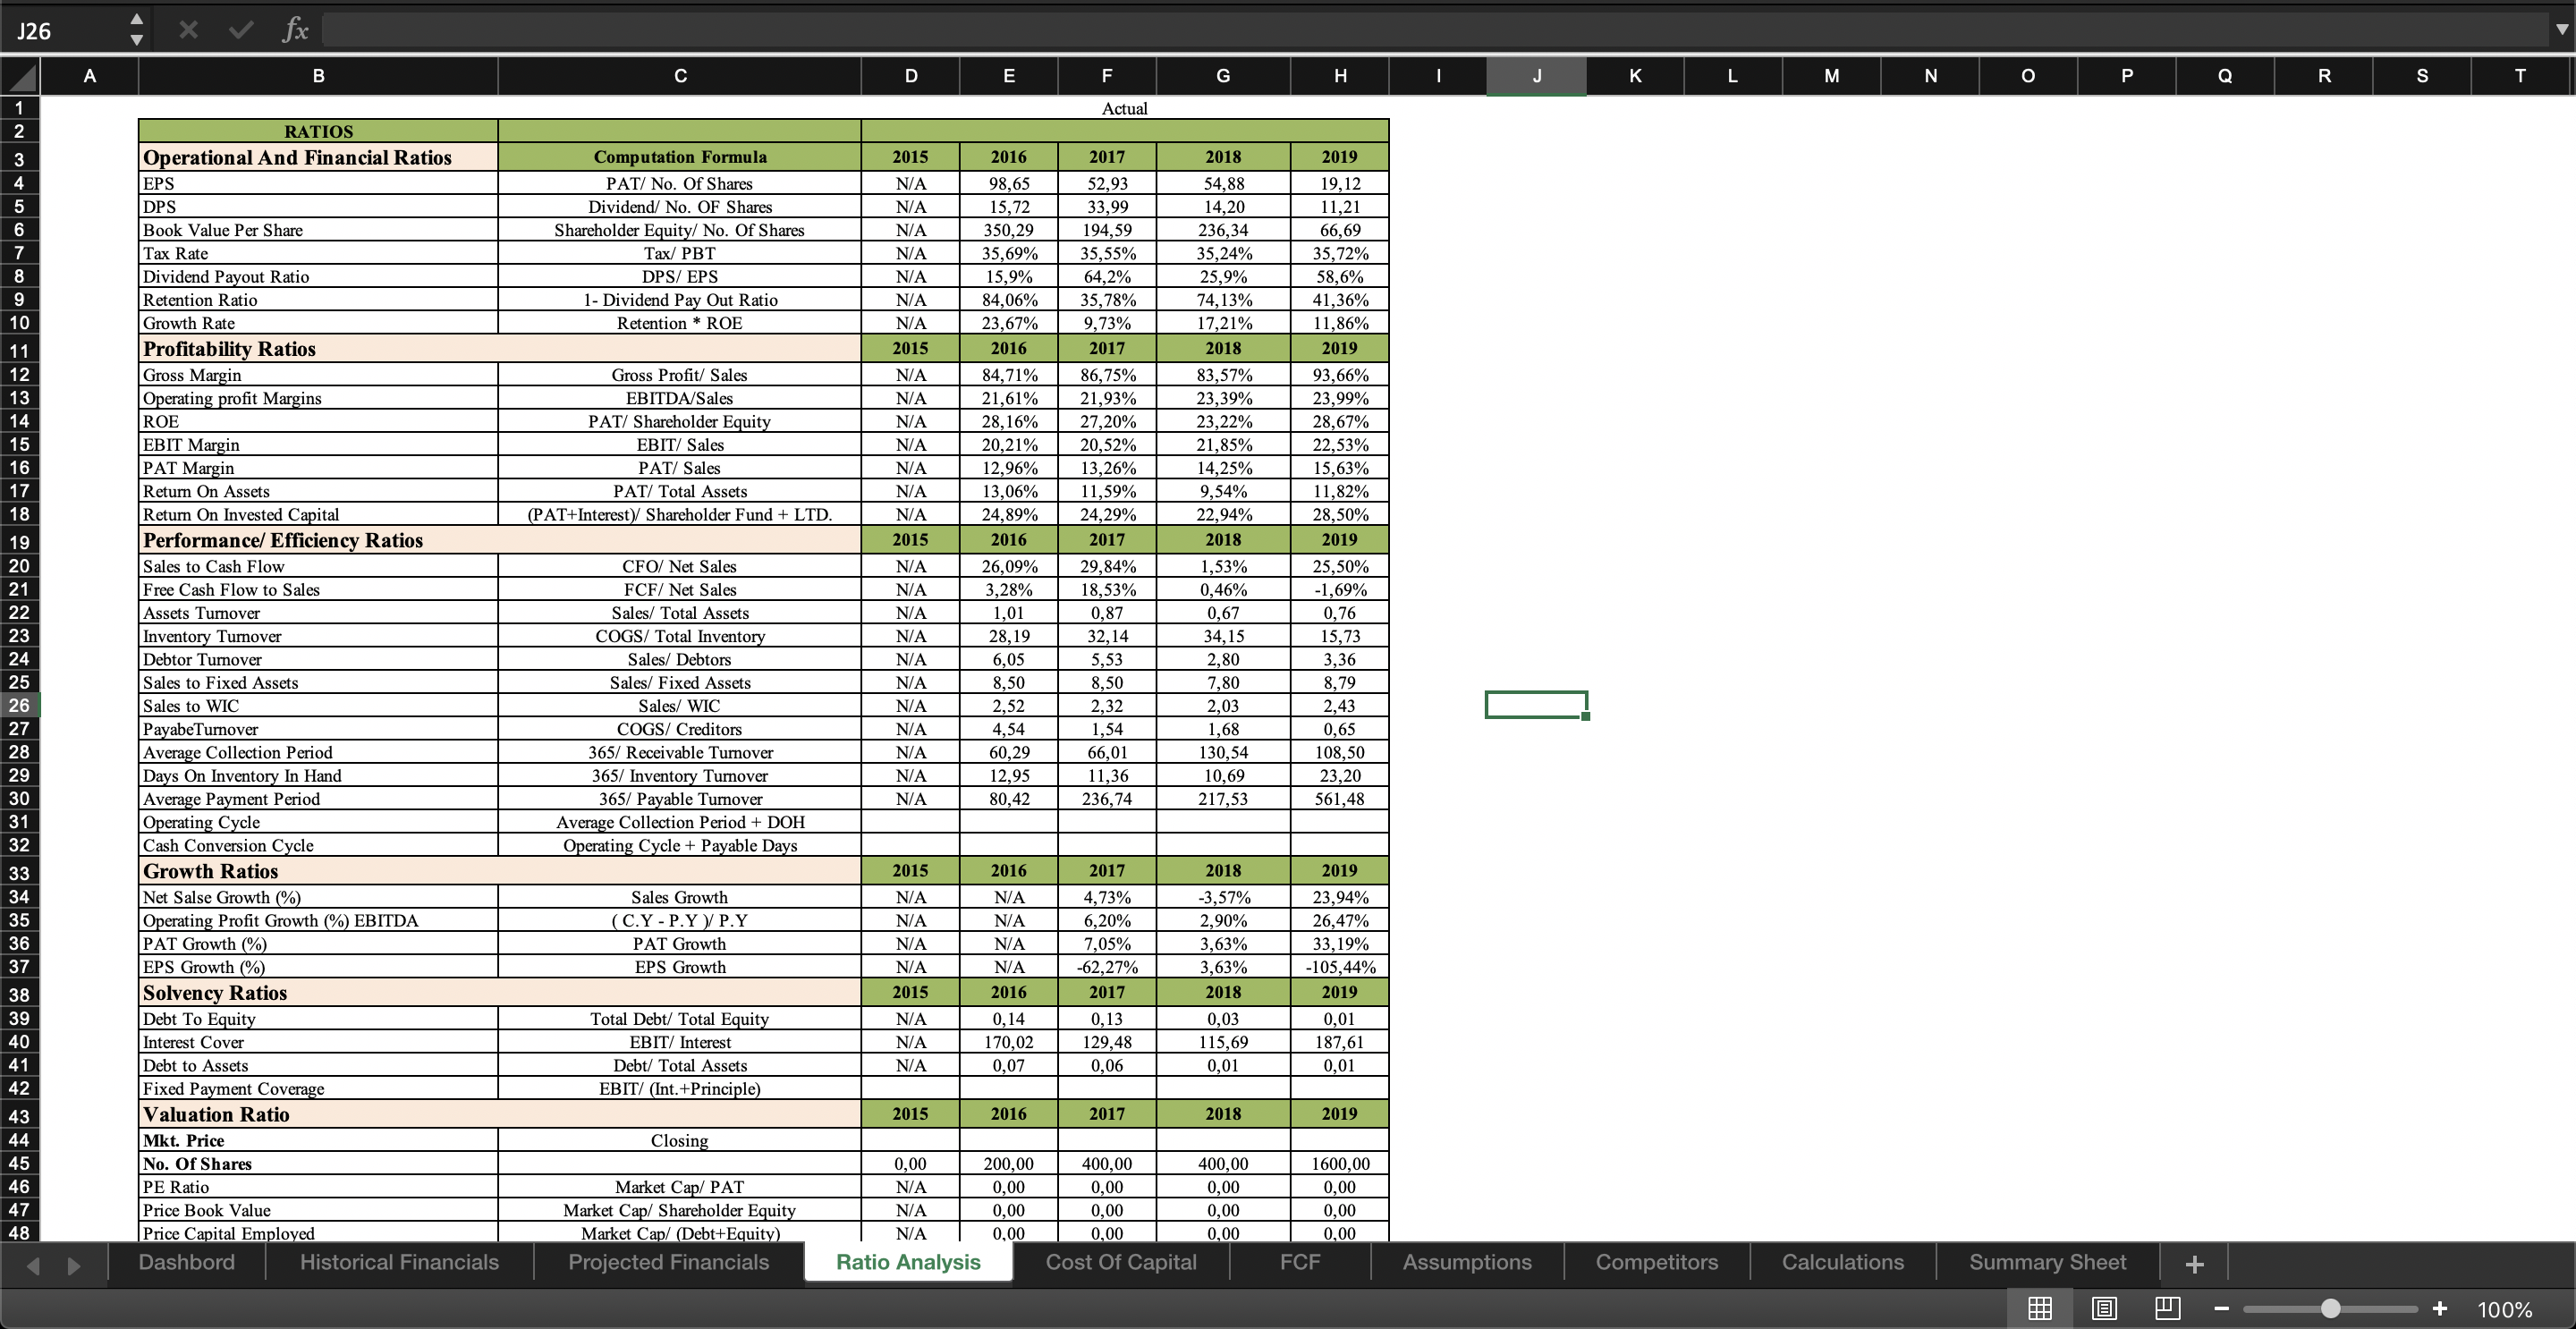
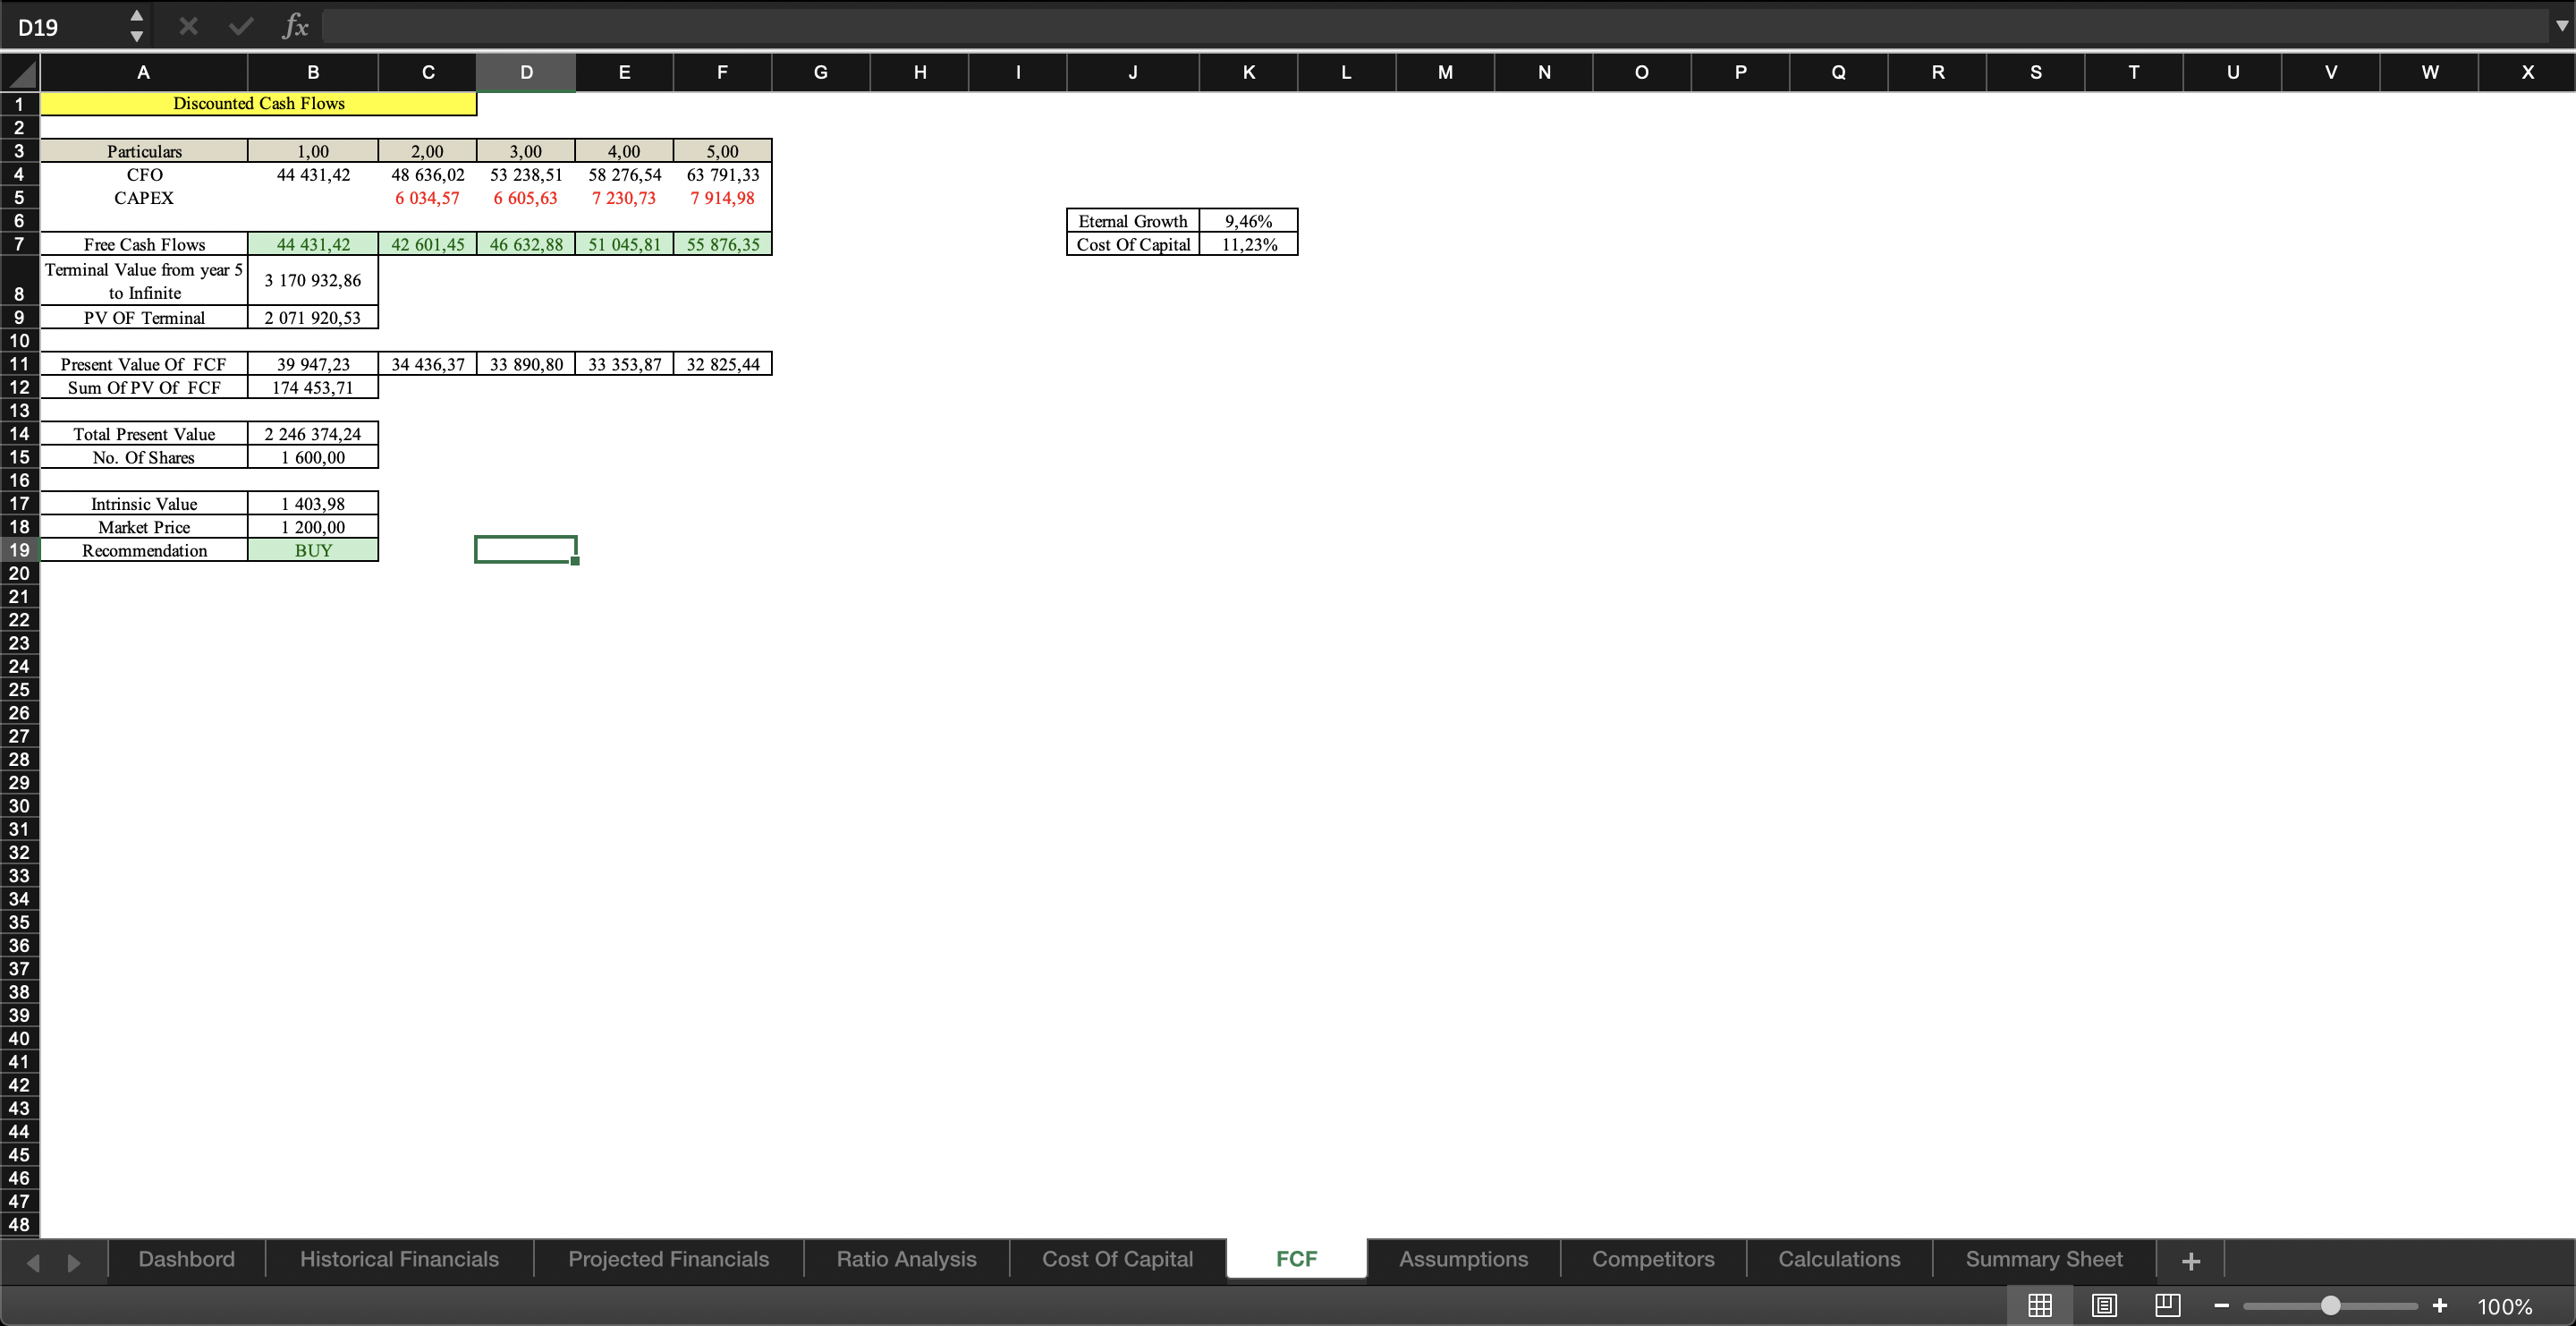
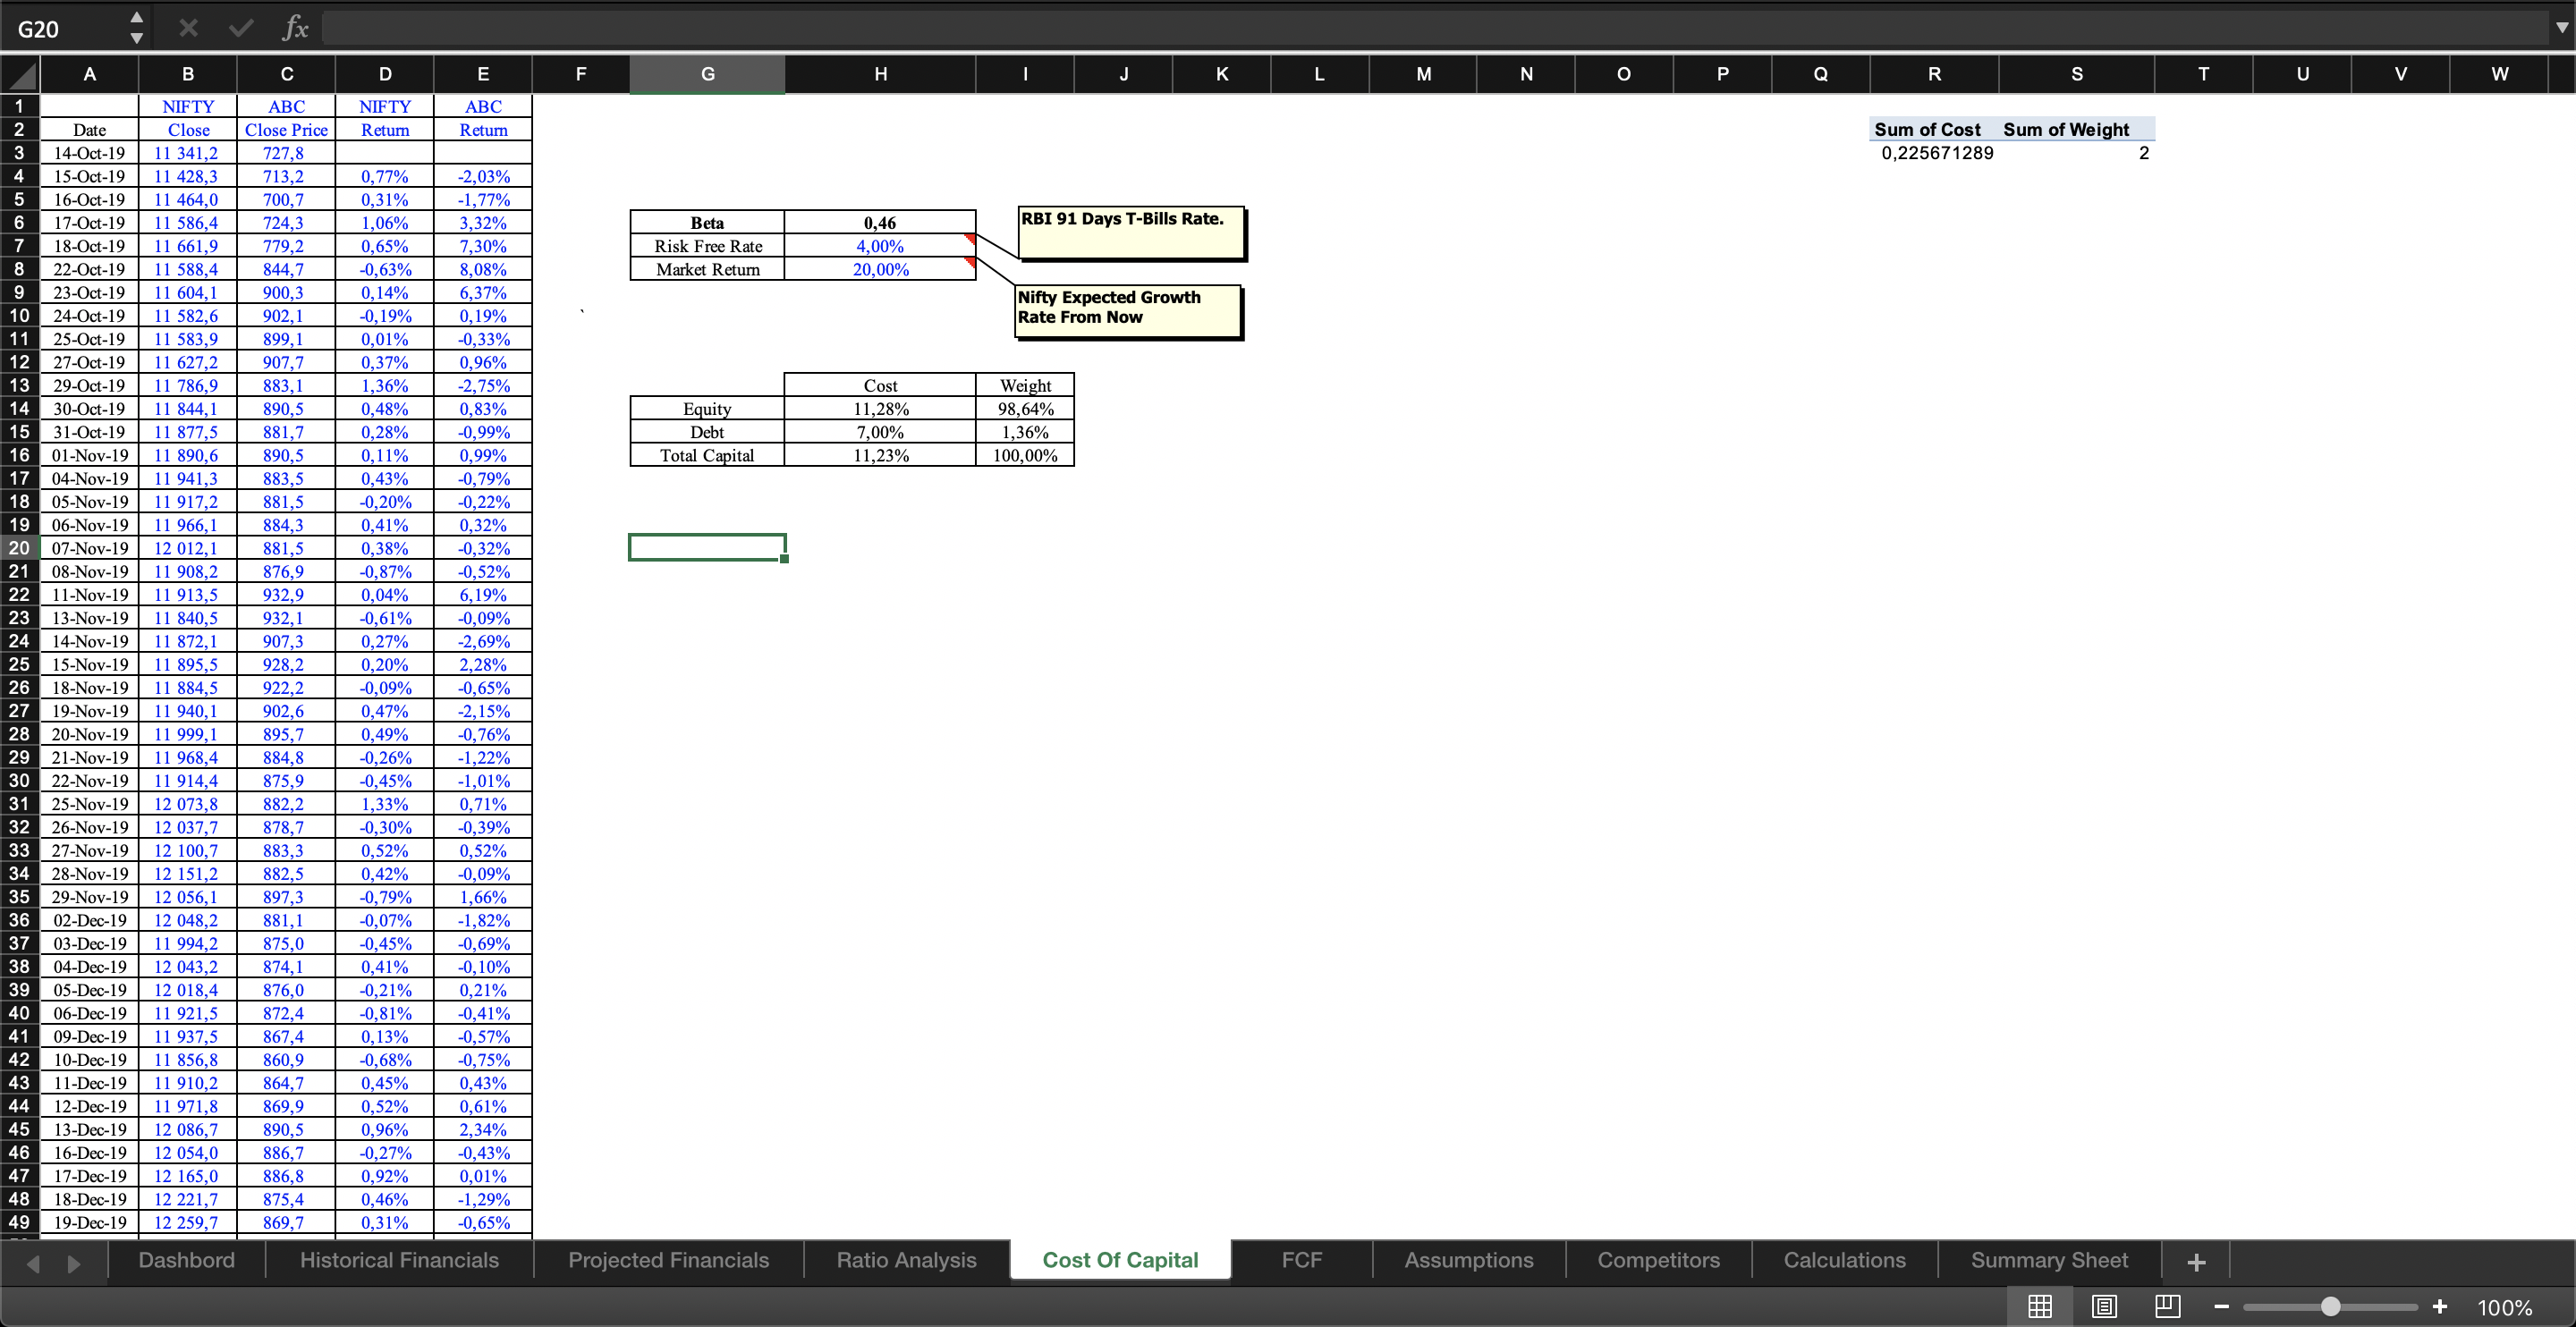
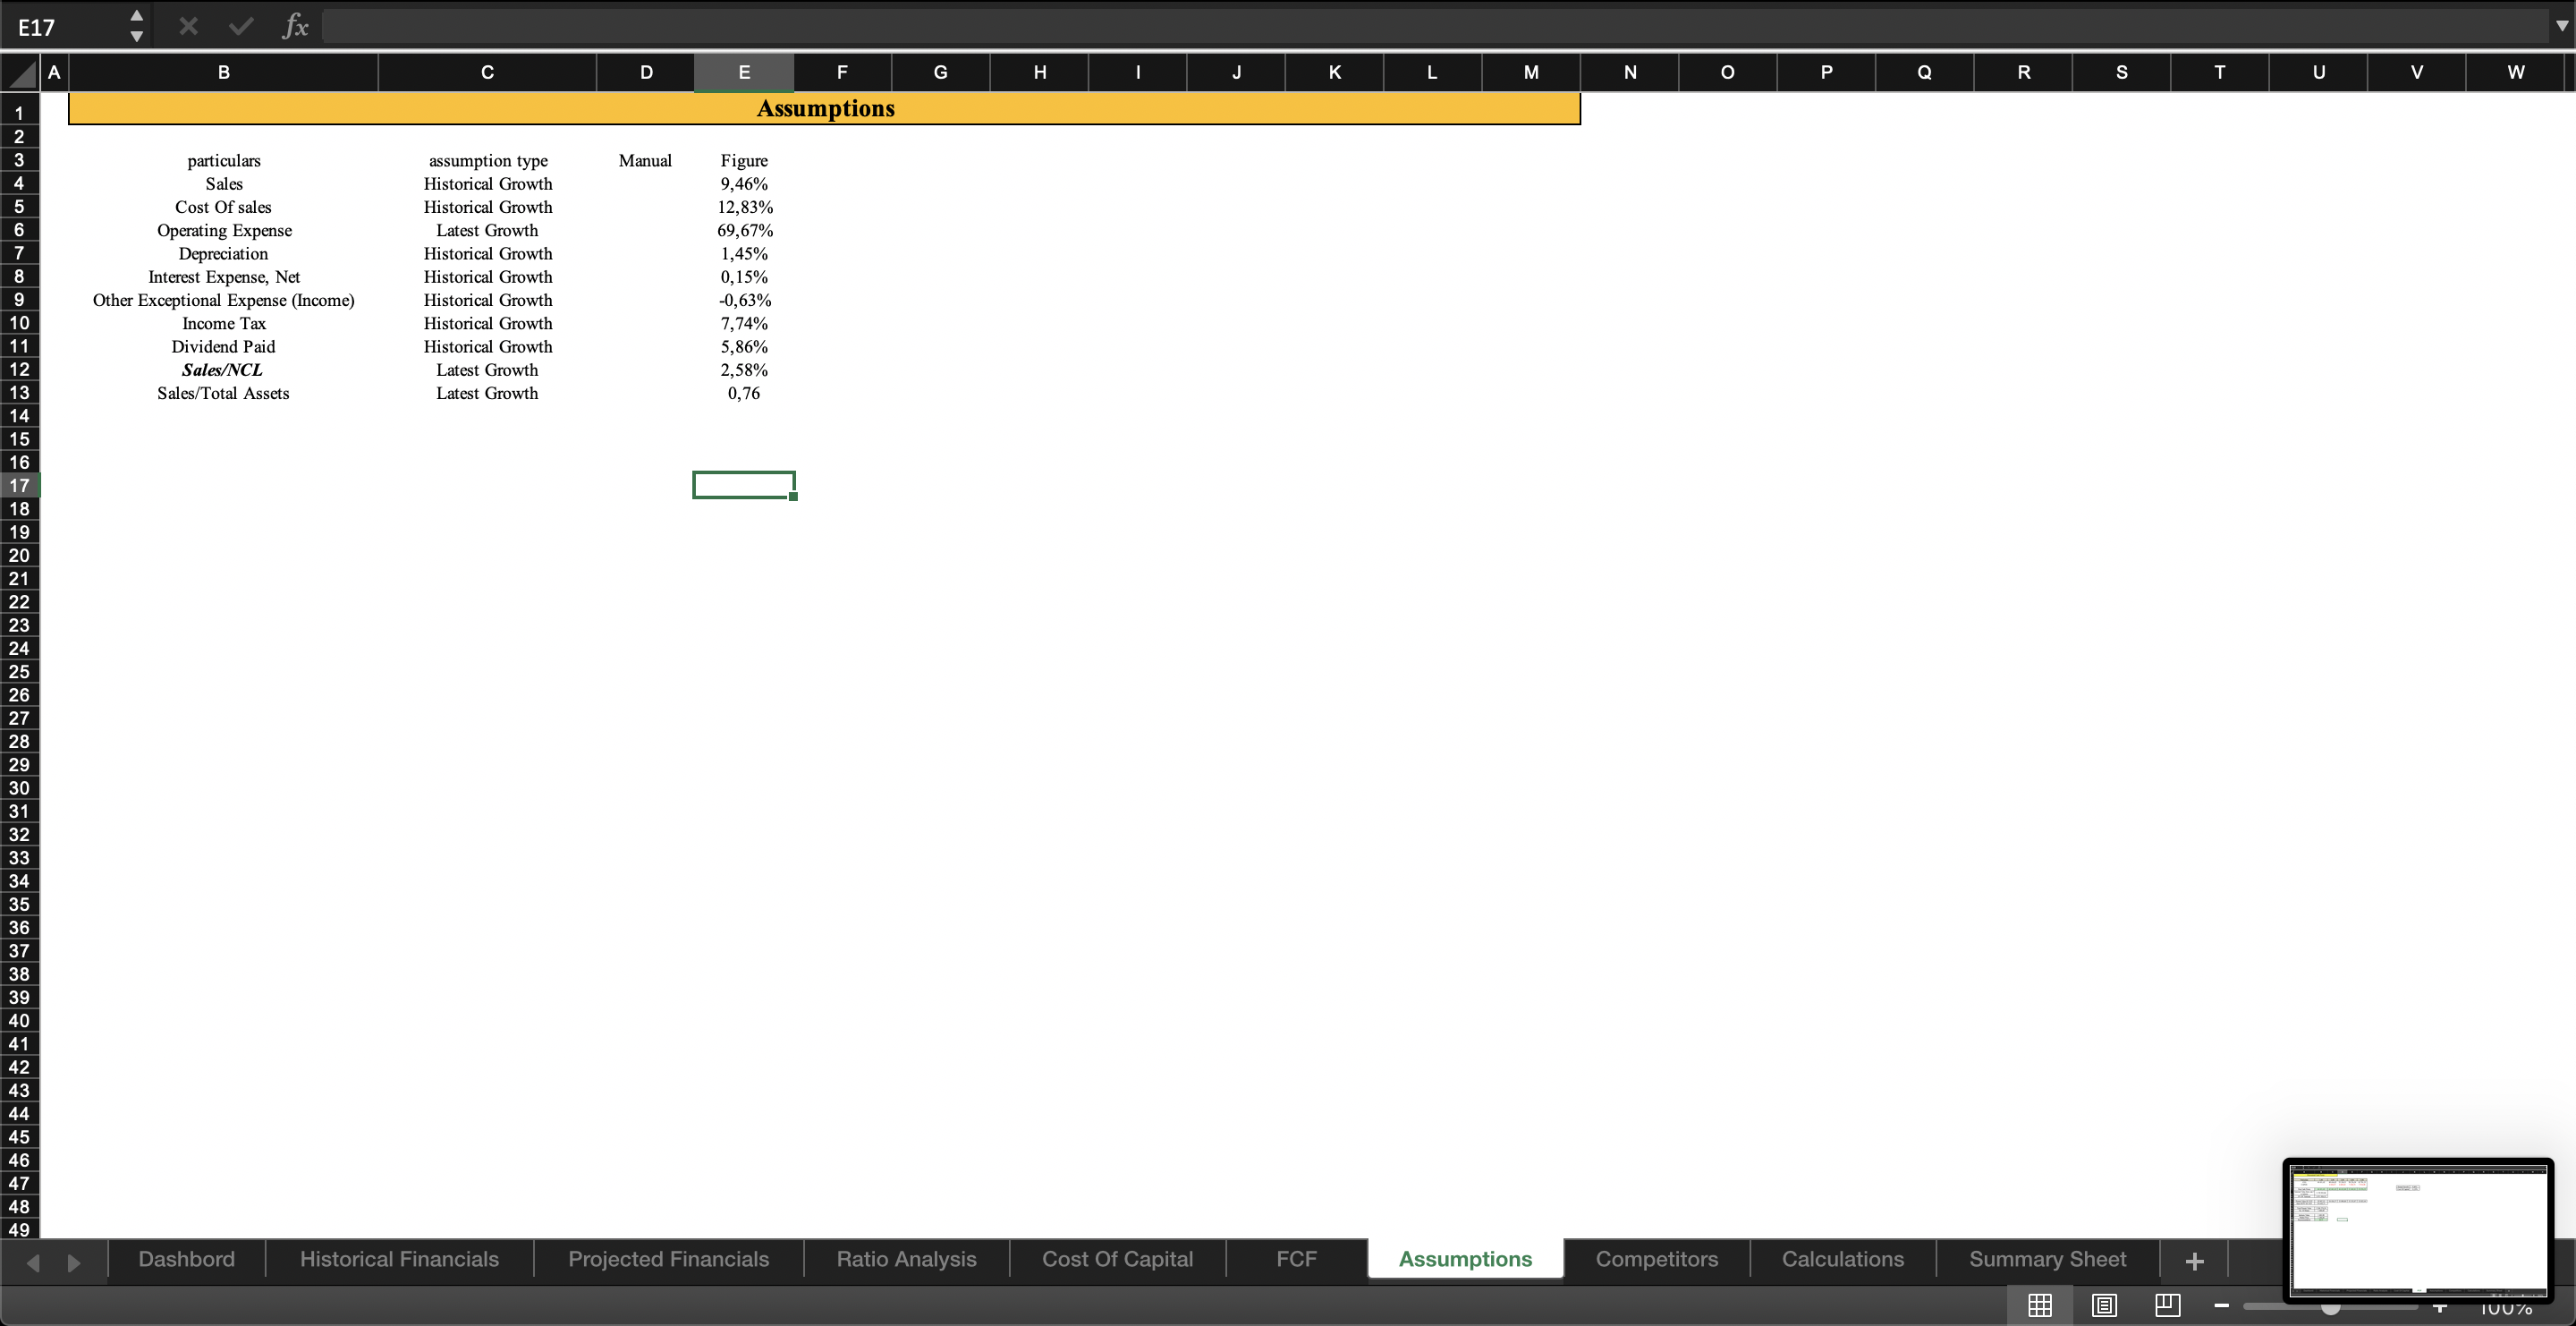
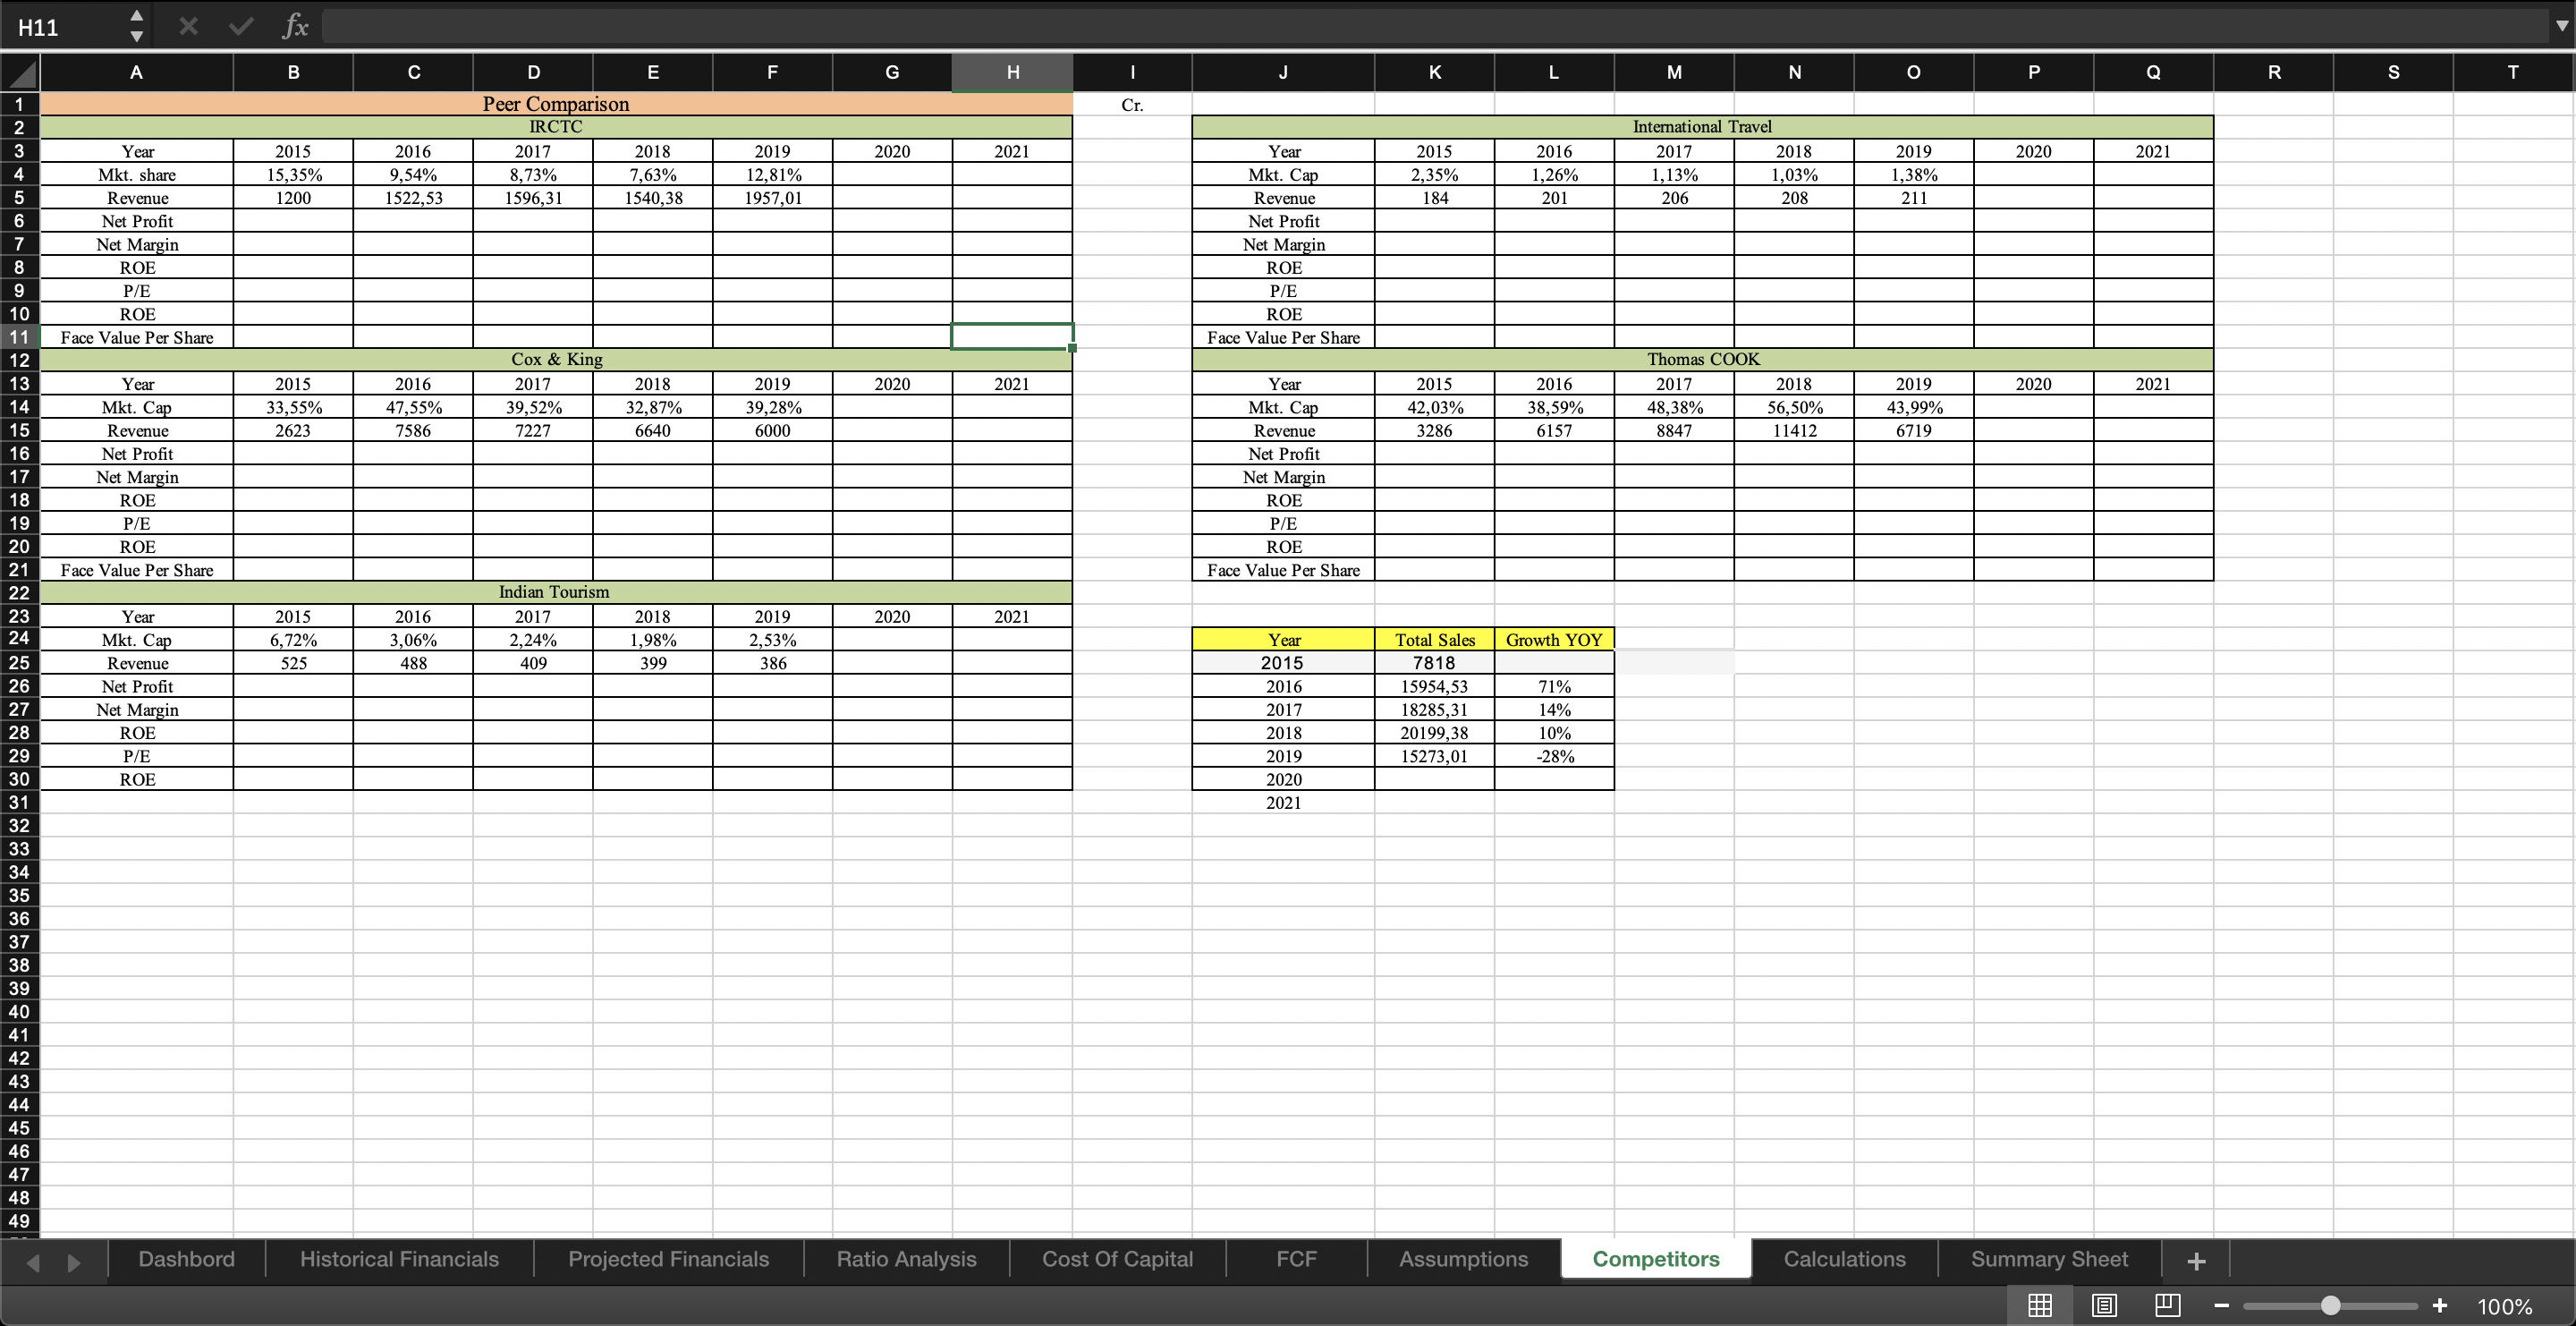
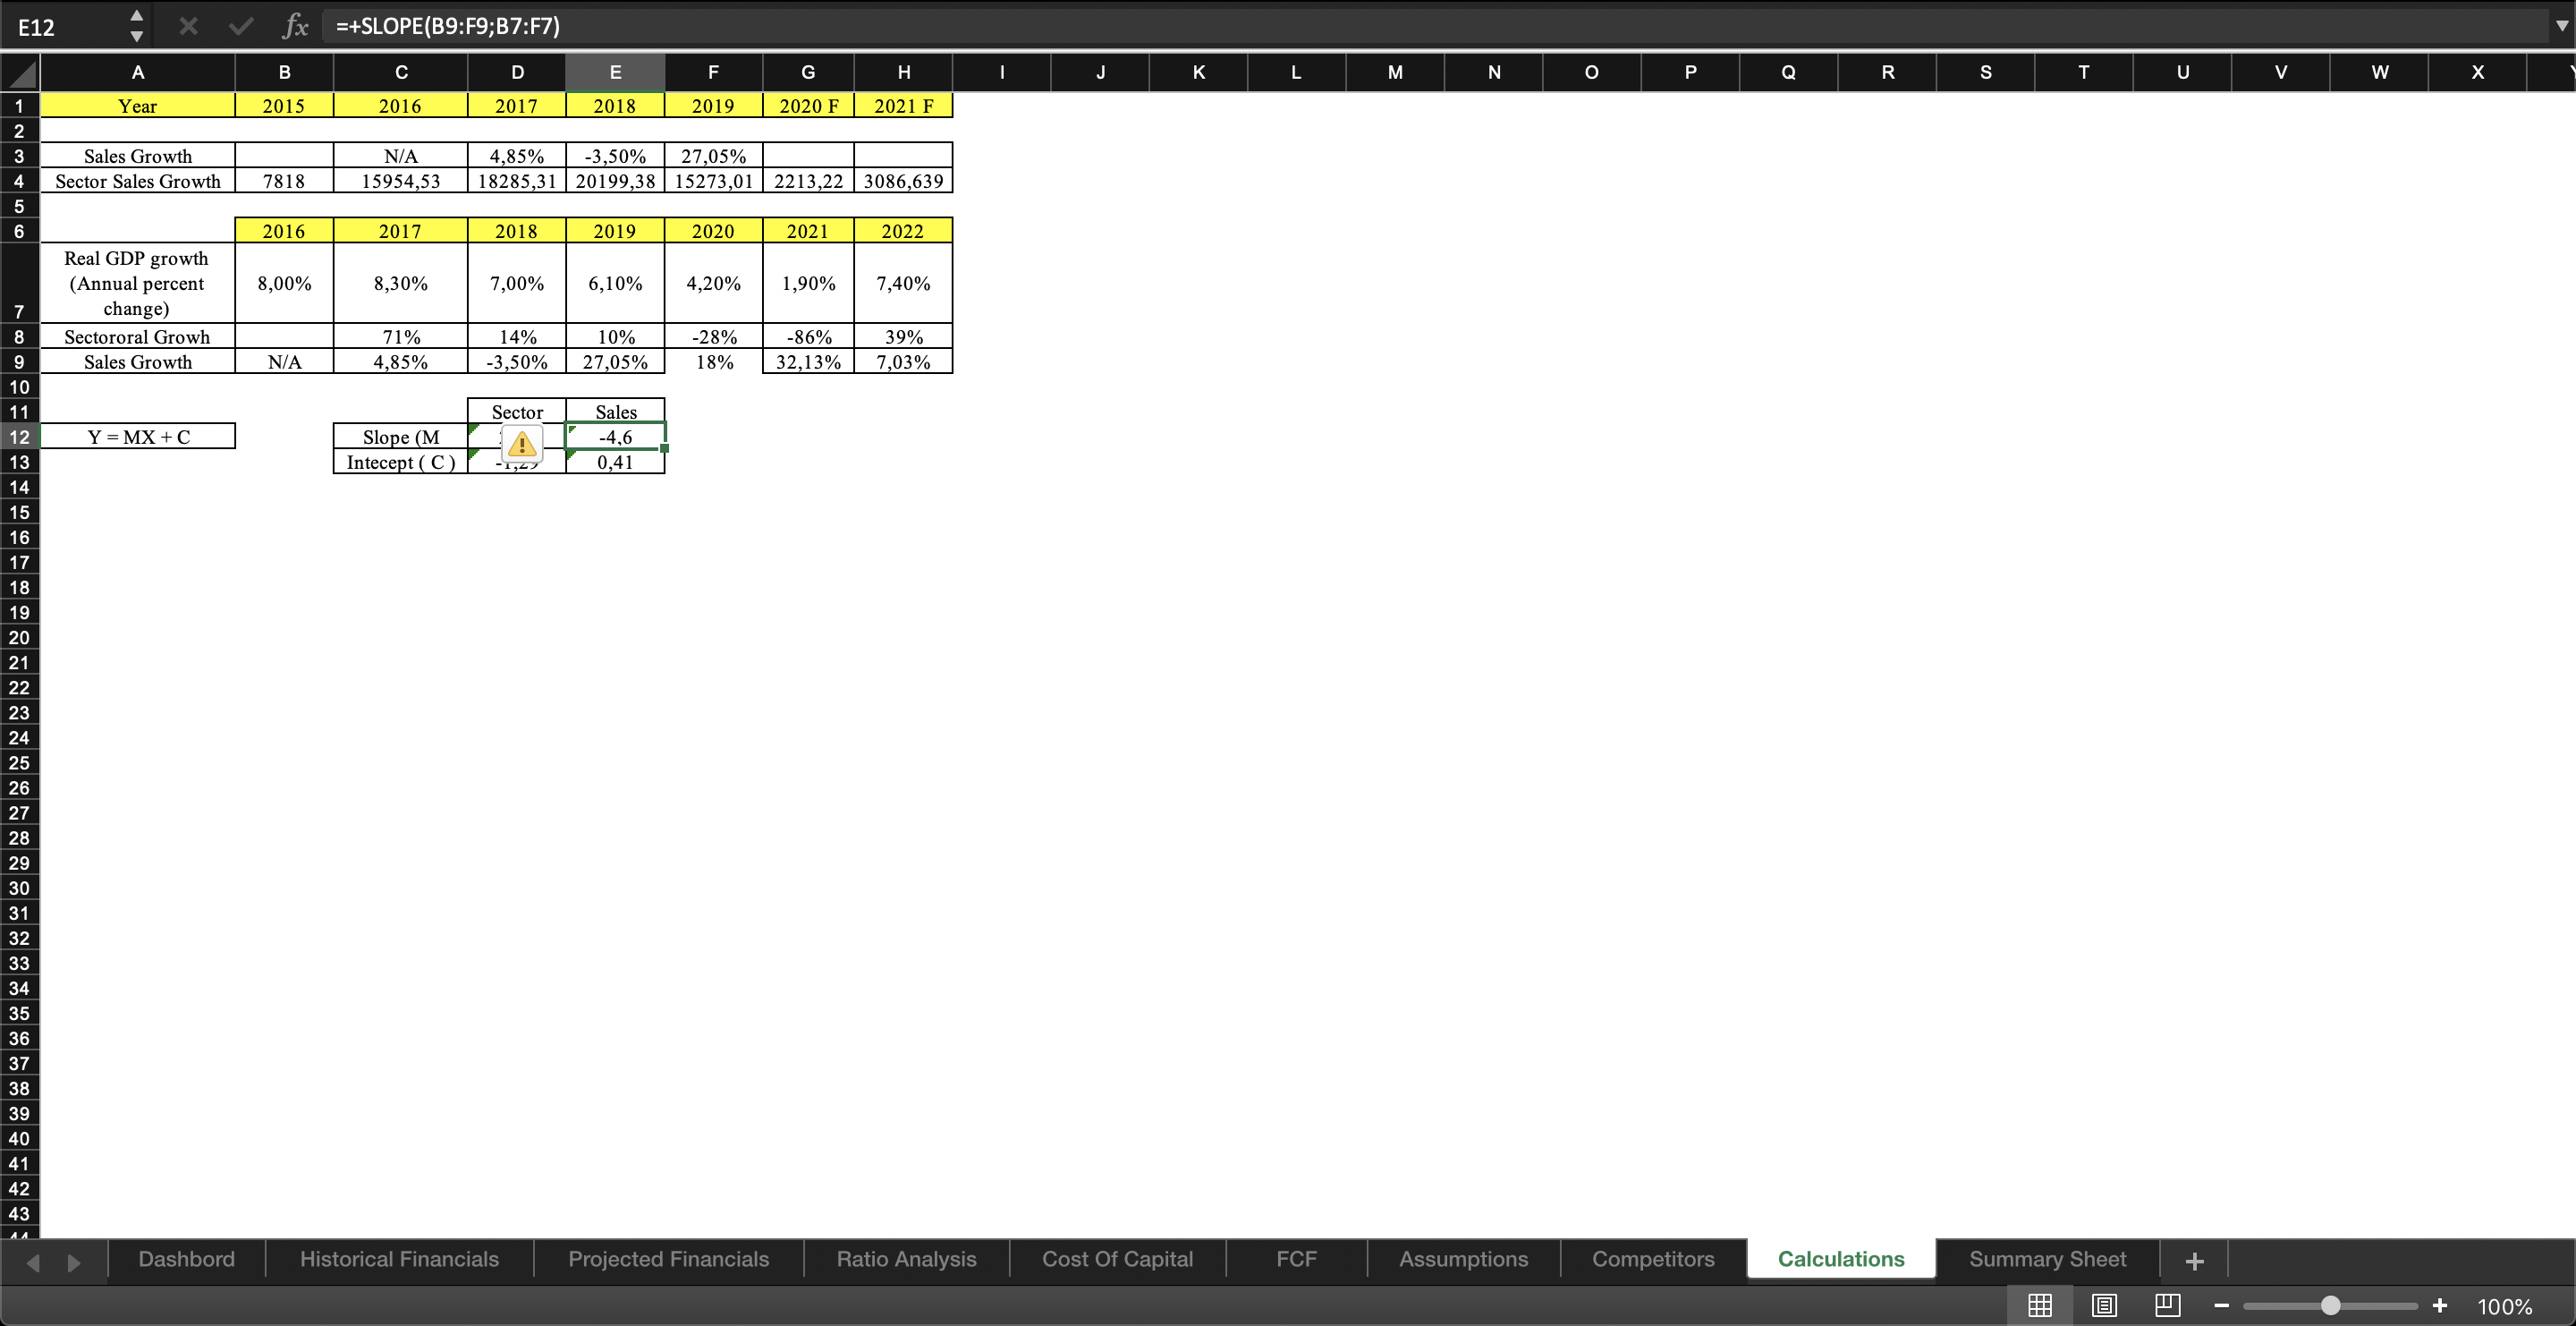
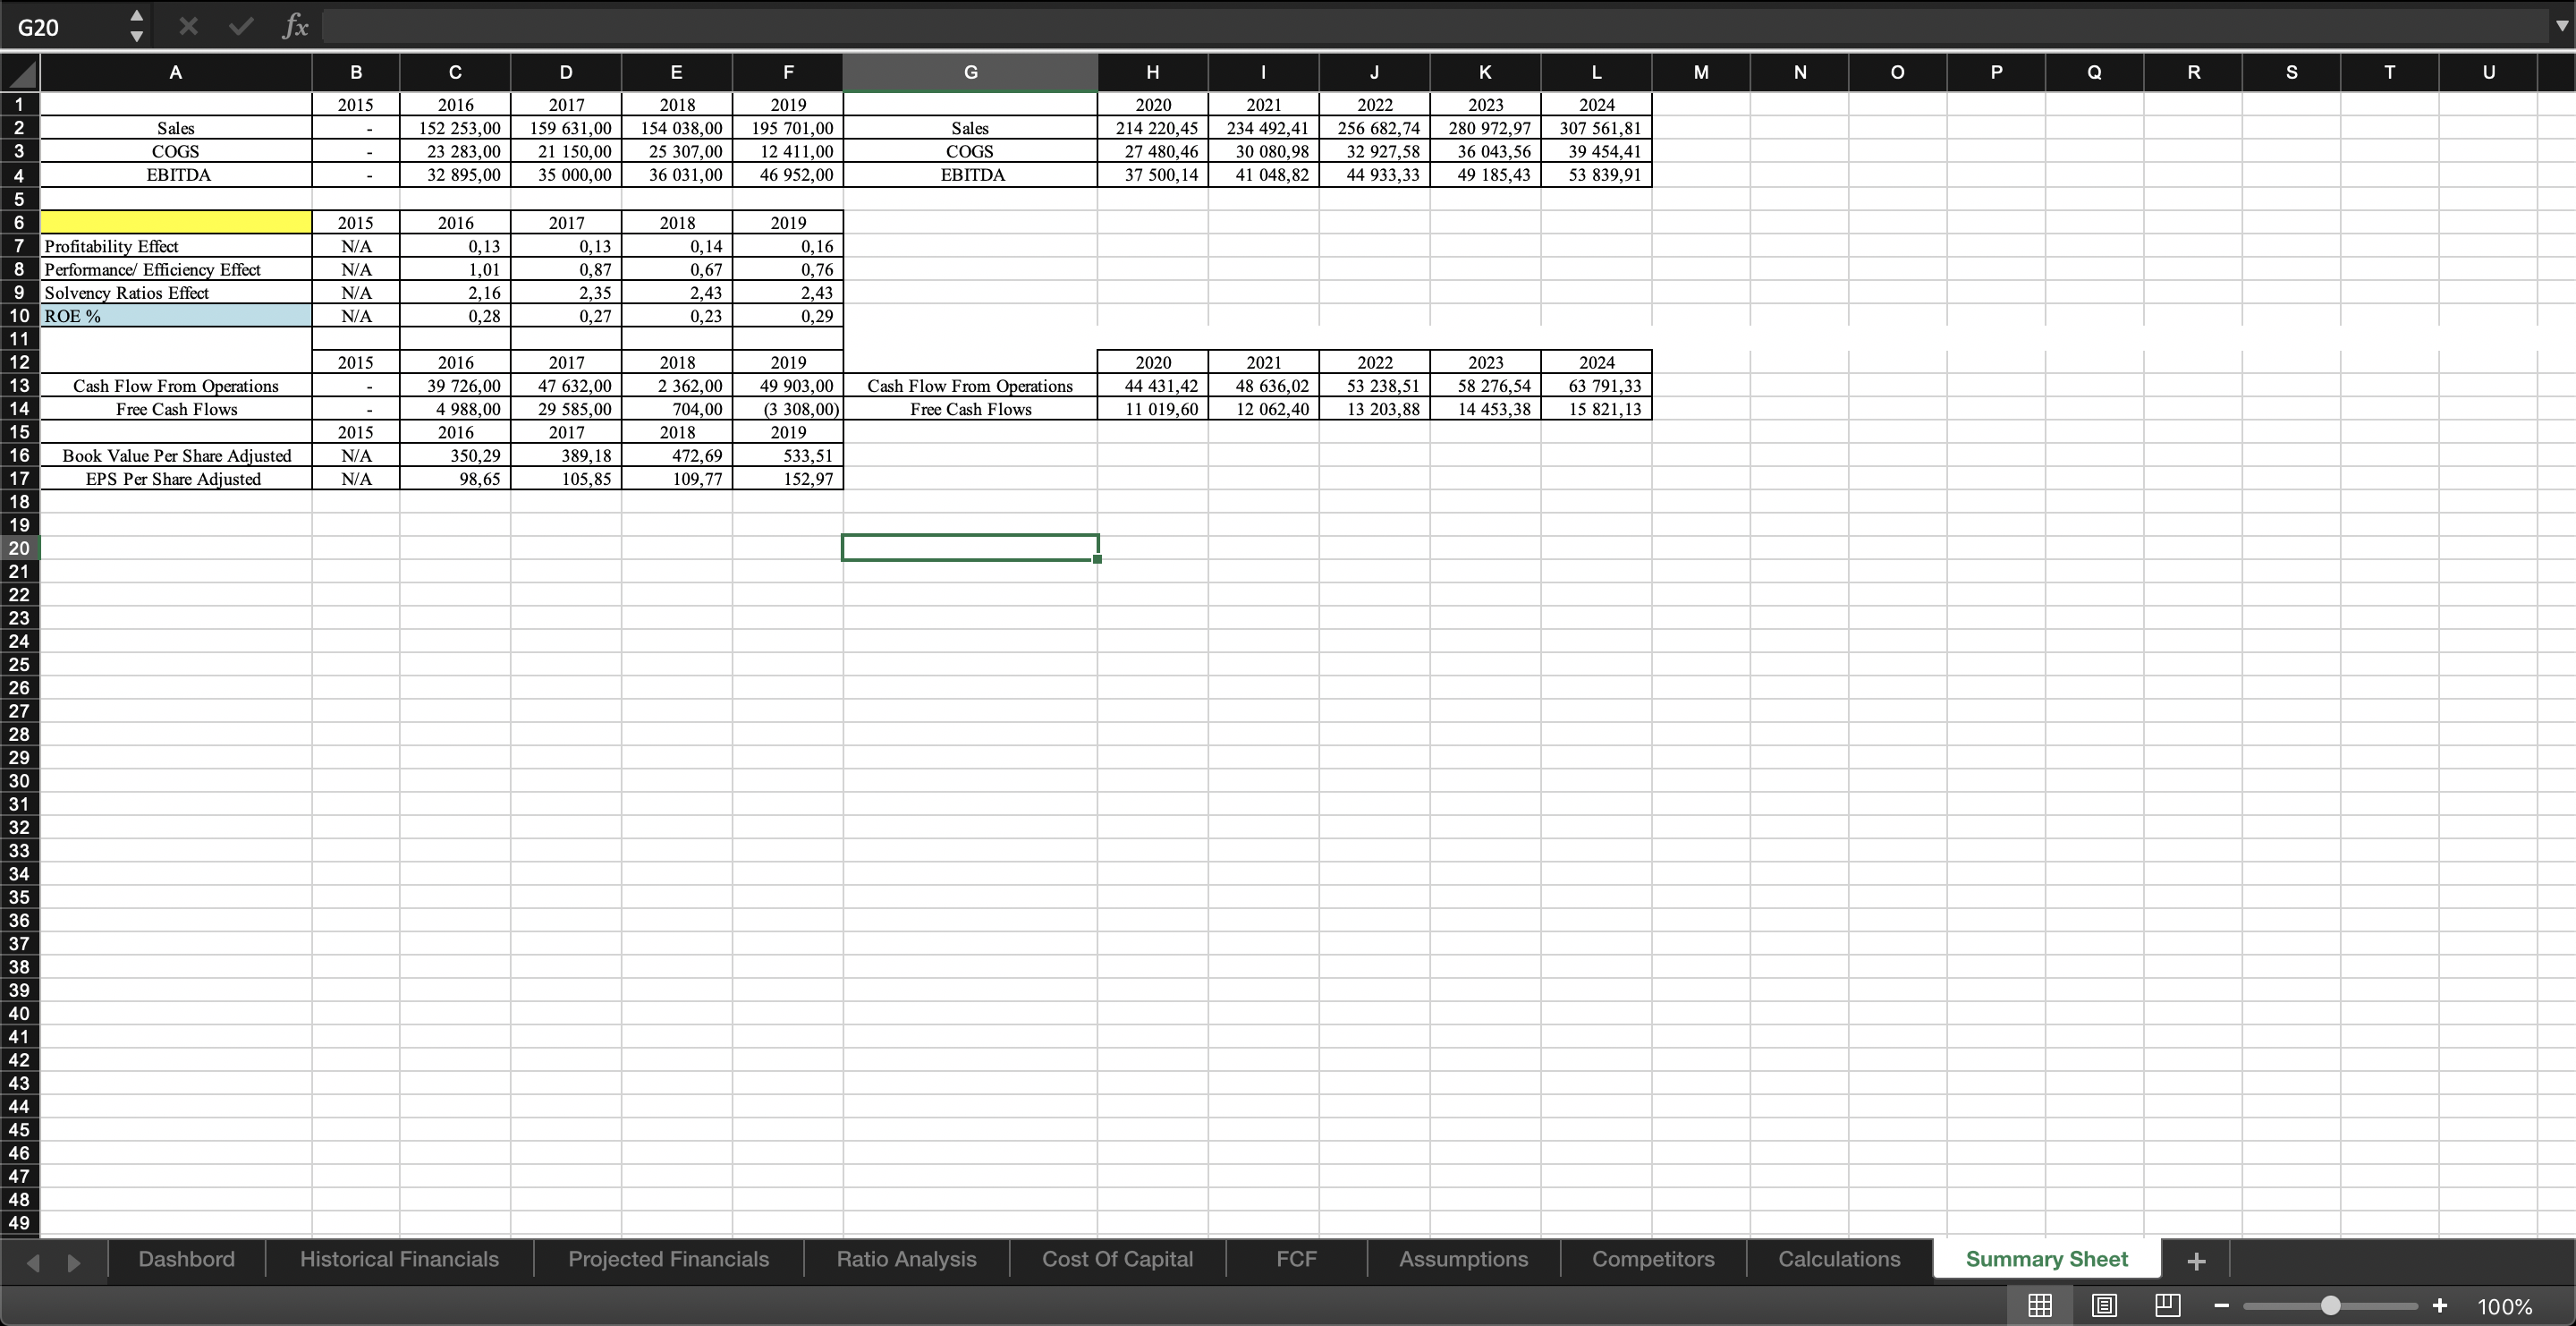
Financial Statement Analysis Excel Model.
Financial Statement Analysis Tool in Microsoft Excel.
Further information
Quantitative Analyse Of A company
In Combination With Quality Tool (Business Analysis)
Standalone
