Subscription Cohort, Churn & Retention Analyzer with NRR, GRR and LTV/CAC (Excel)

One row per customer per month becomes cohort triangles, NRR and GRR, an MRR movement bridge that ties, and LTV:CAC split by segment and channel.

Description
Most retention templates ask you to trust them. This one shows its working.

Give the workbook one row per customer per month - customer, segment, channel, cohort month, activity month, MRR - and six engine columns classify every month of every customer into new, expansion, contraction and churn. Everything else in the file is built from those six columns, so there is no second version of the truth anywhere.

WHAT COMES OUT

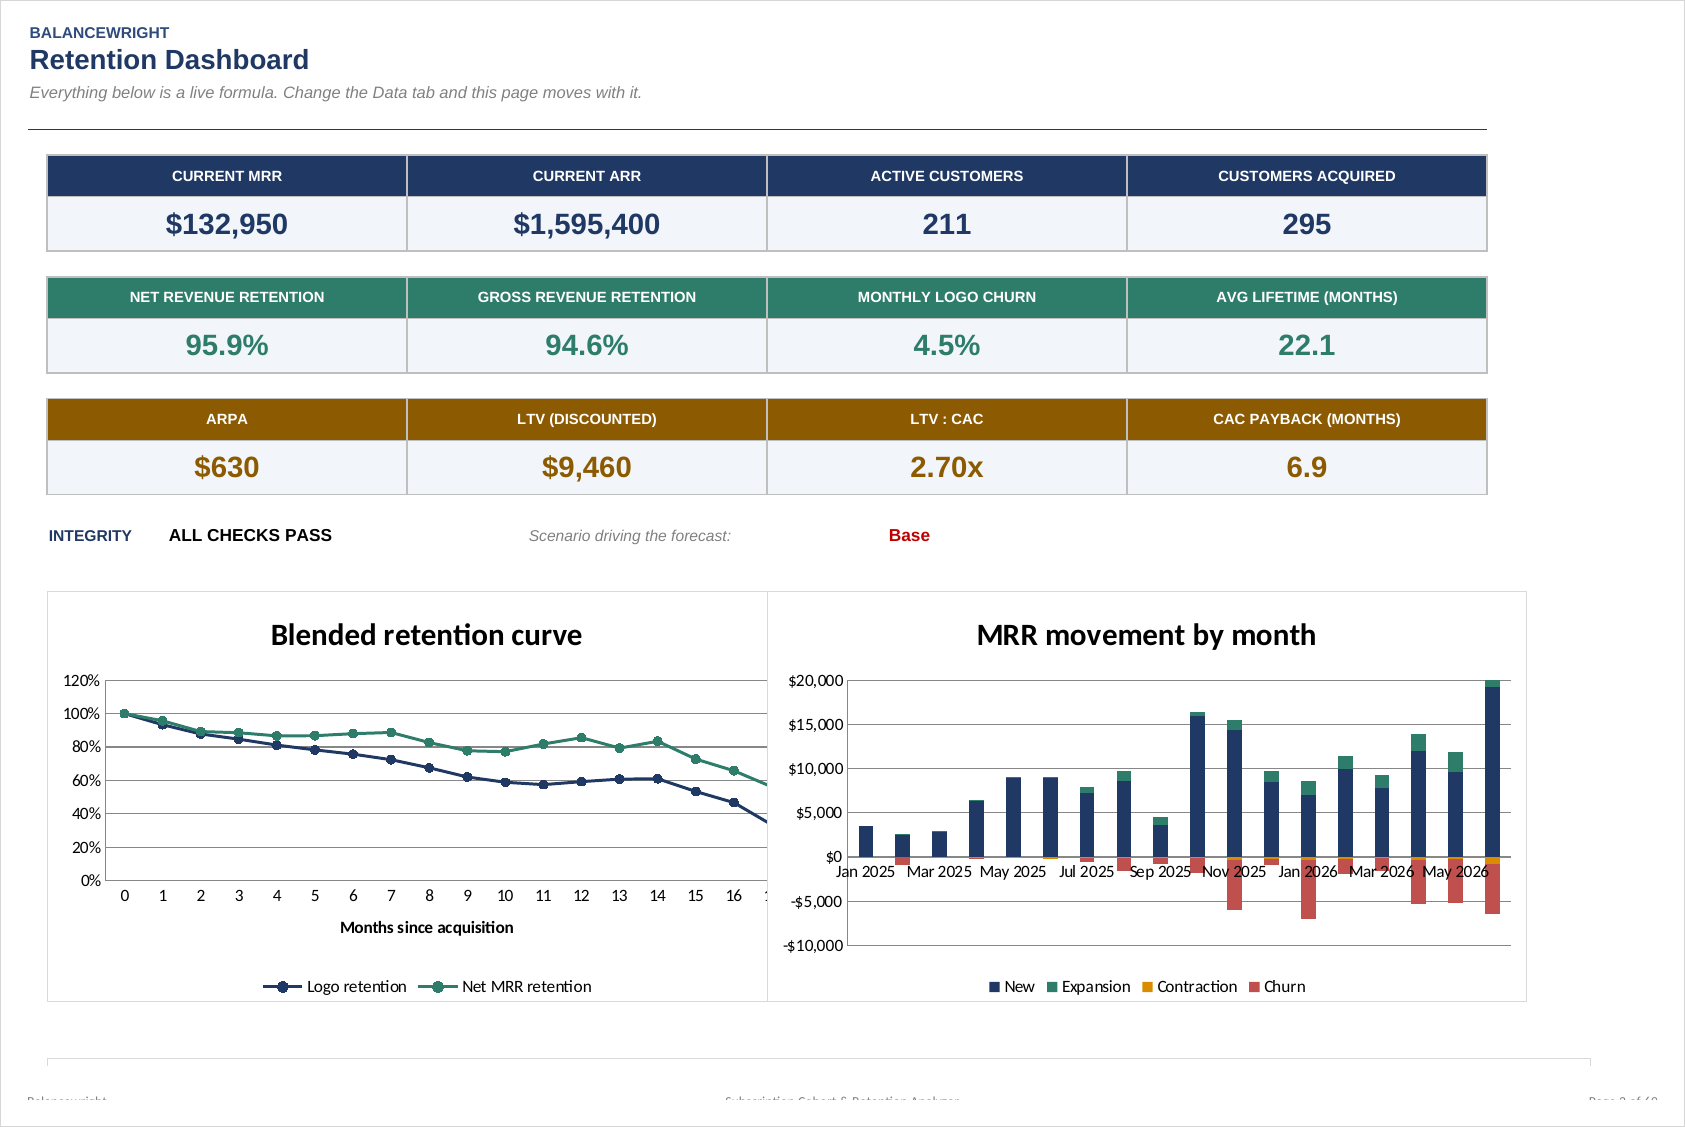
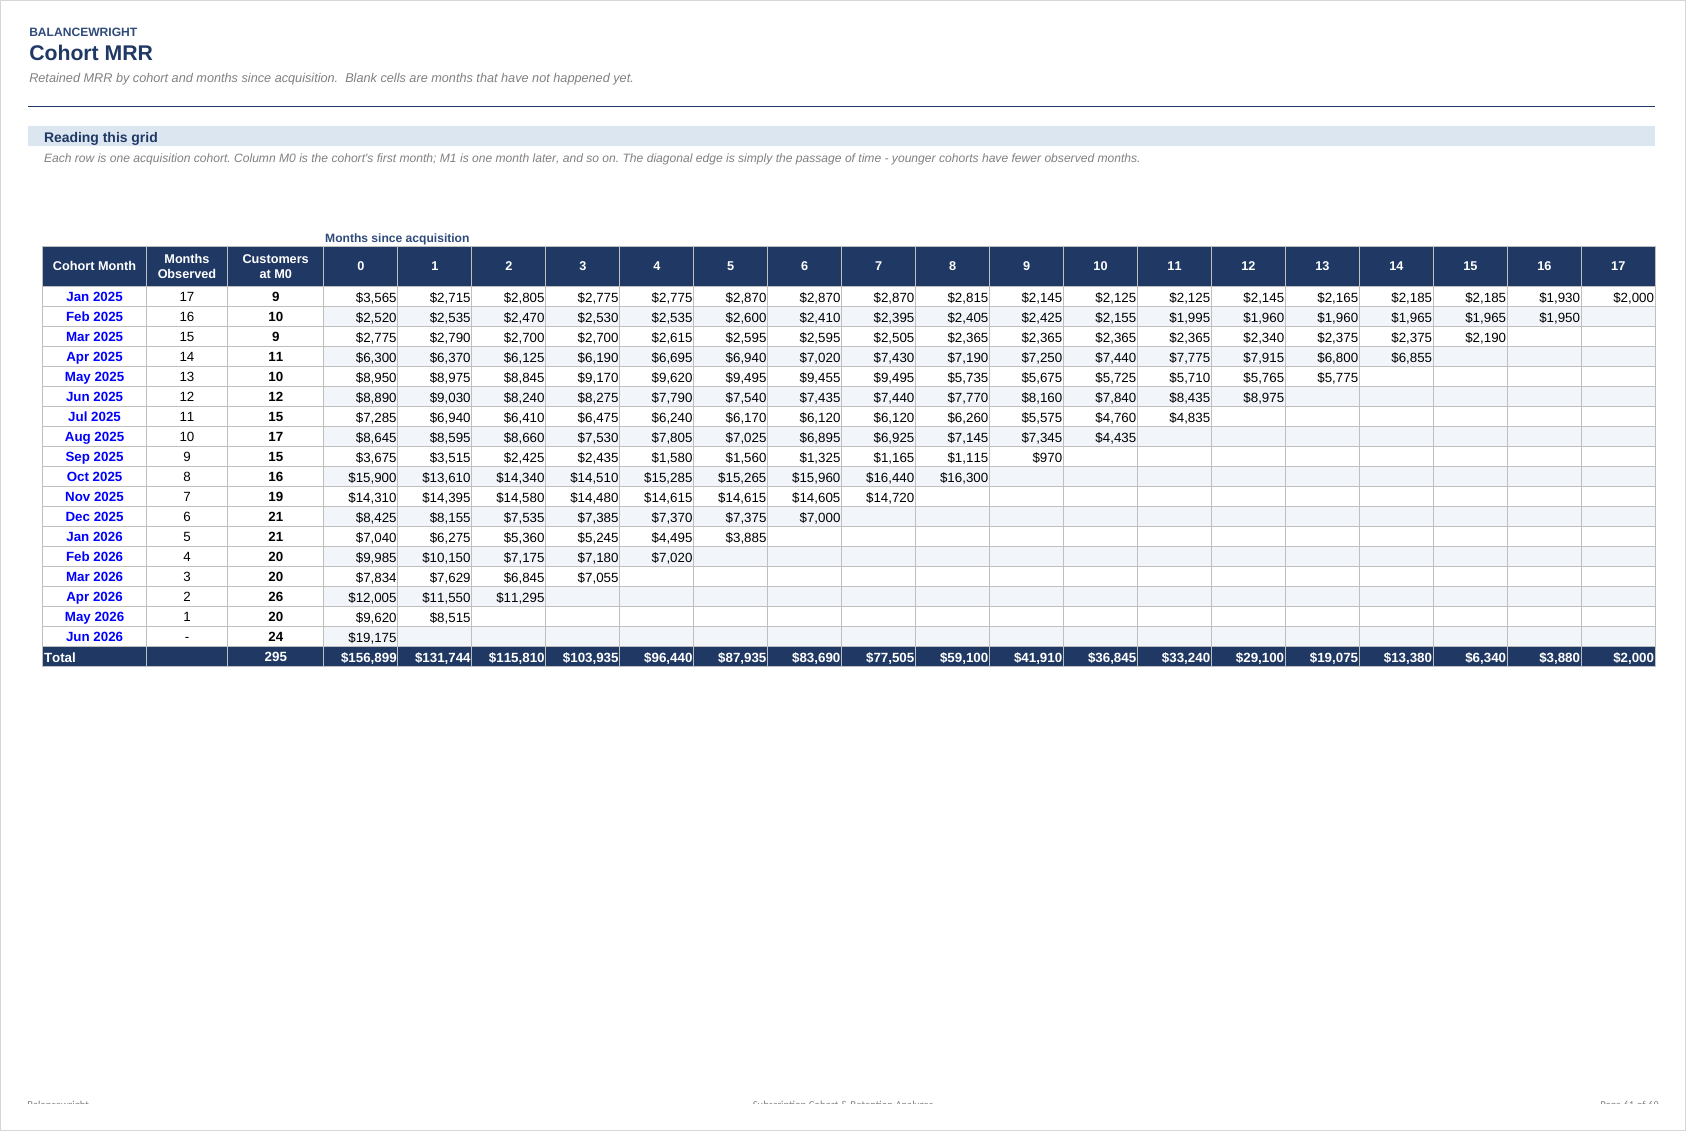
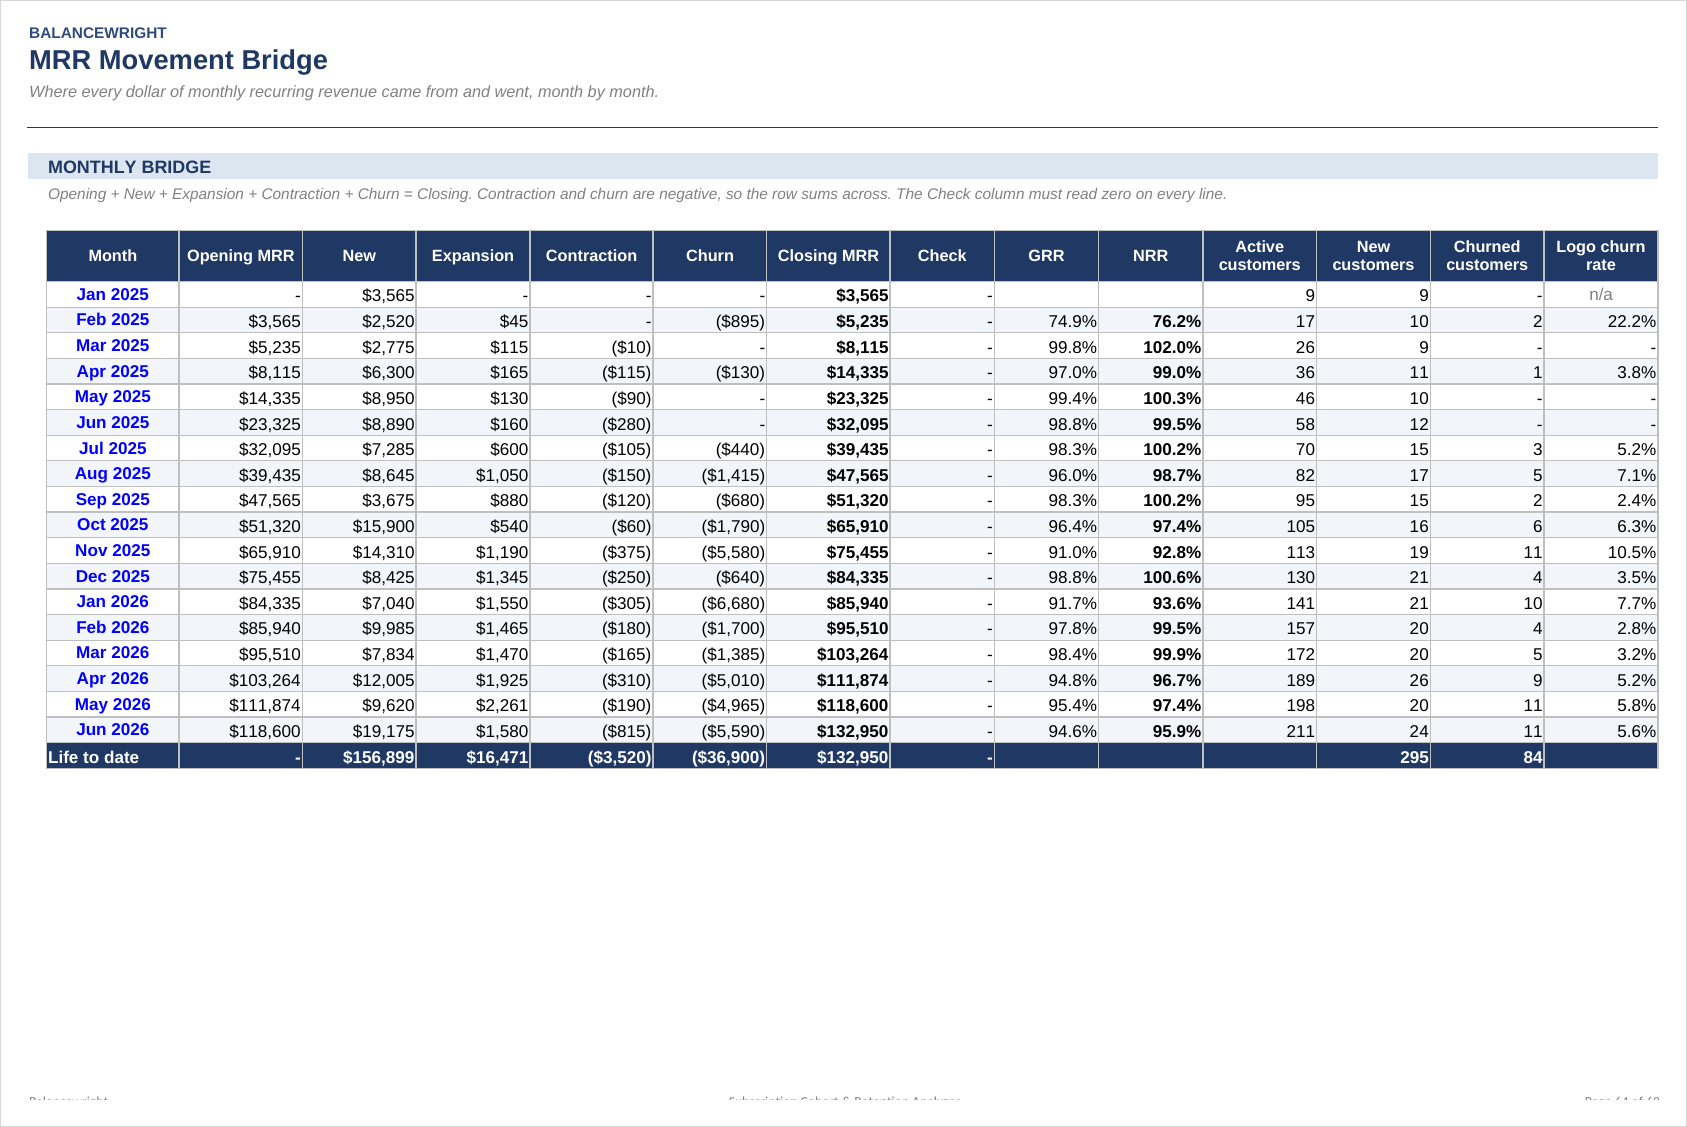
Cohort triangles in dollars and in logos, indexed to each cohort's own first month. Logo retention and net MRR retention as curves, with a blended average underneath. A monthly MRR movement bridge - opening, new, expansion, contraction, churn, closing - with a Check column that reads zero on every single line, which is what proves the bridge reconciles rather than merely looks plausible. Gross and net revenue retention month by month. Unit economics blended, and then split by segment and by acquisition channel, each using its own observed churn rate and its own acquisition cost. A twelve-month forward projection driven by a one-cell scenario switch.

THE CHURN ROW IS THE PART PEOPLE MISS

A customer who cancels needs one final row, in the month they left, with MRR set to zero. Without it the model cannot tell the difference between a customer who churned and a customer whose data simply stops - and the churn line of the bridge reads zero forever. The guide says this in the first two pages, because it is the single convention that makes the whole workbook work.

WHY THE SEGMENT TABLE IS THE ONE TO QUOTE

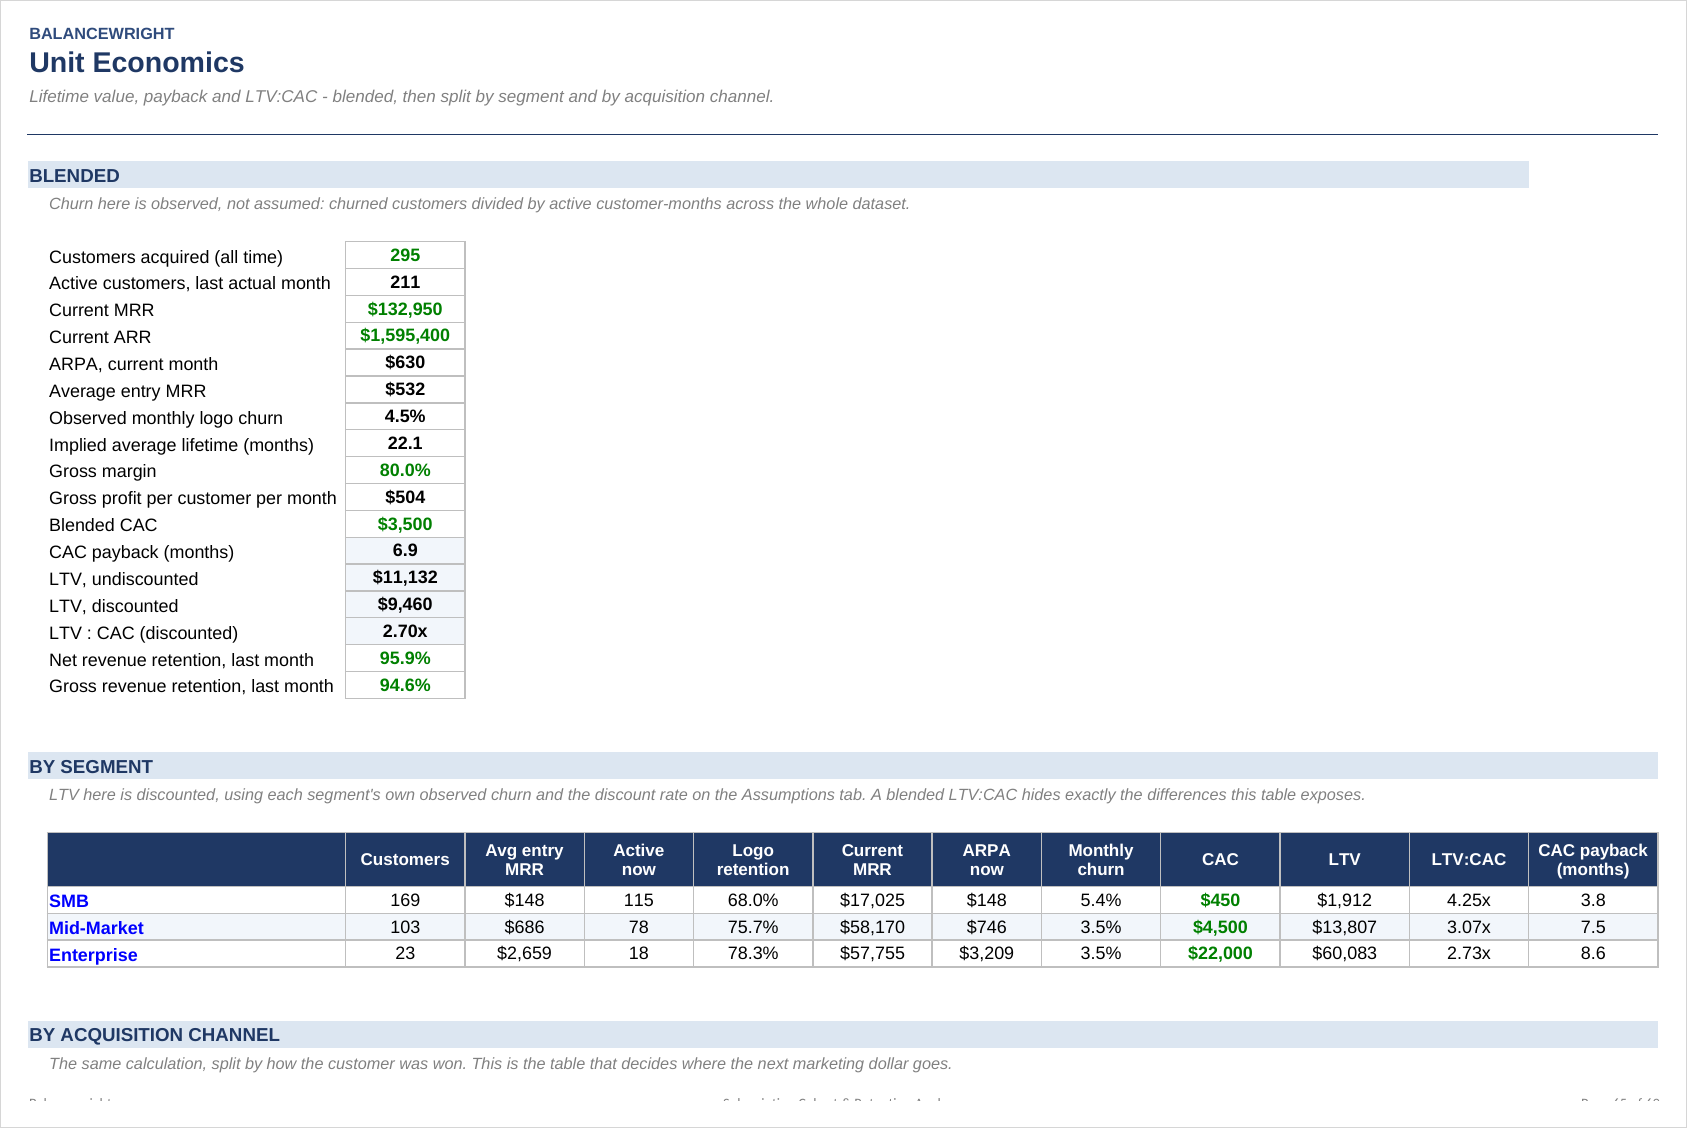
A blended LTV divides a revenue-weighted ARPA by a customer-weighted churn rate. That flatters any business with a small number of large, sticky accounts, and it is why a blended LTV:CAC of three can sit on top of one segment that pays back in five months and another that never pays back at all. The segment and channel tables exist to expose exactly that, and they are the tables a diligence reader will go to first.

THE WORKED EXAMPLE

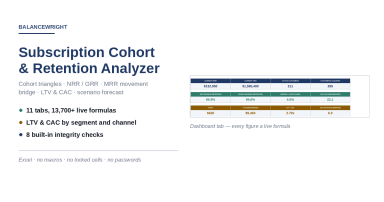
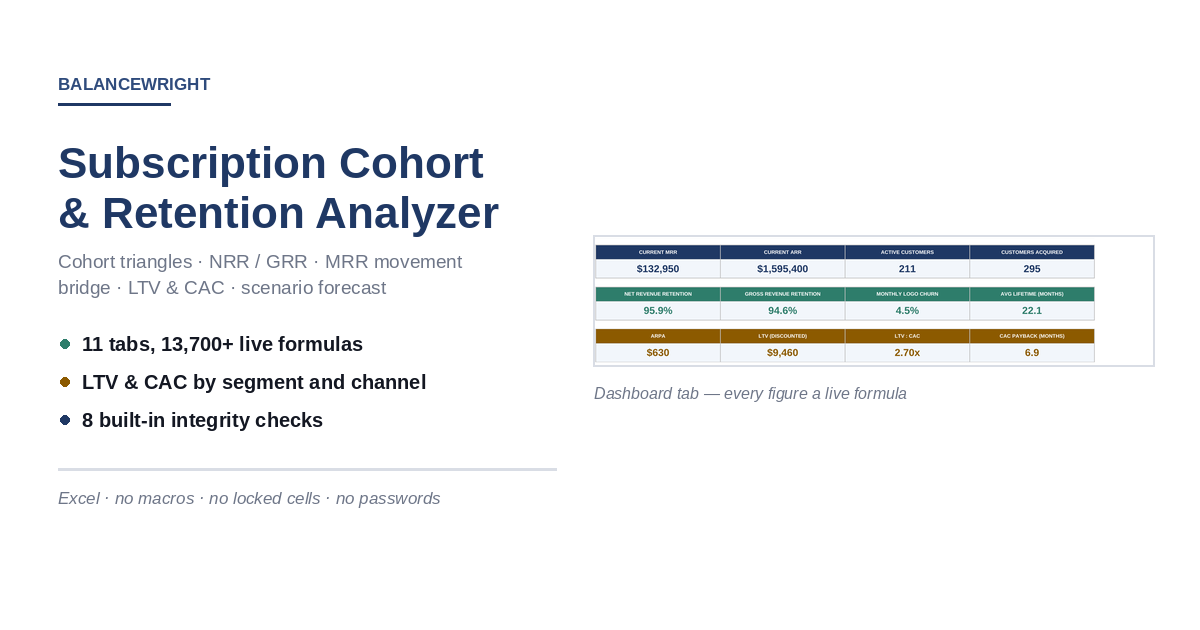
295 customers across 18 monthly cohorts, 1,939 rows of revenue history. Current MRR of 132,950 and ARR of 1,595,400, 211 active customers, net revenue retention of 95.9 per cent, gross revenue retention of 94.6 per cent, monthly logo churn of 4.5 per cent, an implied average lifetime of 22.1 months, discounted LTV of 9,460, LTV:CAC of 2.70 times and CAC payback of 6.9 months. Delete it and paste your own; every figure recomputes.

EIGHT INTEGRITY CHECKS

The MRR bridge ties on every month. The cohort grid reconciles exactly to the raw data. Every customer appears in exactly one cohort. No negative MRR. No activity dated before its own cohort month. Logo retention never exceeds 100 per cent. The live scenario resolves to a number. The projection never goes negative. All eight must read PASS before a number in this file is worth quoting.

Eleven tabs, live formulas throughout, 13,743 of them. No macros, no add-ins, no external links, no locked cells and no passwords, and nothing that needs iterative calculation switched on.

HONEST LIMITATIONS

The forward projection applies blended rates to the whole book, so it will not capture a change in customer mix; once you have more than two years of history, forecast each cohort separately. Discounted LTV assumes a constant churn hazard, while real retention curves flatten with age, so treat it as a floor. And the model reads what you give it: if the churn rows are missing, every retention figure will be wrong and no integrity check can tell you so.

This workbook models the arithmetic of your own data. It is not financial advice, and the worked example is invented.

This Best Practice includes
1 Excel workbook (11 tabs, 13,743 live formulas) and 1 five-page PDF guide.

Acquire business license for $79.00

Add to cart

Add to bookmarks

Discuss

Further information

Turn a flat export of subscription revenue into the retention analytics a board or an investor asks for, and be able to prove the numbers reconcile before presenting them.

You run a subscription or SaaS business and have revenue by customer by month; you are preparing a board pack, an investor update or a diligence response; you need retention and unit economics split by segment and by acquisition channel rather than blended.

You need usage-based or consumption pricing modelled explicitly, multi-currency consolidation, or cohort-level forecasting. This analyses recurring revenue you already have, on a monthly grid, in one currency.


0.0 / 5 (0 votes)

please wait...