Originally published: 20/03/2017 12:57
Publication number: ELQ-85976-1
View all versions & Certificate
Publication number: ELQ-85976-1
View all versions & Certificate

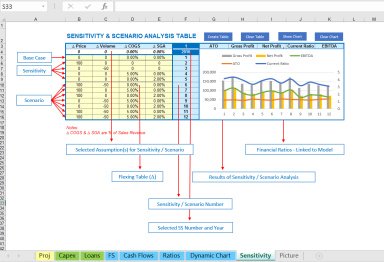
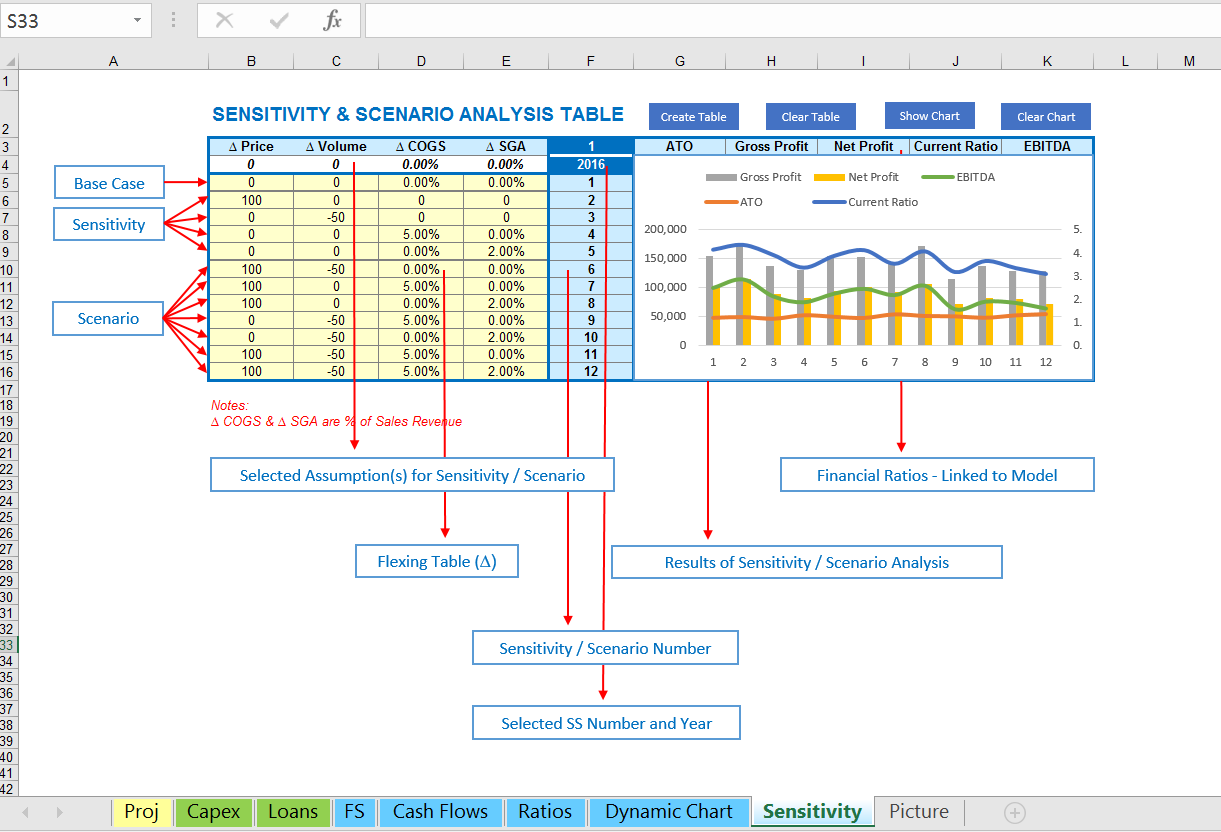
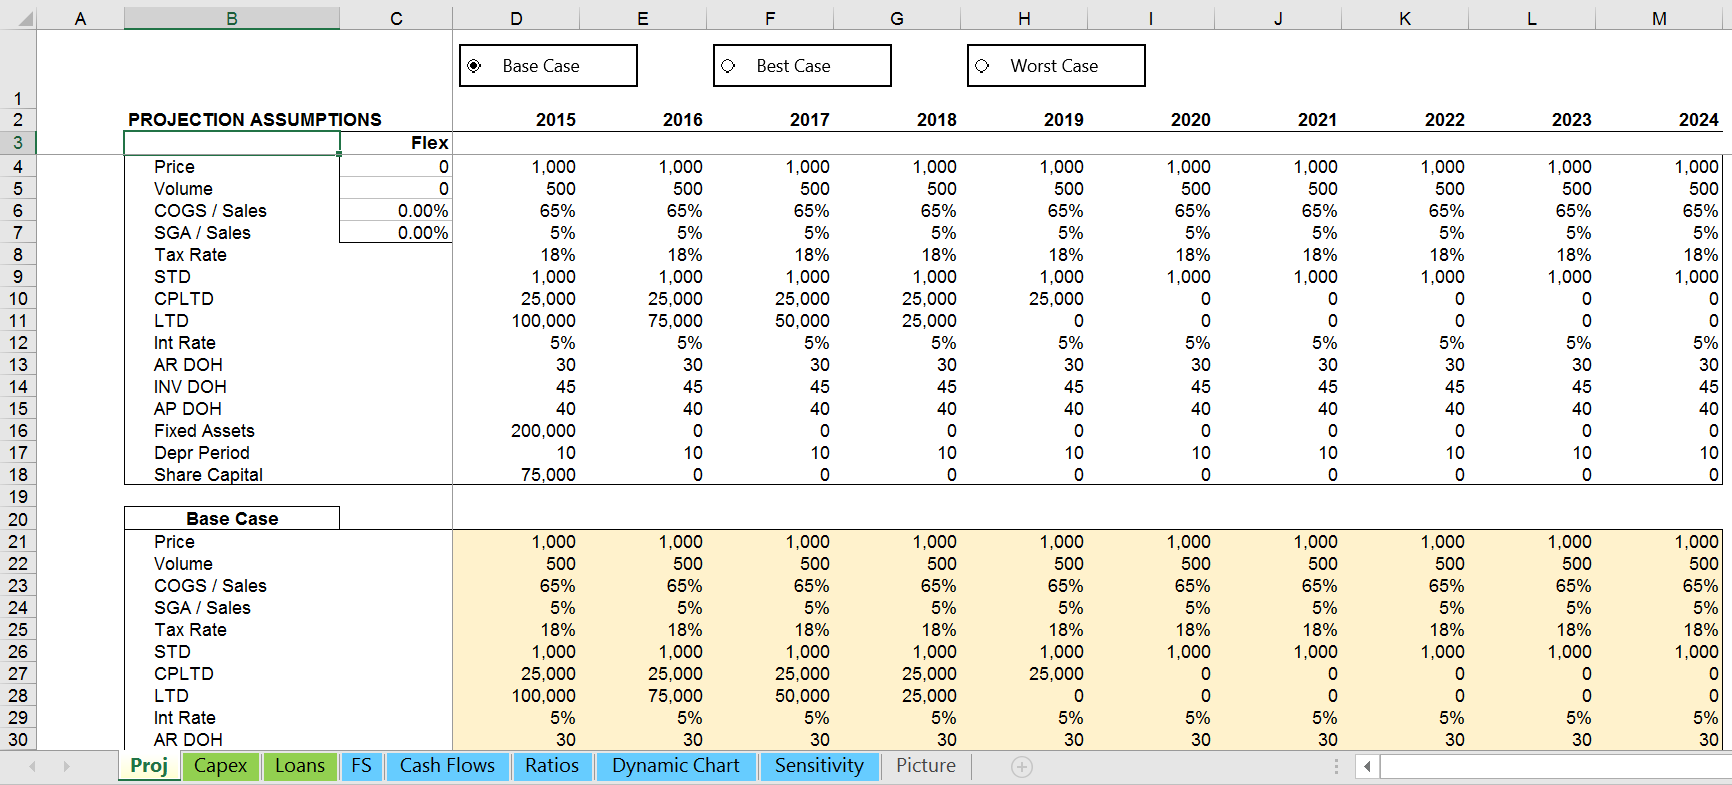
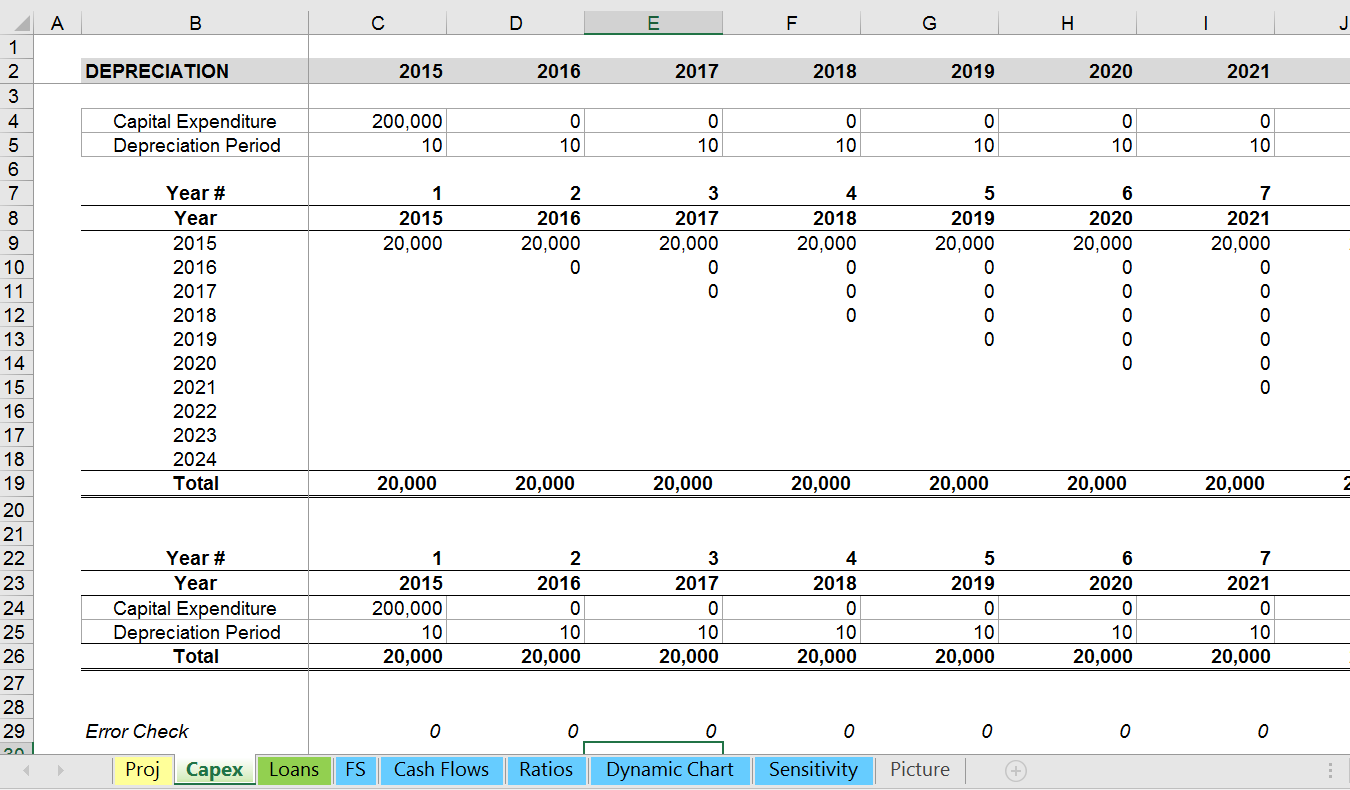
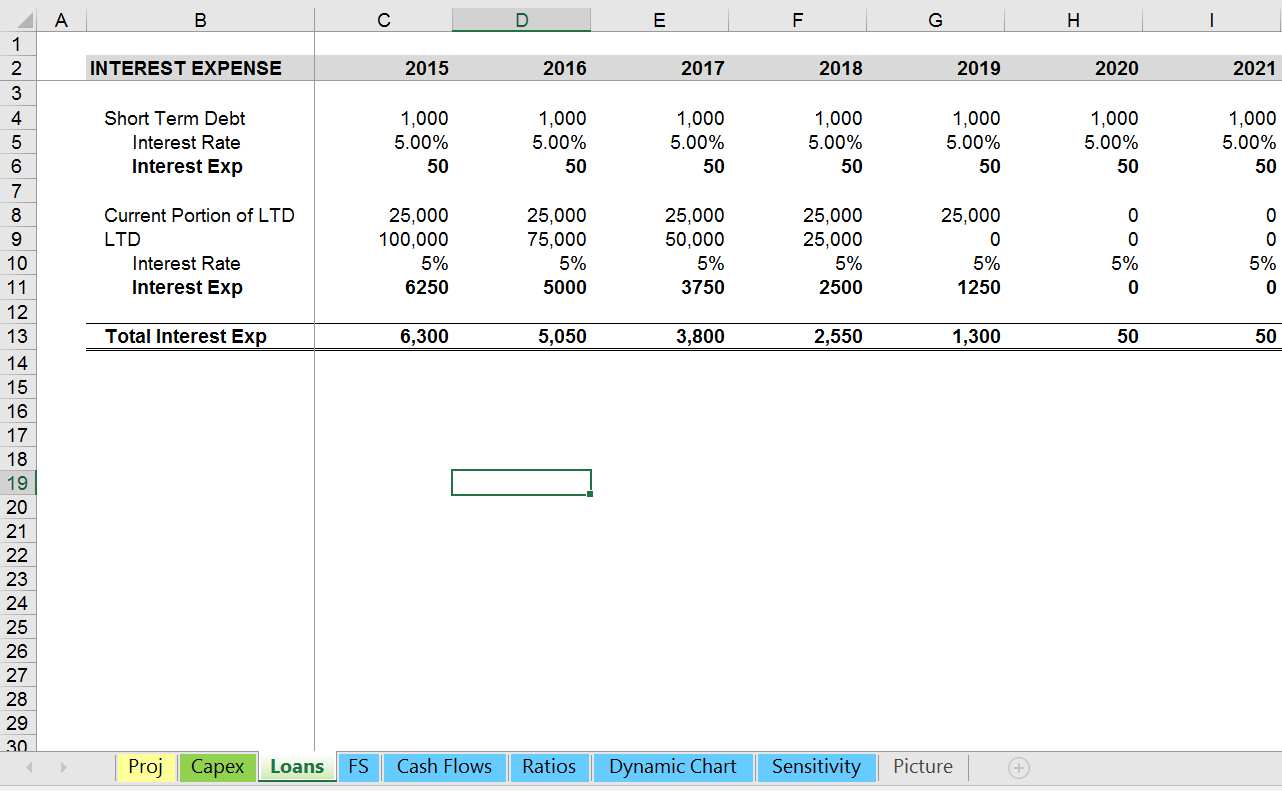
Sensitivity & Scenario Analysis Excel Template
How to use an excel data table for sensitivity and scenario analysis for you financial model.
