

Originally published: 27/06/2023 12:28
Publication number: ELQ-80966-1
View all versions & Certificate
Publication number: ELQ-80966-1
View all versions & Certificate

Williams %R Indicator – Technical Analysis - Stock Market Excel Template
This template is the widely used, Williams %R (or %R) technical indicator that is used to analyze stock performance.
Description
What is Williams %R indicator?
The Williams %R indicator was created by Larry Williams who has created several technical indicators and is a famous trader.
Williams %R is a momentum-based oscillator to identify overbought and oversold conditions.
%R Oscillates between 0 and -100. When the value is closer to zero, it indicates overbought conditions and when closer to -100 indicates oversold conditions.
Trading Signals
Williams himself set the parameters of overbought as any reading between 0 and -20. His oversold parameters were readings between -80 and -100. It is important to note that these values are traditional examples. It may be beneficial for the technical analyst to set different parameters based on the specific instrument being analyzed. Wider or narrower overbought and oversold levels may be appropriate based on historical analysis.
Resource: TradingView
The following is an example signal strategy
Buy when the %R drops below the Minimum threshold (-80 by default)
Sell when the %R exceeds above the Maximum threshold (-20 by default)
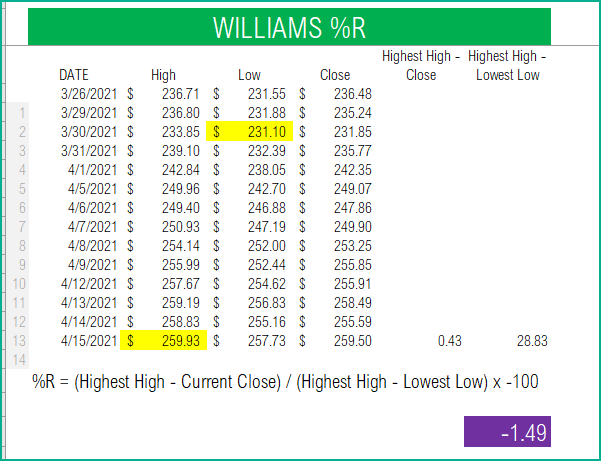
How to calculate Williams %R?
%R = (Highest High – Current Close) / (Highest High – Lowest Low) x -100
Highest High = Highest High for the look-back period.
Lowest Low = Lowest Low for the look-back period.
Most commonly used period is 14.
Williams %R is represented as a line on the chart and its values range from 0 to -100.
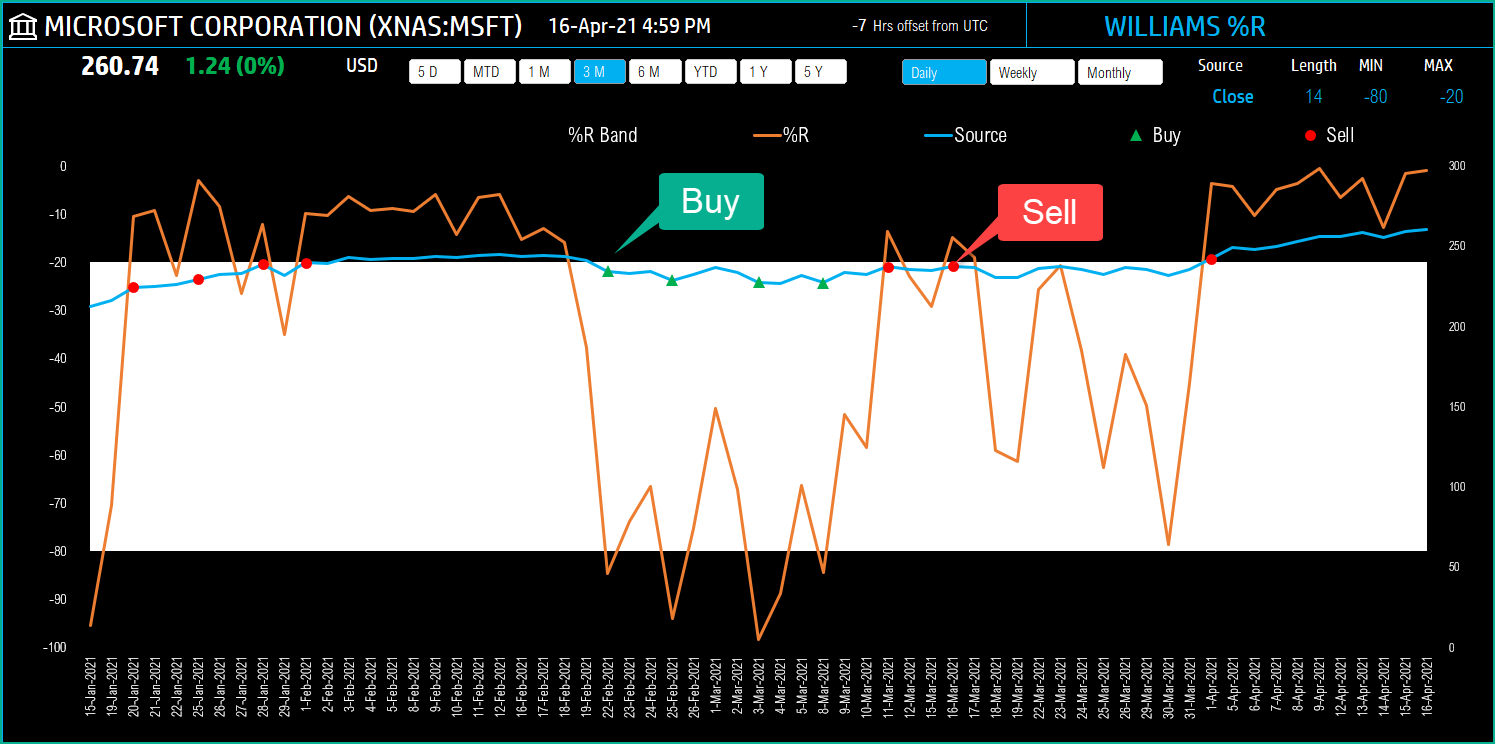
Williams %R Excel Template
The template will help you create the Williams %R indicator automatically and calculate the trading signals instantly for any stock.
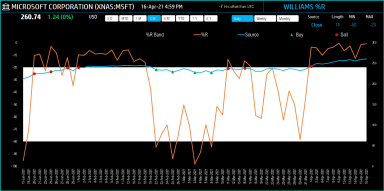
The blue line indicates the Closing price and the Orange line the Williams %R. The shaded area represents the Williams %R band from the minimum threshold to the maximum threshold.
Requirements
To pull live Stock data from the services you would need Microsoft 365 Subscription Plans for PC and Web
How to create Williams %R indicator in Excel?
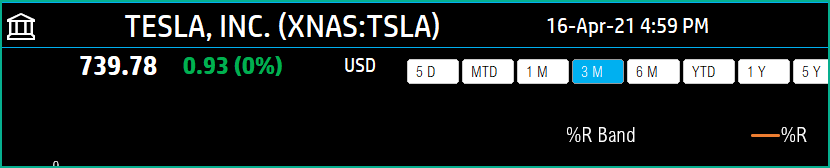
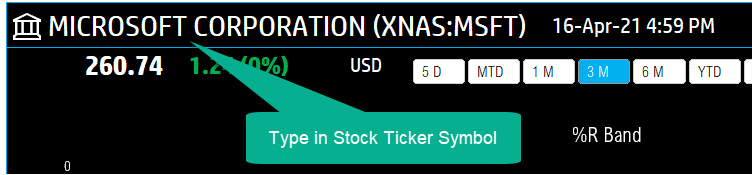
Type in a stock sticker symbol on the top left.
If Excel does not recognize your stock symbol, it will pop up this data selector box.
You can select the stock you are interested in.
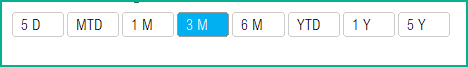
Period
The template can pull up to 5 years of price history by default. You can choose how much history to display on the chart easily using the slicer buttons.
Interval
The template allows price history at 3 different intervals.
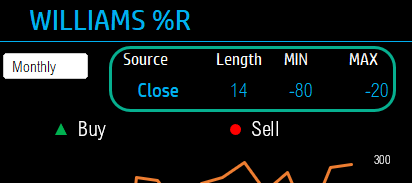
Input Parameters
1. Source: Closing price is the one that is used for calculations typically. However, you can choose from Open, High, Low, Close or Volume.
2. Length: You can type in a length in periods. The commonly used is 14.
3. Min: This is the minimum %R threshold to generate signals. The commonly used is -80.
4. Max: This is the maximum %R threshold to generate signals. The commonly used is -20
The chart will update automatically based on all the above inputs.
Signals
The template shows two types of signals (Buy, Sell) on the chart.
The following rule generates the signals.
Buy when the %R drops below the Minimum threshold (-80 by default)
Sell when the %R exceeds above the Maximum threshold (-20 by default)
In addition, if the latest day has a signal, it will be displayed below the current price.
What is Williams %R indicator?
The Williams %R indicator was created by Larry Williams who has created several technical indicators and is a famous trader.
Williams %R is a momentum-based oscillator to identify overbought and oversold conditions.
%R Oscillates between 0 and -100. When the value is closer to zero, it indicates overbought conditions and when closer to -100 indicates oversold conditions.
Trading Signals
Williams himself set the parameters of overbought as any reading between 0 and -20. His oversold parameters were readings between -80 and -100. It is important to note that these values are traditional examples. It may be beneficial for the technical analyst to set different parameters based on the specific instrument being analyzed. Wider or narrower overbought and oversold levels may be appropriate based on historical analysis.
Resource: TradingView
The following is an example signal strategy
Buy when the %R drops below the Minimum threshold (-80 by default)
Sell when the %R exceeds above the Maximum threshold (-20 by default)
How to calculate Williams %R?
%R = (Highest High – Current Close) / (Highest High – Lowest Low) x -100
Highest High = Highest High for the look-back period.
Lowest Low = Lowest Low for the look-back period.
Most commonly used period is 14.
Williams %R is represented as a line on the chart and its values range from 0 to -100.
Williams %R Excel Template
The template will help you create the Williams %R indicator automatically and calculate the trading signals instantly for any stock.
The blue line indicates the Closing price and the Orange line the Williams %R. The shaded area represents the Williams %R band from the minimum threshold to the maximum threshold.
Requirements
To pull live Stock data from the services you would need Microsoft 365 Subscription Plans for PC and Web
How to create Williams %R indicator in Excel?
Type in a stock sticker symbol on the top left.
If Excel does not recognize your stock symbol, it will pop up this data selector box.
You can select the stock you are interested in.
Period
The template can pull up to 5 years of price history by default. You can choose how much history to display on the chart easily using the slicer buttons.
Interval
The template allows price history at 3 different intervals.
Input Parameters
1. Source: Closing price is the one that is used for calculations typically. However, you can choose from Open, High, Low, Close or Volume.
2. Length: You can type in a length in periods. The commonly used is 14.
3. Min: This is the minimum %R threshold to generate signals. The commonly used is -80.
4. Max: This is the maximum %R threshold to generate signals. The commonly used is -20
The chart will update automatically based on all the above inputs.
Signals
The template shows two types of signals (Buy, Sell) on the chart.
The following rule generates the signals.
Buy when the %R drops below the Minimum threshold (-80 by default)
Sell when the %R exceeds above the Maximum threshold (-20 by default)
In addition, if the latest day has a signal, it will be displayed below the current price.
This Best Practice includes
1 Excel Template
