
Originally published: 19/10/2024 13:17
Publication number: ELQ-63925-1
View all versions & Certificate
Publication number: ELQ-63925-1
View all versions & Certificate

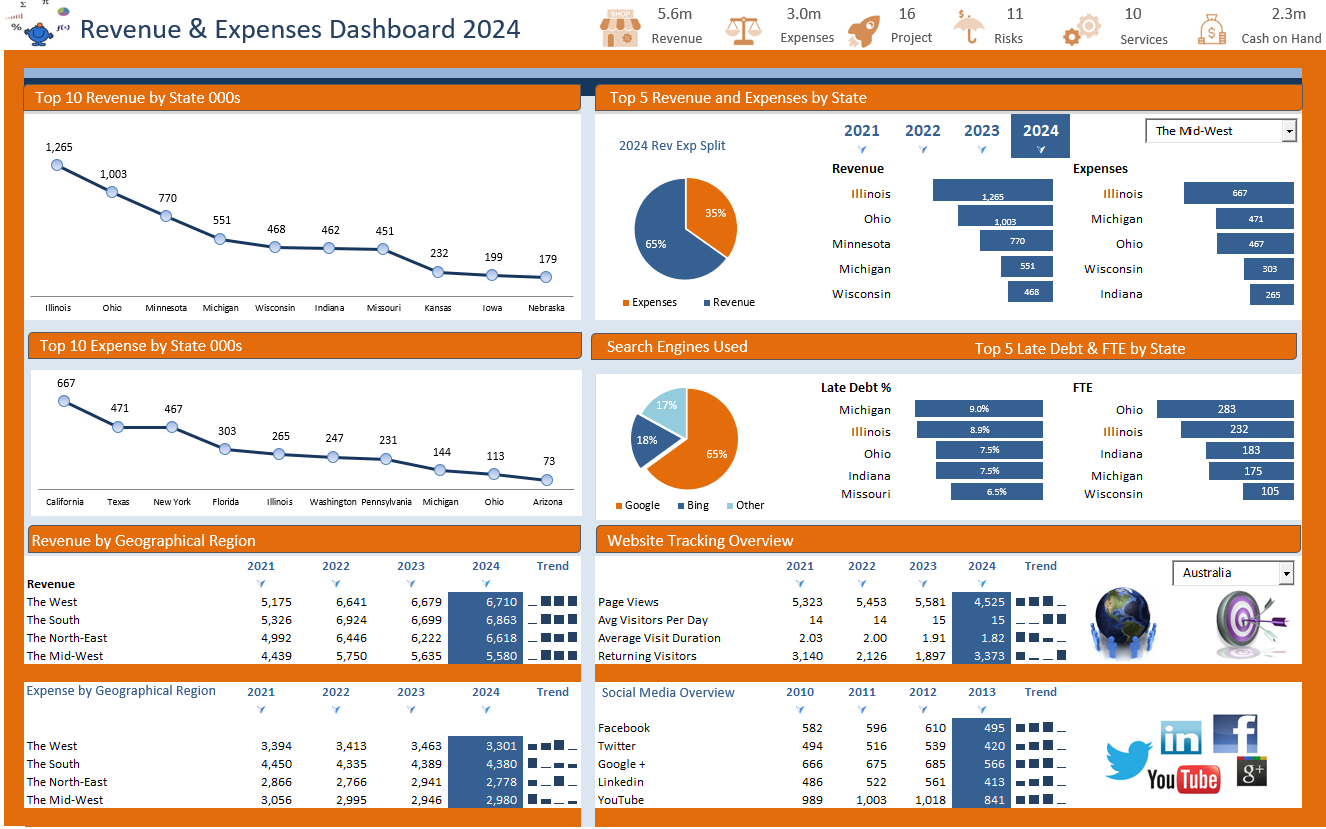
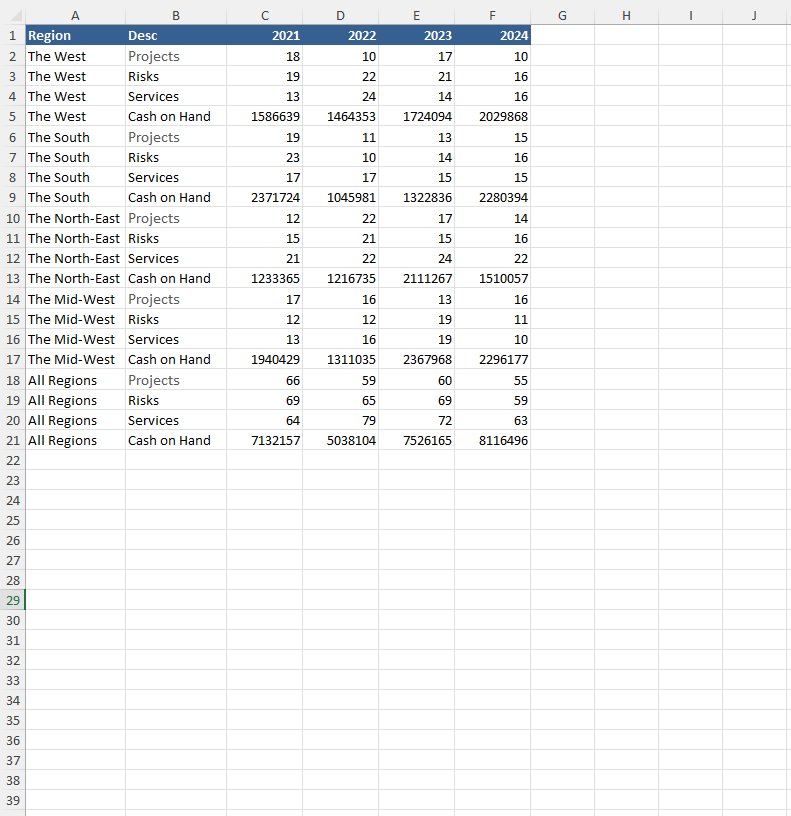
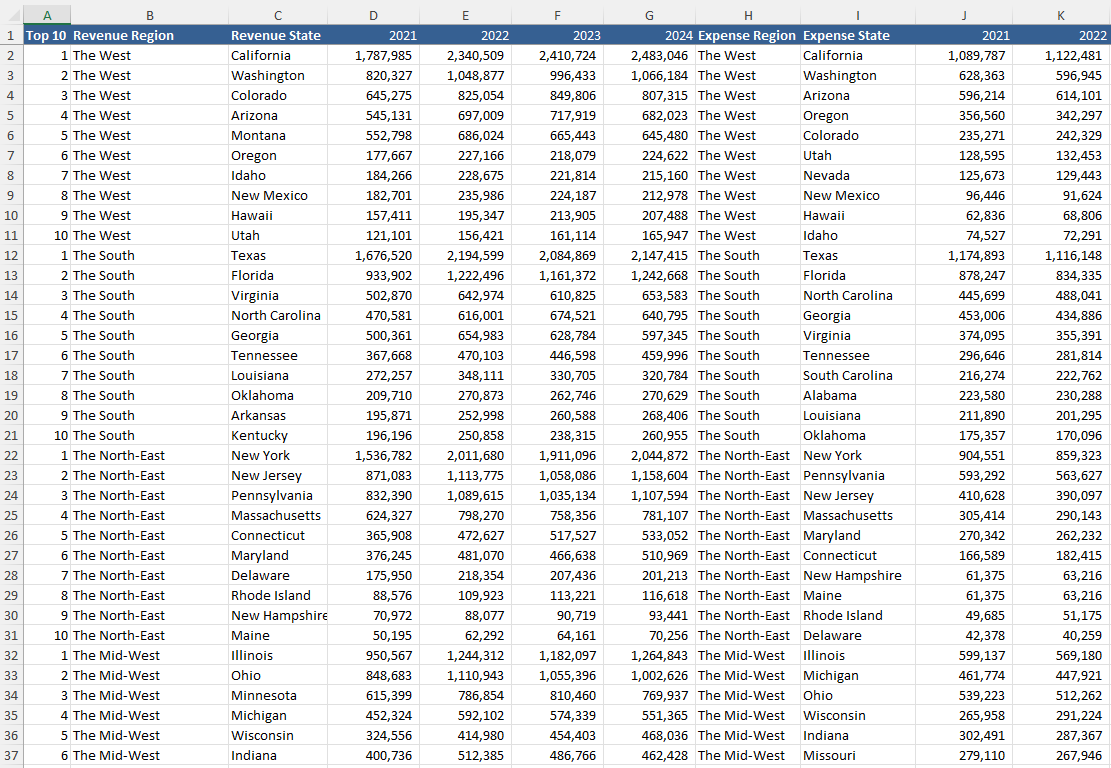
Revenue and Expense Report by Region
Revenue and Expenses by Region
Further information
Share the ease and simplicity of creating a basic excel dashboard.
Where revenue, expense or any other metrics are needed to be displayed in a succinct summary.
Where users are unfamiliar with Excel
