
Publication number: ELQ-69198-1
View all versions & Certificate

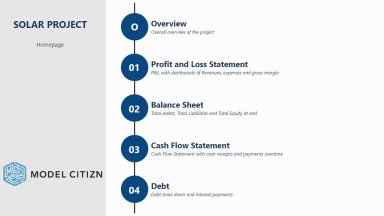
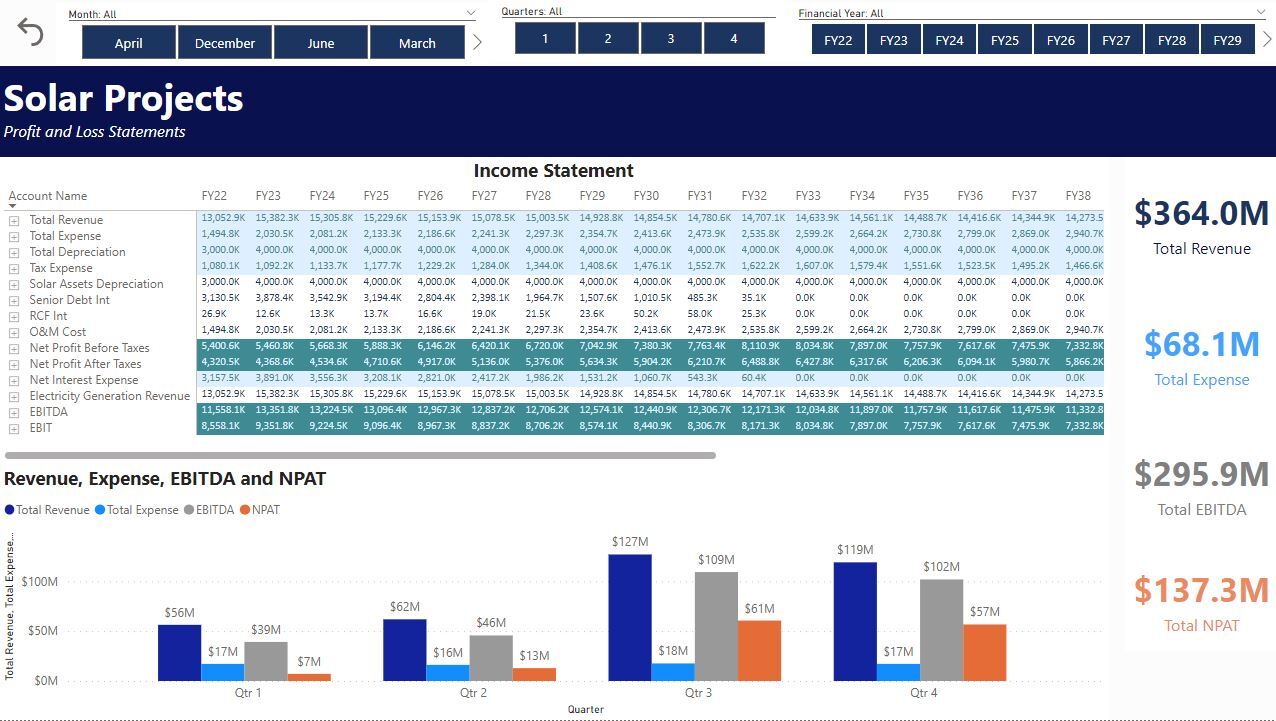
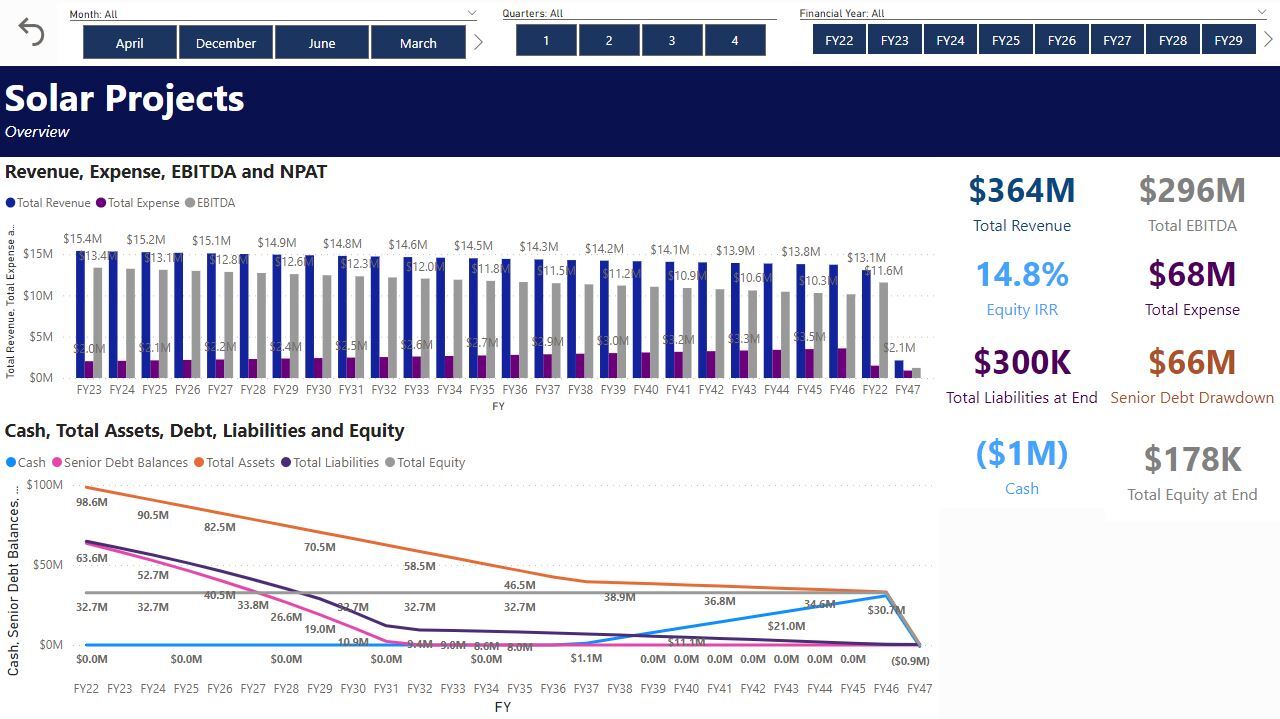
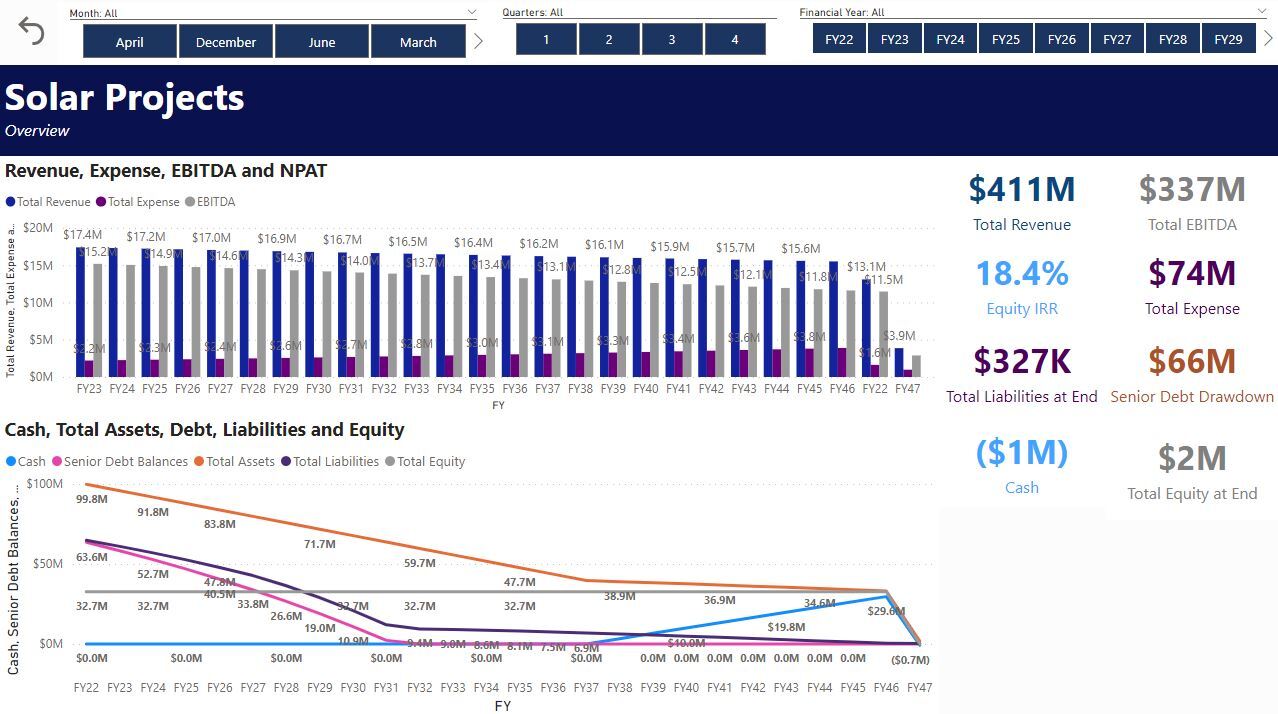
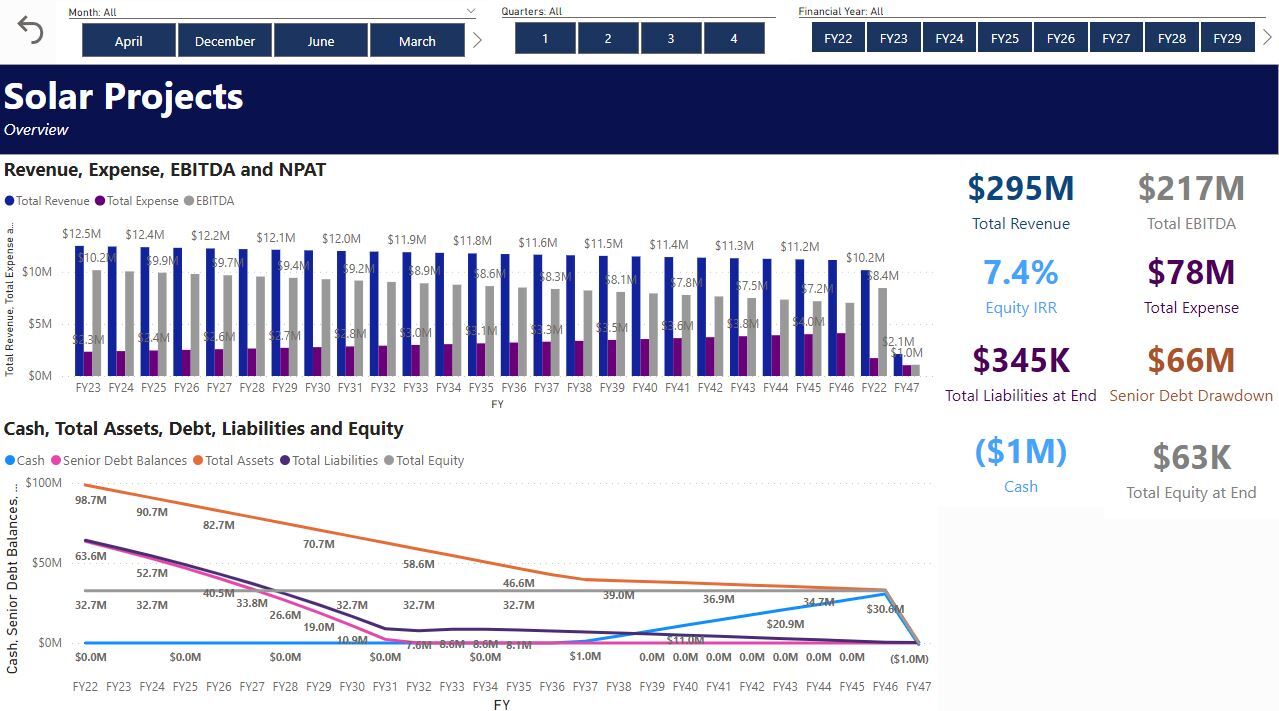
Integrating Project Finance Modelling with Power BI
Project Finance Model Integration with Power BI. Learn how to integrate project finance models into Power BI streamlining monitoring and decision-making.
CEO & Founder of Model Citizn, Chief Excel Officer of EXL Cloud, Chief Data Modeller of Potenza and professional financial modeler and trainer for FMIFollow 300
Further information
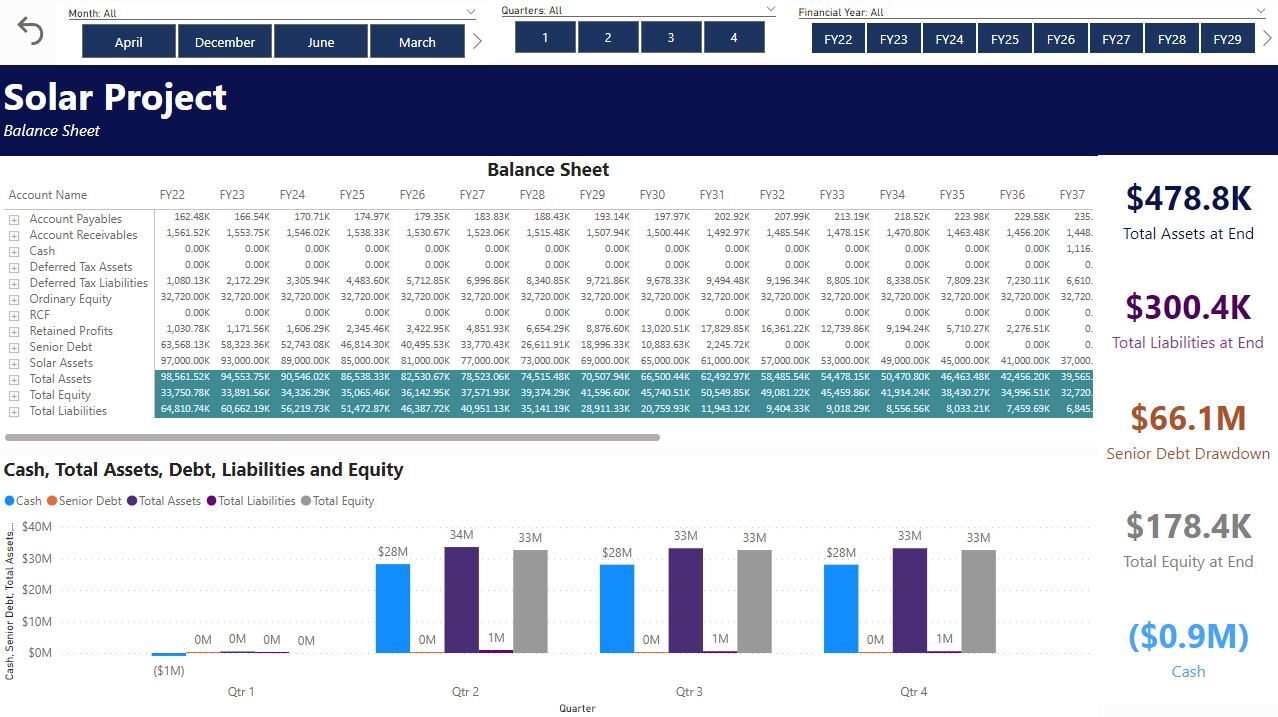
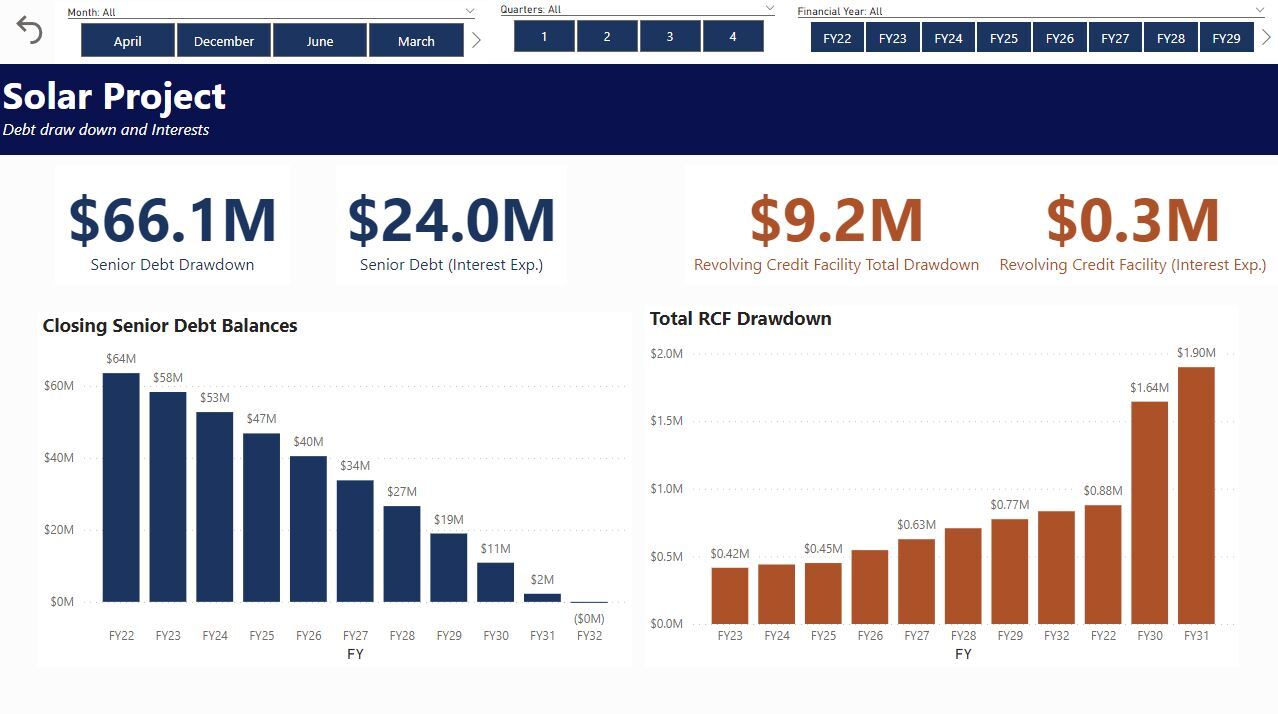
To give people a detailed pathway to integrating a project finance model that is often reasonably complex, into Power BI which is also a reasonably complex tool to use. The combination of these two disciplines is difficult to master and in this best practice, we show both.
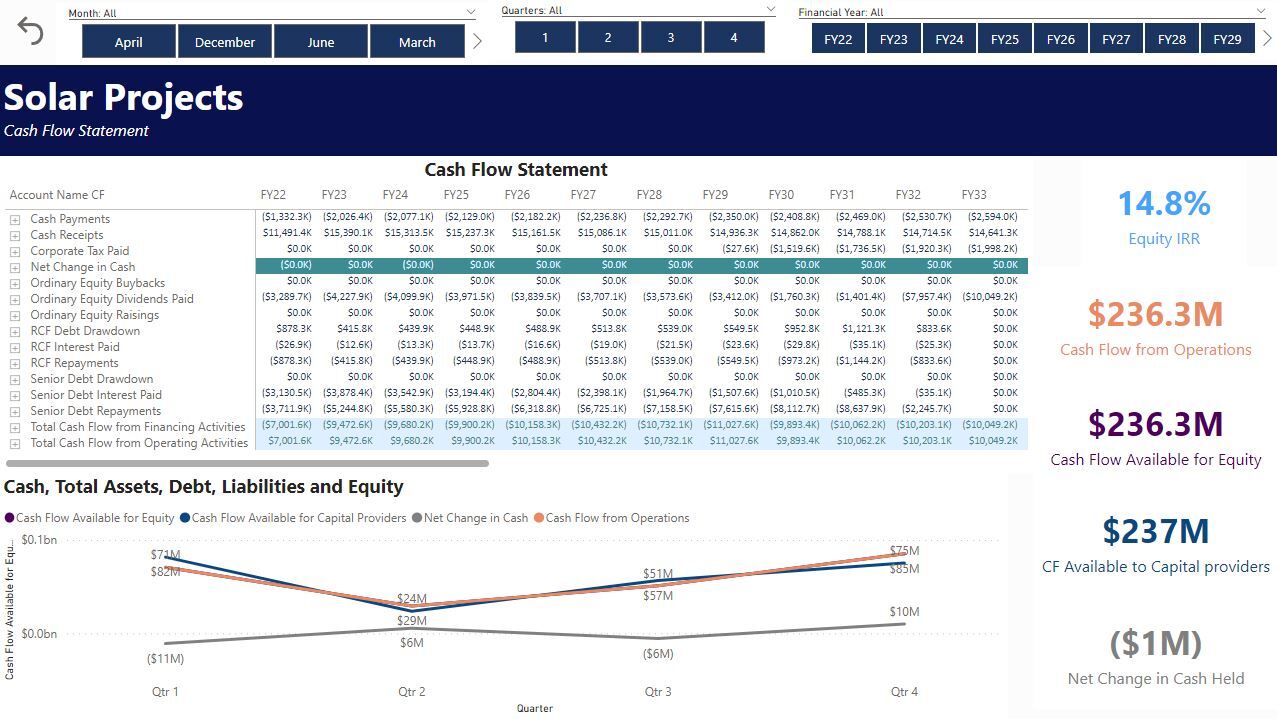
To allow project finance models to integrate to Power BI enmasse. This apprach can be expanded across a portfolio of project finance assets and provide asset owners and asset managers with insight across all their projects in one place.
For business modellings or business cash flows. This is focused on project finance and in particular solar projects.
