
Last version published: 29/06/2026 08:04
Publication number: ELQ-25883-2
View all versions & Certificate

Textile Garments Business Dashboard | Excel Sales, Inventory & Revenue Analysis Template
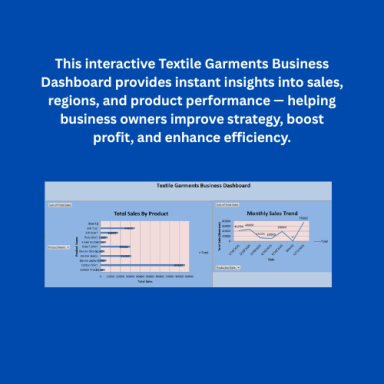
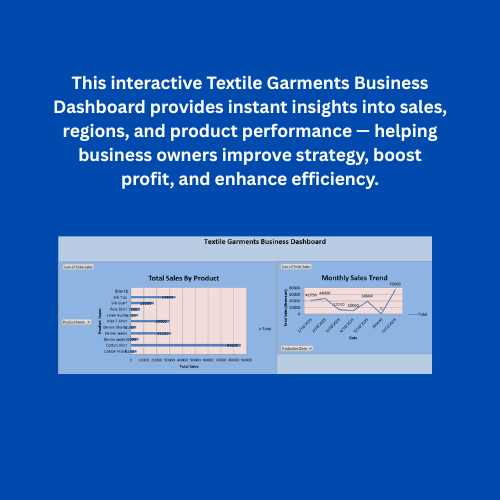
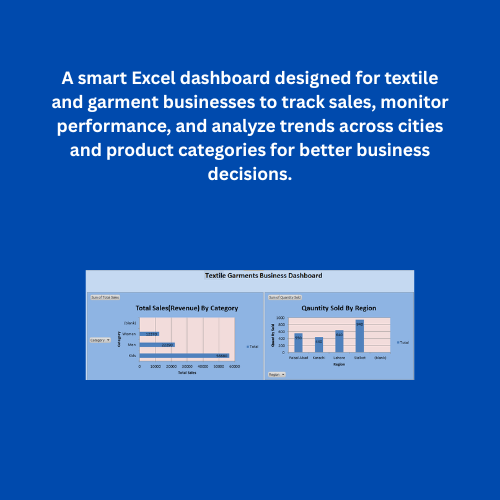
Interactive Excel dashboard designed for textile garments businesses to monitor sales, inventory, revenue, and key performance indicators in one place.
Further information
1. Objectives of This Downloadable Best Practice
Monitor sales performance, revenue, and inventory levels in a textile garments business.
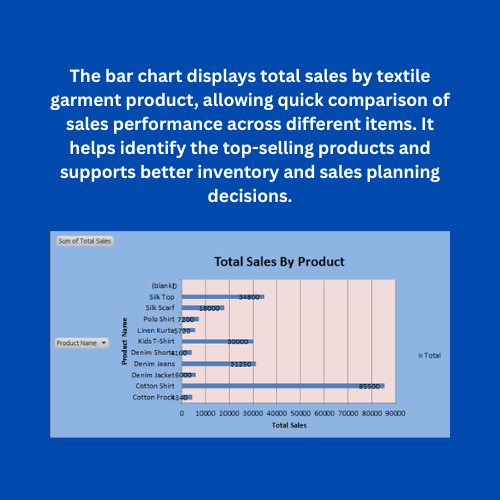
Analyze product-wise sales to identify top-selling and low-performing items.
Track stock availability to avoid overstocking or shortages.
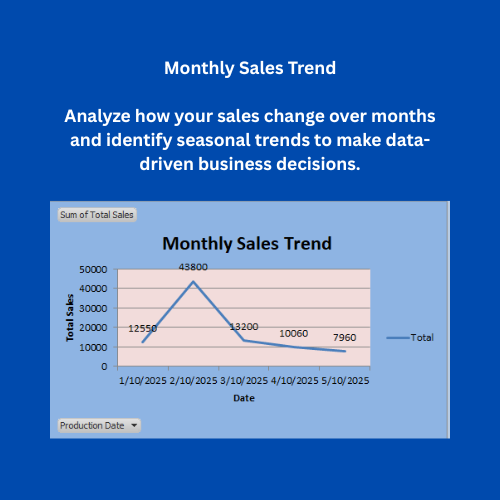
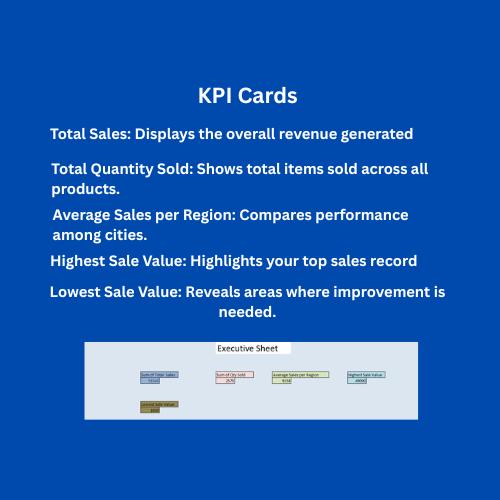
Evaluate business performance using key KPIs such as total sales, revenue, and inventory movement.
Support data-driven decision-making through visual charts and automated calculations.
Improve operational efficiency by reducing manual reporting efforts.
Provide a centralized view of business performance in a single Excel dashboard.
2. Conditions for Which This Downloadable Best Practice Applies Best
Textile shops, garment stores, boutiques, and apparel wholesalers.
Small to medium-sized businesses managing sales and inventory in Excel.
Business owners needing a simple and visual tool for tracking performance.
Users preparing daily, weekly, or monthly sales and inventory reports.
Professionals seeking an affordable and easy-to-use Excel-based dashboard.
3. Conditions for Which This Downloadable Best Practice Does Not Apply
Large enterprises using advanced ERP or inventory management systems.
Businesses requiring real-time multi-user or cloud-based reporting solutions.
Organizations needing barcode scanning, billing systems, or automated stock integration.
Users looking for mobile or web-based dashboards instead of Excel.
Highly complex operations with large-scale data requiring advanced analytics tools.
This structure is clear, professional, and well-suited for publishing on Eloquens.
