Originally published: 20/11/2025 09:14
Last version published: 15/04/2026 11:58
Publication number: ELQ-91183-6
View all versions & Certificate
Last version published: 15/04/2026 11:58
Publication number: ELQ-91183-6
View all versions & Certificate

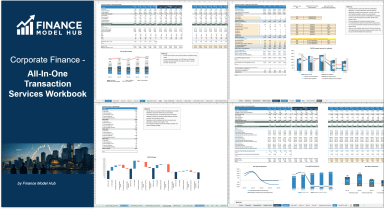
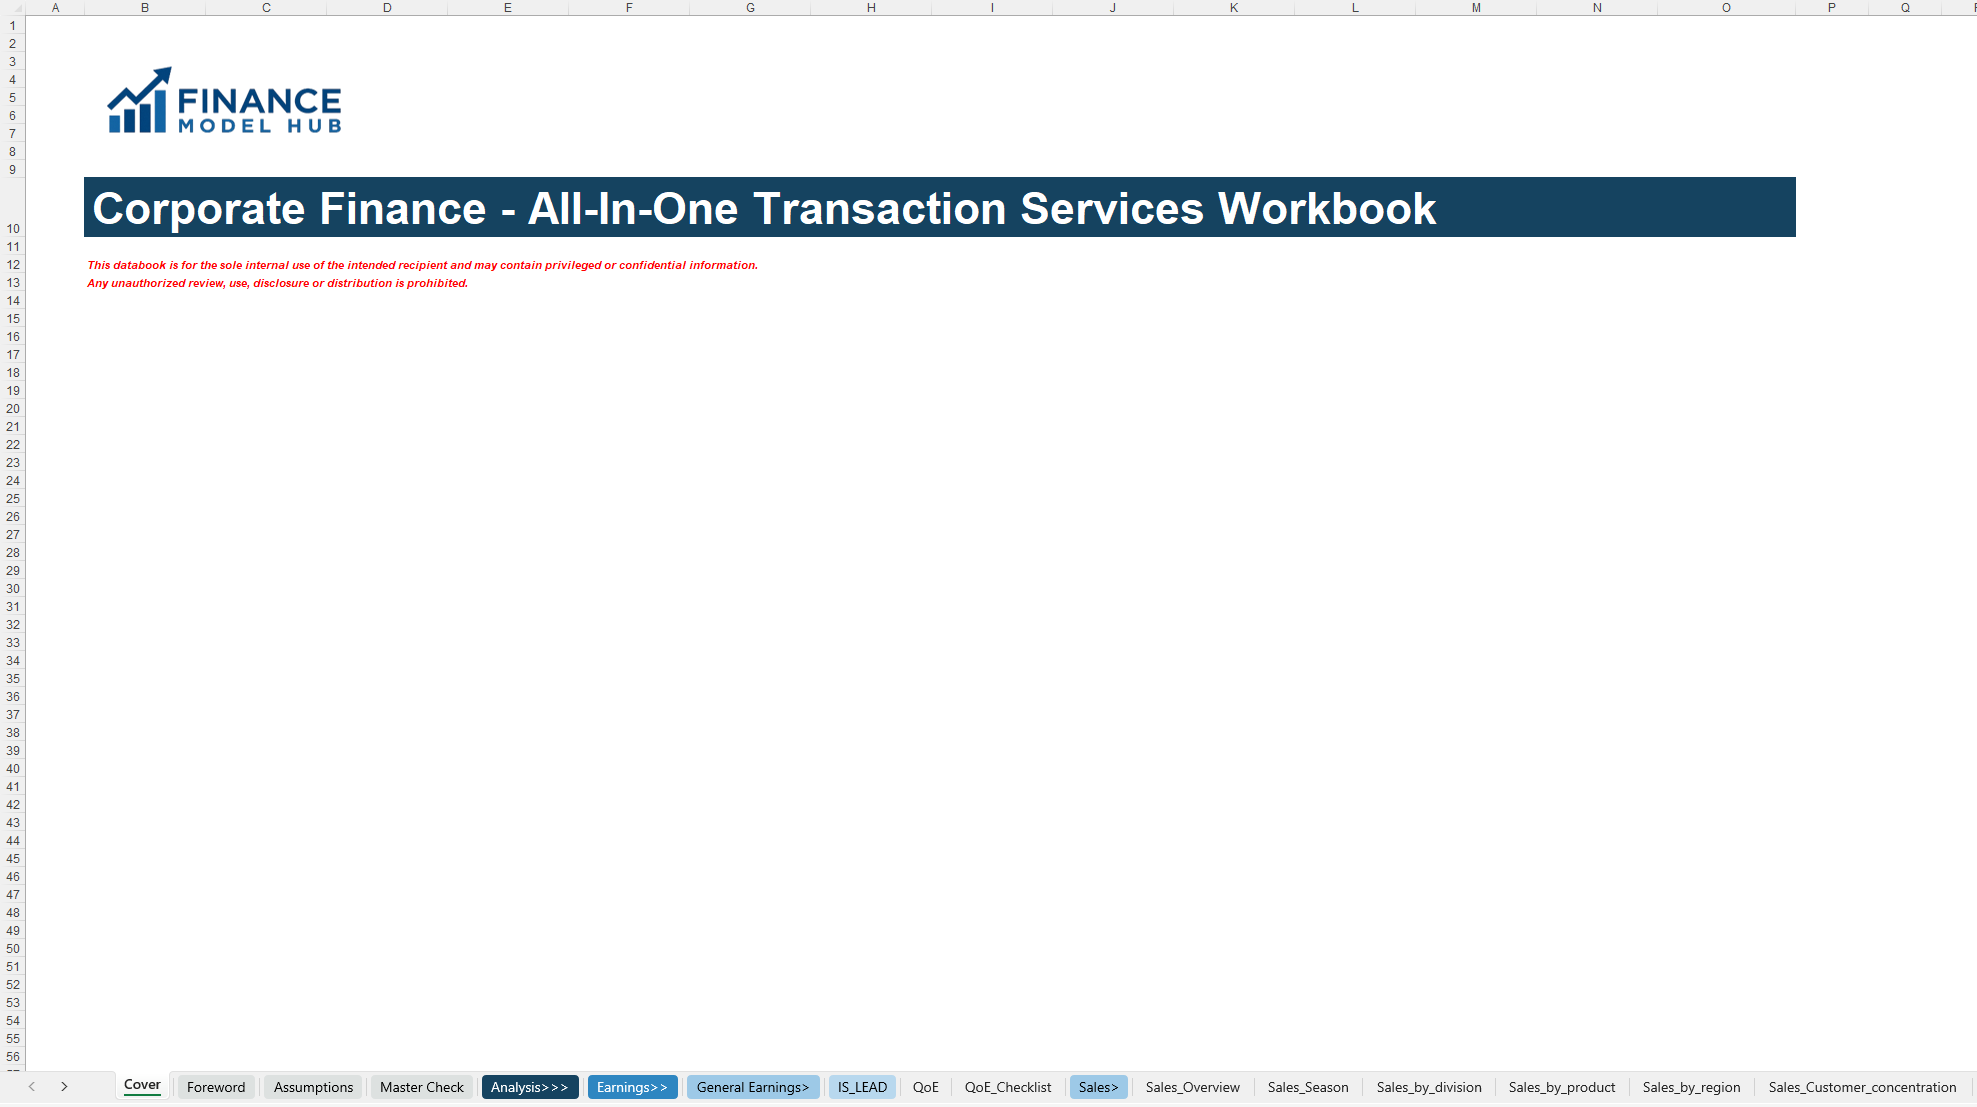
Transaction Services – FDD All-in-One Excel Workbook
This all-in-one FDD workbook for Transaction Services provides a holistic view across earnings (incl. QoE), working capital and net debt/net assets.
Independent financial analyst with a focus on valuation, transaction services, M&A analyses.Follow
all-in-one financial modeltransaction services workbookdue diligence modelquality of earningsworking capitalnet debtsales and profitability analysisnet assetsfactbook templatem&a analysis
Description
This model COMBINES and EXPANDS the following models: Corporate Finance - Sales and Profitability Analysis Model; Corporate Finance - Quality of Earnings Model; Corporate Finance - Net Debt Analysis Model and Corporate Finance - Working Capital Analysis Model
Note: Free demo files with sample data are available on this channel. Click here to download the free demo file for this model: Corporate Finance - All-In-One Transaction Services Workbook - DEMO - Eloquens
Purpose of the tool
This Excel-based Transaction Services All-in-One Financial Analysis Workbook brings together all core TS workstreams in a single integrated file. It combines Quality of Earnings (QoE), multi-dimensional sales & profitability analysis, Working Capital (incl. aging), Net Debt & debt-like items, Net Asset / balance sheet analysis, as well as additional modules such as Current Year Trading (CYT) and business plan linkage.
Starting from trial balance and basic sales detail, the workbook guides you through mapping, classifications, adjustments and pro-forma entries and consolidates them into decision-ready outputs: bridges, KPIs, dashboards and tables suitable for inclusion in factbooks, IC decks or due diligence reports. The structure is audit-friendly and designed to keep Earnings, Working Capital, Net Debt and commercial views fully consistent with each other.
The tool is particularly useful for Transaction Services, financial & commercial due diligence and factbook preparation, but can also serve as a robust integrated management reporting and analysis framework for recurring internal reviews.
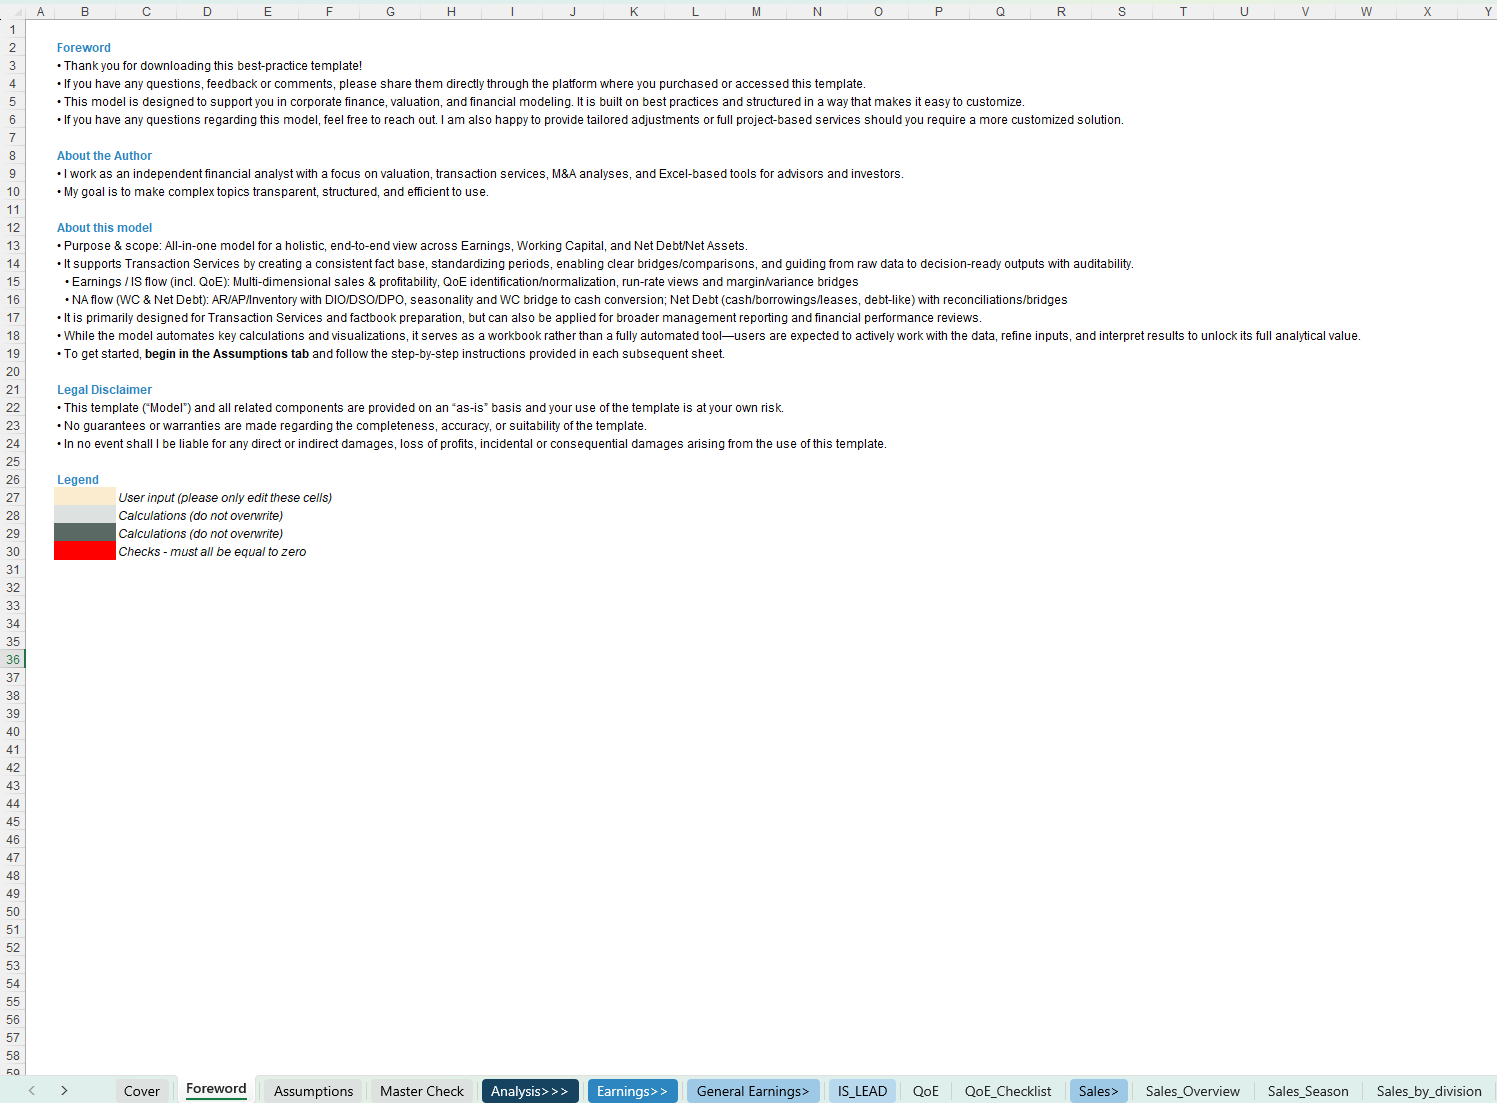
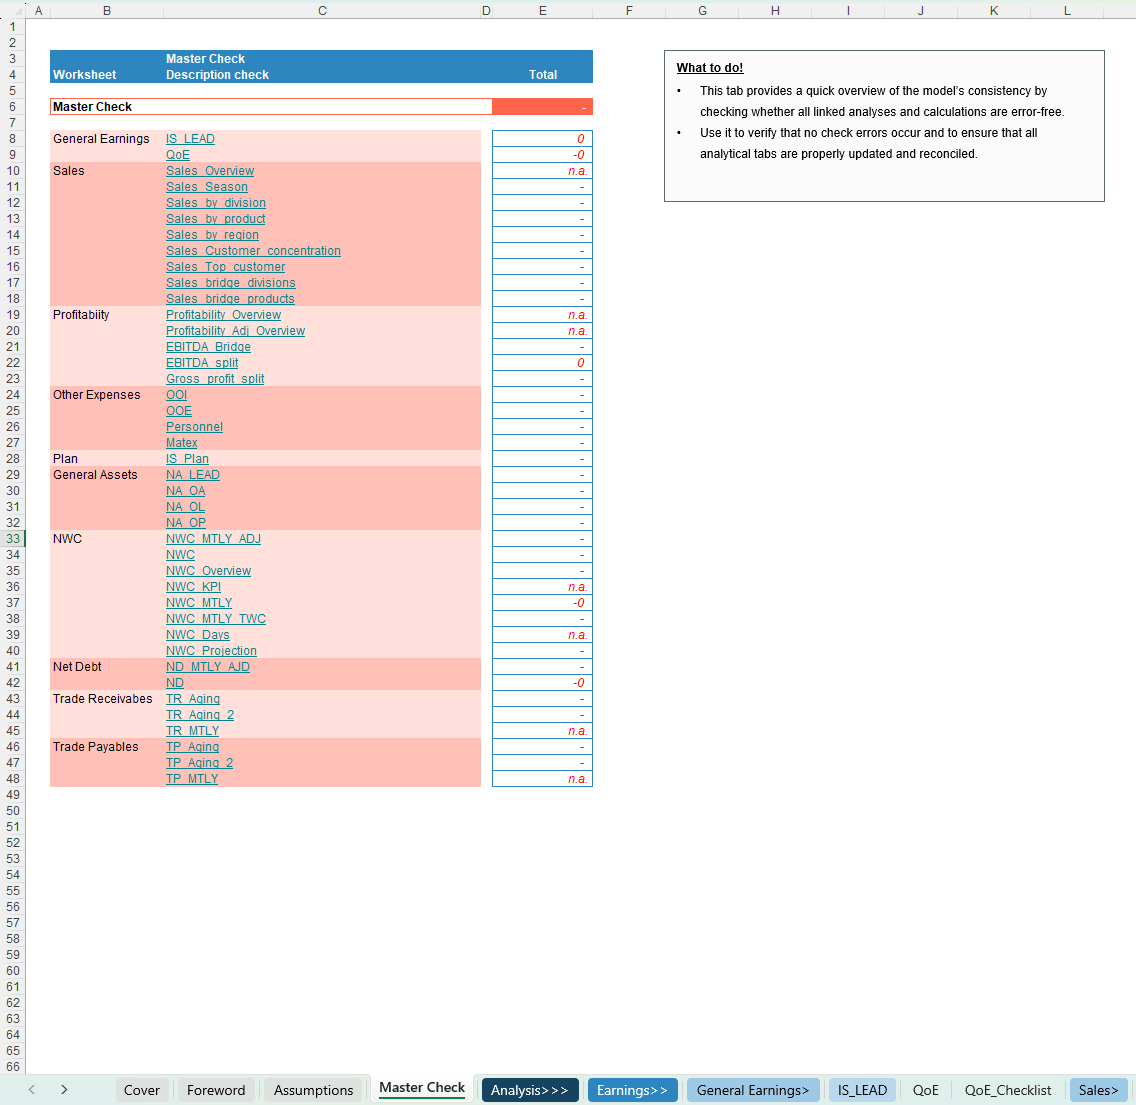
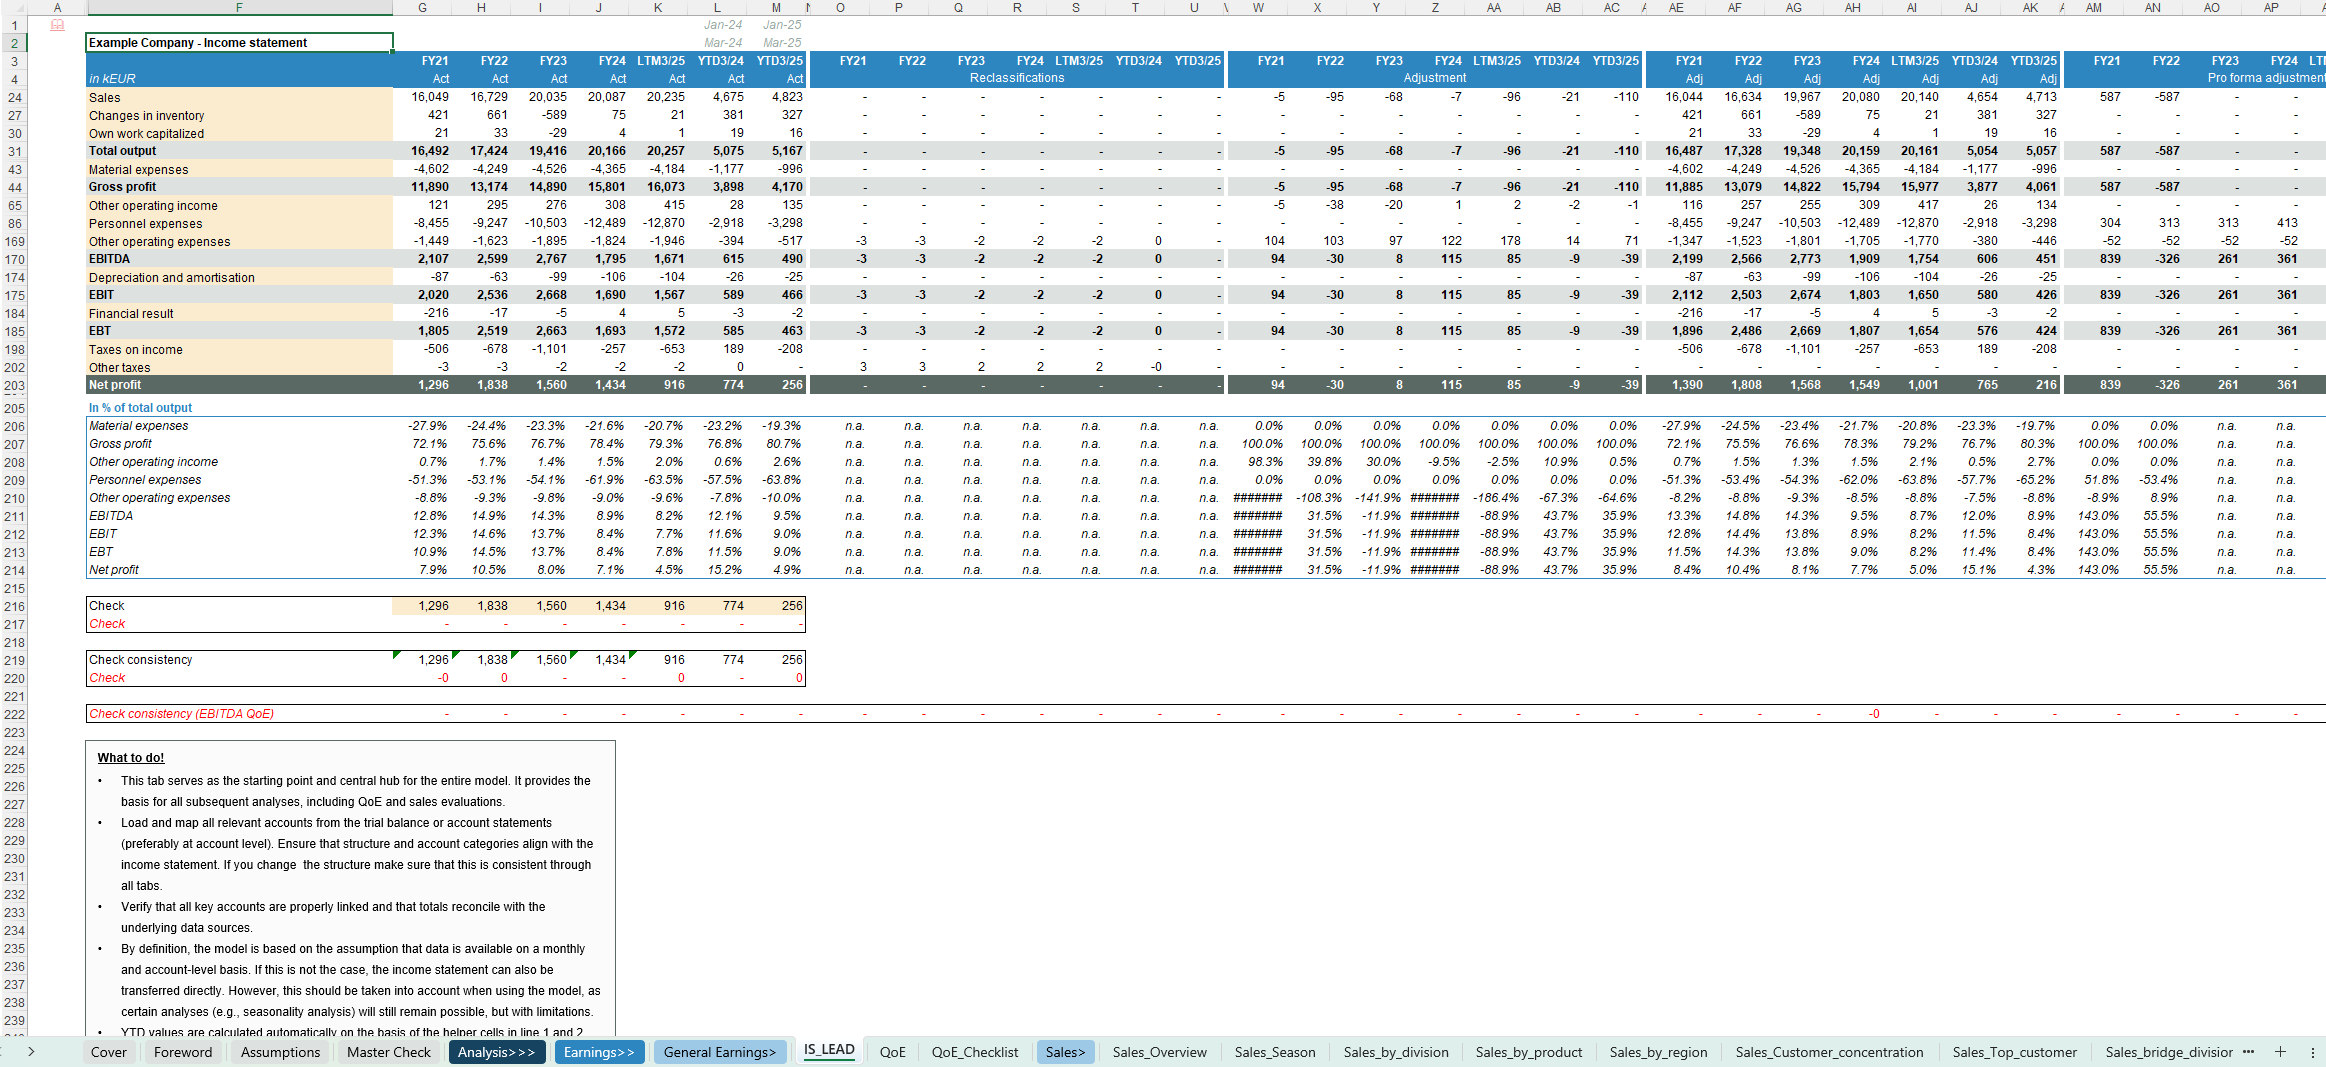
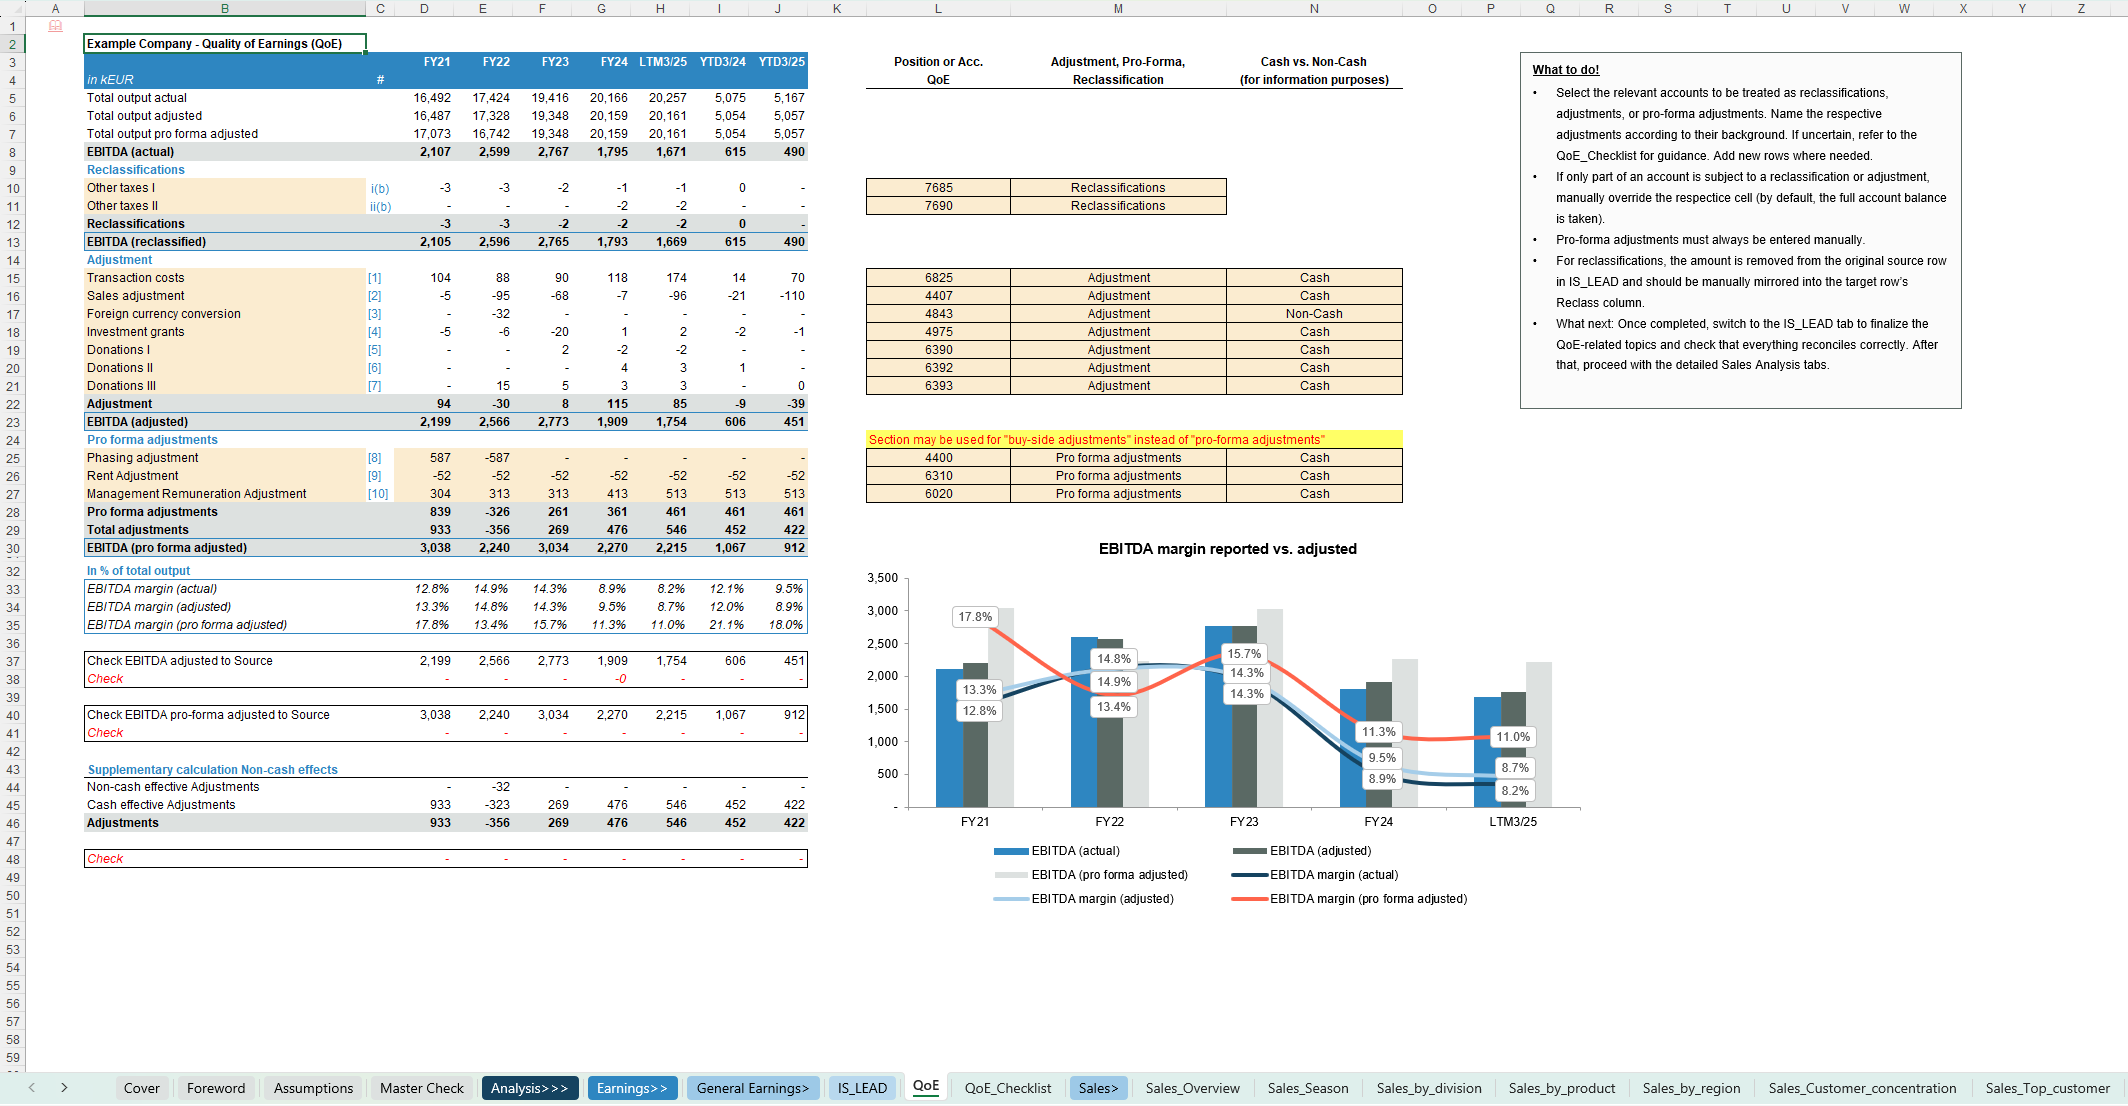
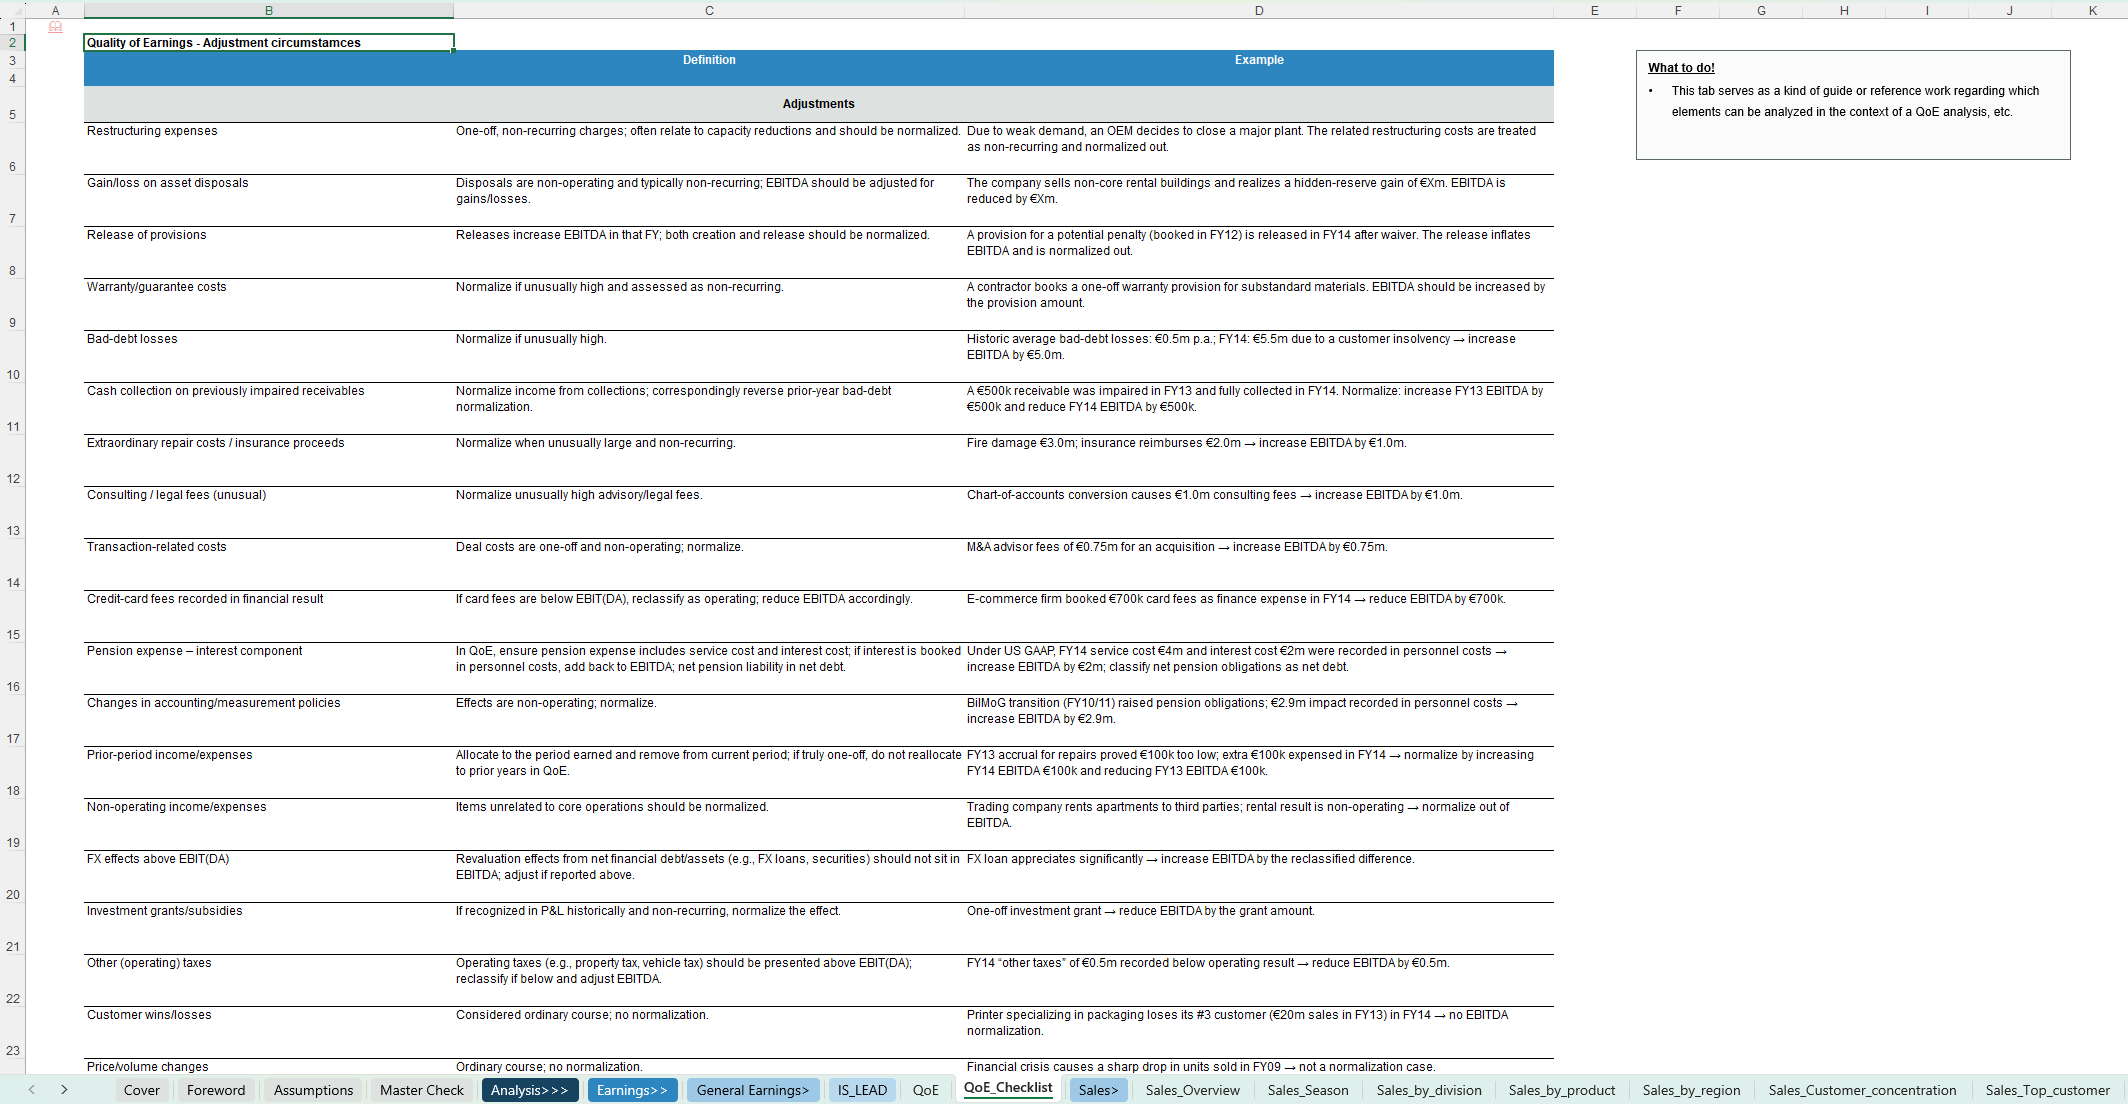
Each sheet includes a short “What to do / What to know” box with practical instructions, so you always know exactly what is expected on that tab and how it feeds into the overall model.
Key Outputs
Key Inputs & Assumptions
How to use
Customization & support
The workbook is highly customisable – you can easily adapt categories, segment structures, labels, KPIs and charts to your firm standards, sector specifics or lender / investor reporting requirements. For more complex customisations or individual needs (e.g. firm-branded versions, additional modules, integration with existing templates or client-specific setups), feel free to reach out and we can discuss a tailored solution.
Each download includes both a fully blank “Clean Template” for working directly with your own data and a pre-populated Example Template that illustrates the model’s logic and calculations using realistic sample data.
The screenshots provide a good first impression of the model, but they do not fully capture all functionalities and details—if you have any questions or would like to better understand specific features, feel free to reach out anytime.
This model COMBINES and EXPANDS the following models: Corporate Finance - Sales and Profitability Analysis Model; Corporate Finance - Quality of Earnings Model; Corporate Finance - Net Debt Analysis Model and Corporate Finance - Working Capital Analysis Model
Note: Free demo files with sample data are available on this channel. Click here to download the free demo file for this model: Corporate Finance - All-In-One Transaction Services Workbook - DEMO - Eloquens
Purpose of the tool
This Excel-based Transaction Services All-in-One Financial Analysis Workbook brings together all core TS workstreams in a single integrated file. It combines Quality of Earnings (QoE), multi-dimensional sales & profitability analysis, Working Capital (incl. aging), Net Debt & debt-like items, Net Asset / balance sheet analysis, as well as additional modules such as Current Year Trading (CYT) and business plan linkage.
Starting from trial balance and basic sales detail, the workbook guides you through mapping, classifications, adjustments and pro-forma entries and consolidates them into decision-ready outputs: bridges, KPIs, dashboards and tables suitable for inclusion in factbooks, IC decks or due diligence reports. The structure is audit-friendly and designed to keep Earnings, Working Capital, Net Debt and commercial views fully consistent with each other.
The tool is particularly useful for Transaction Services, financial & commercial due diligence and factbook preparation, but can also serve as a robust integrated management reporting and analysis framework for recurring internal reviews.
Each sheet includes a short “What to do / What to know” box with practical instructions, so you always know exactly what is expected on that tab and how it feeds into the overall model.
Key Outputs
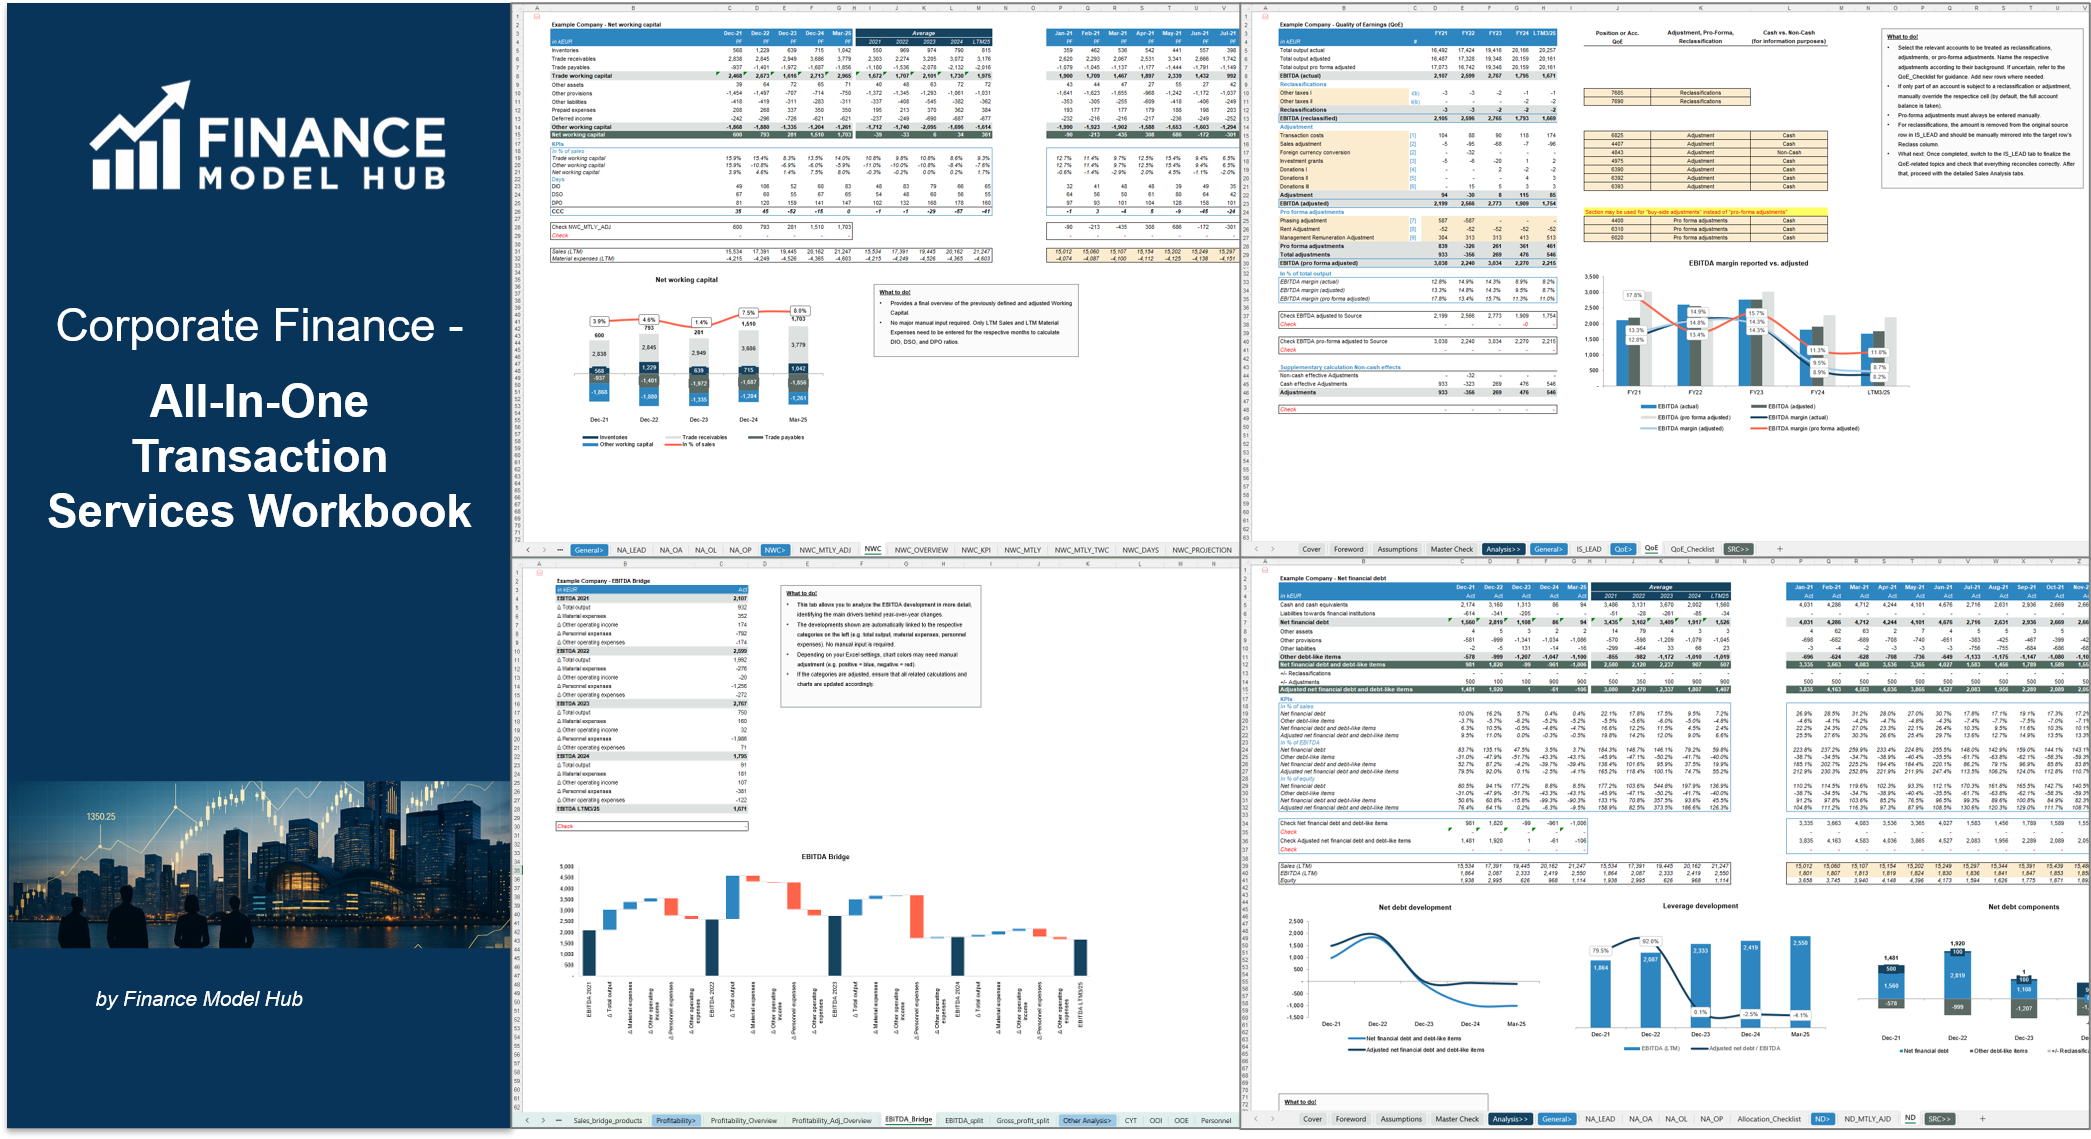
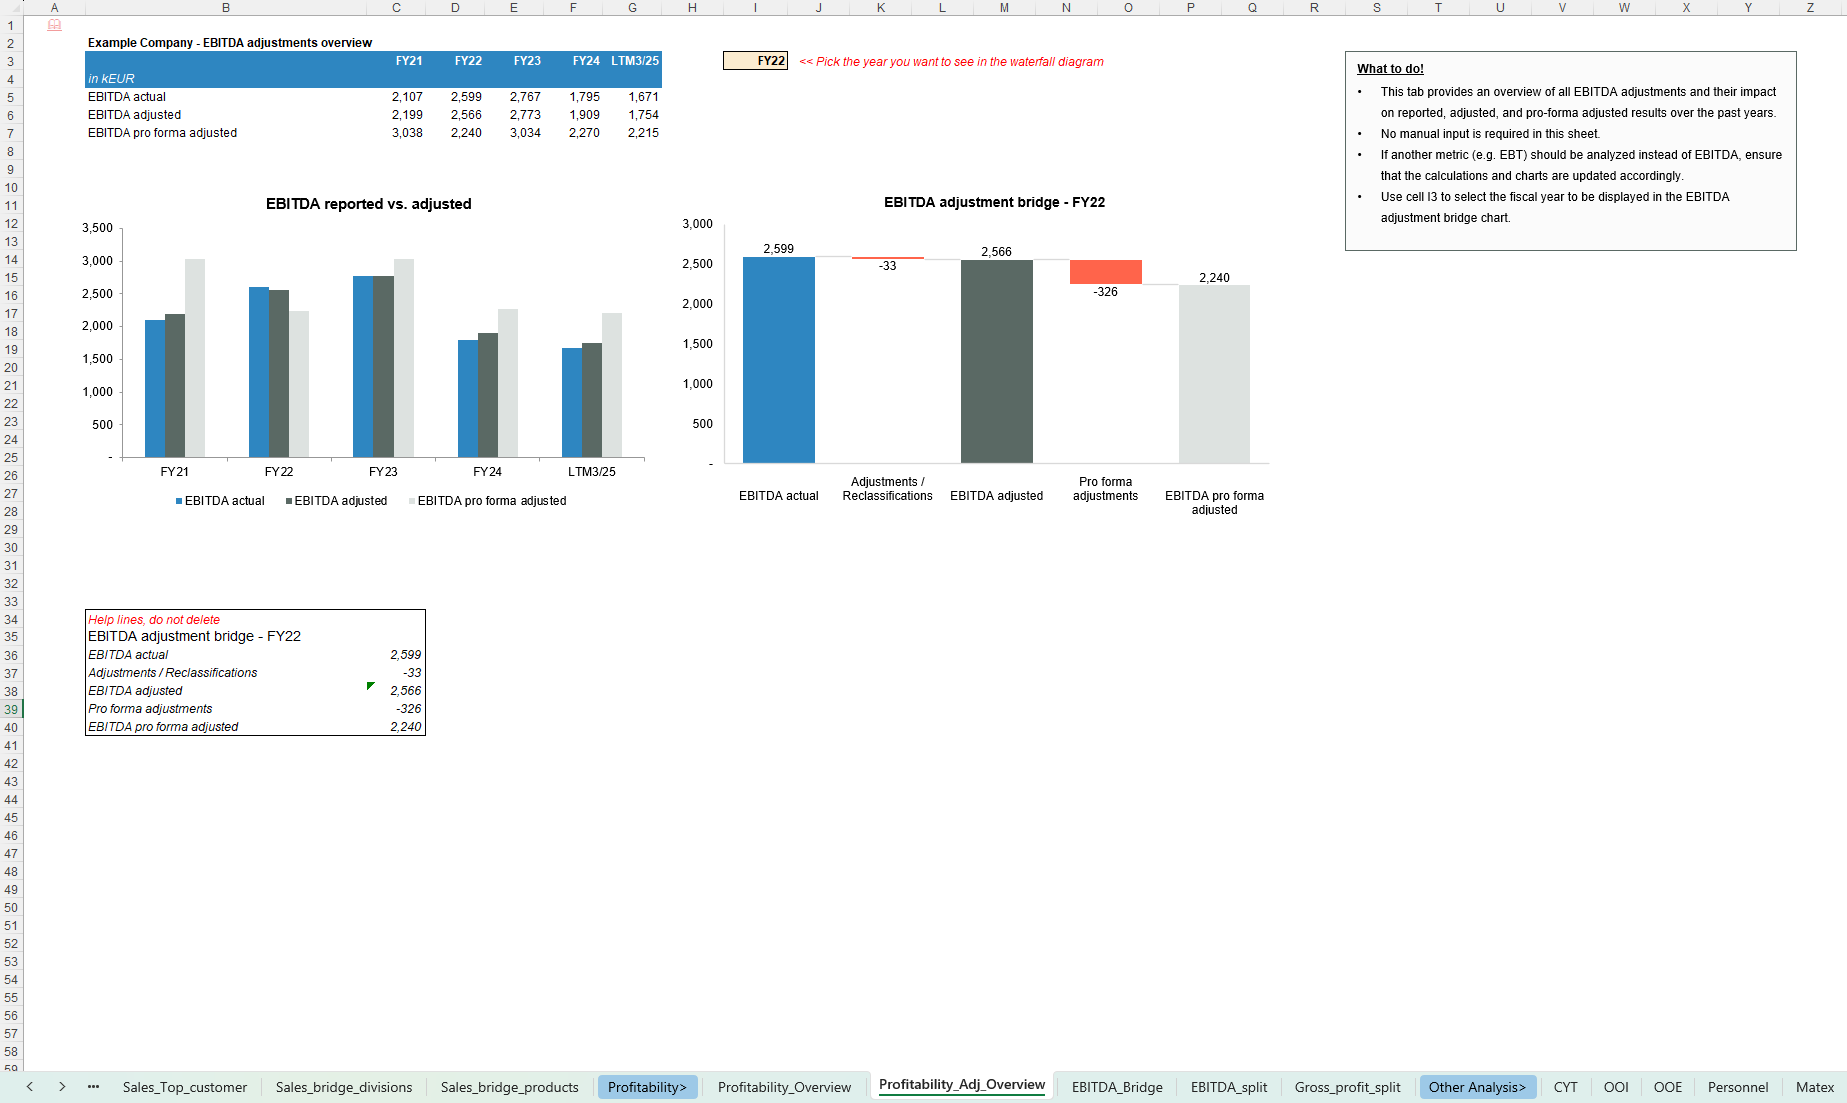
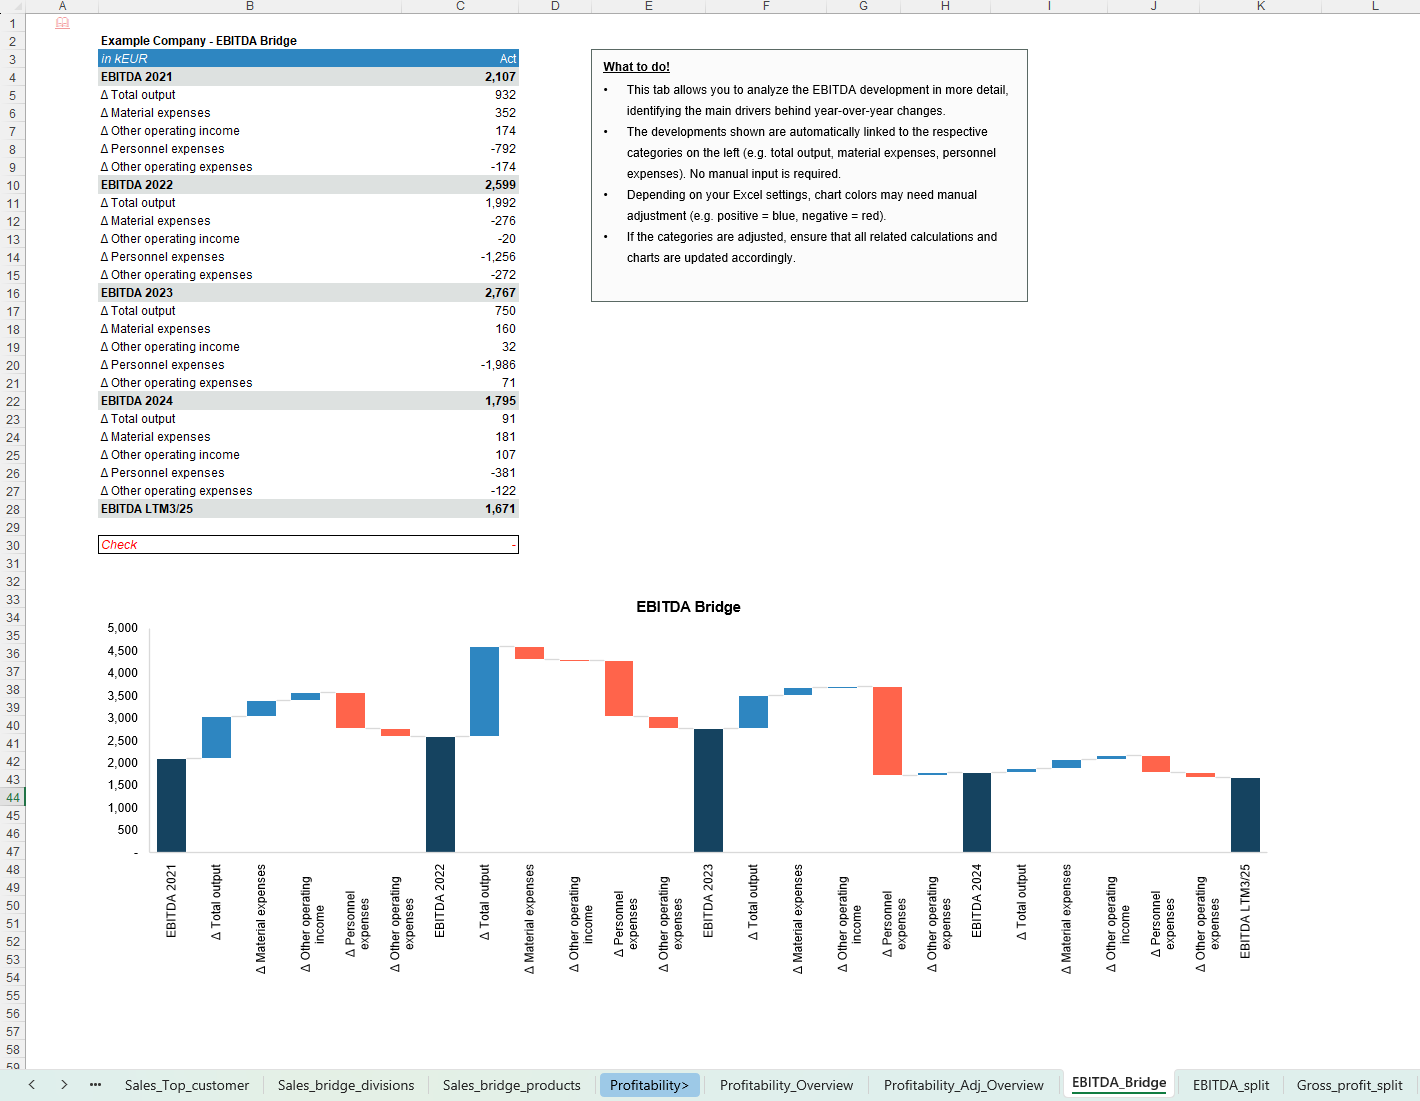
- Earnings / QoE
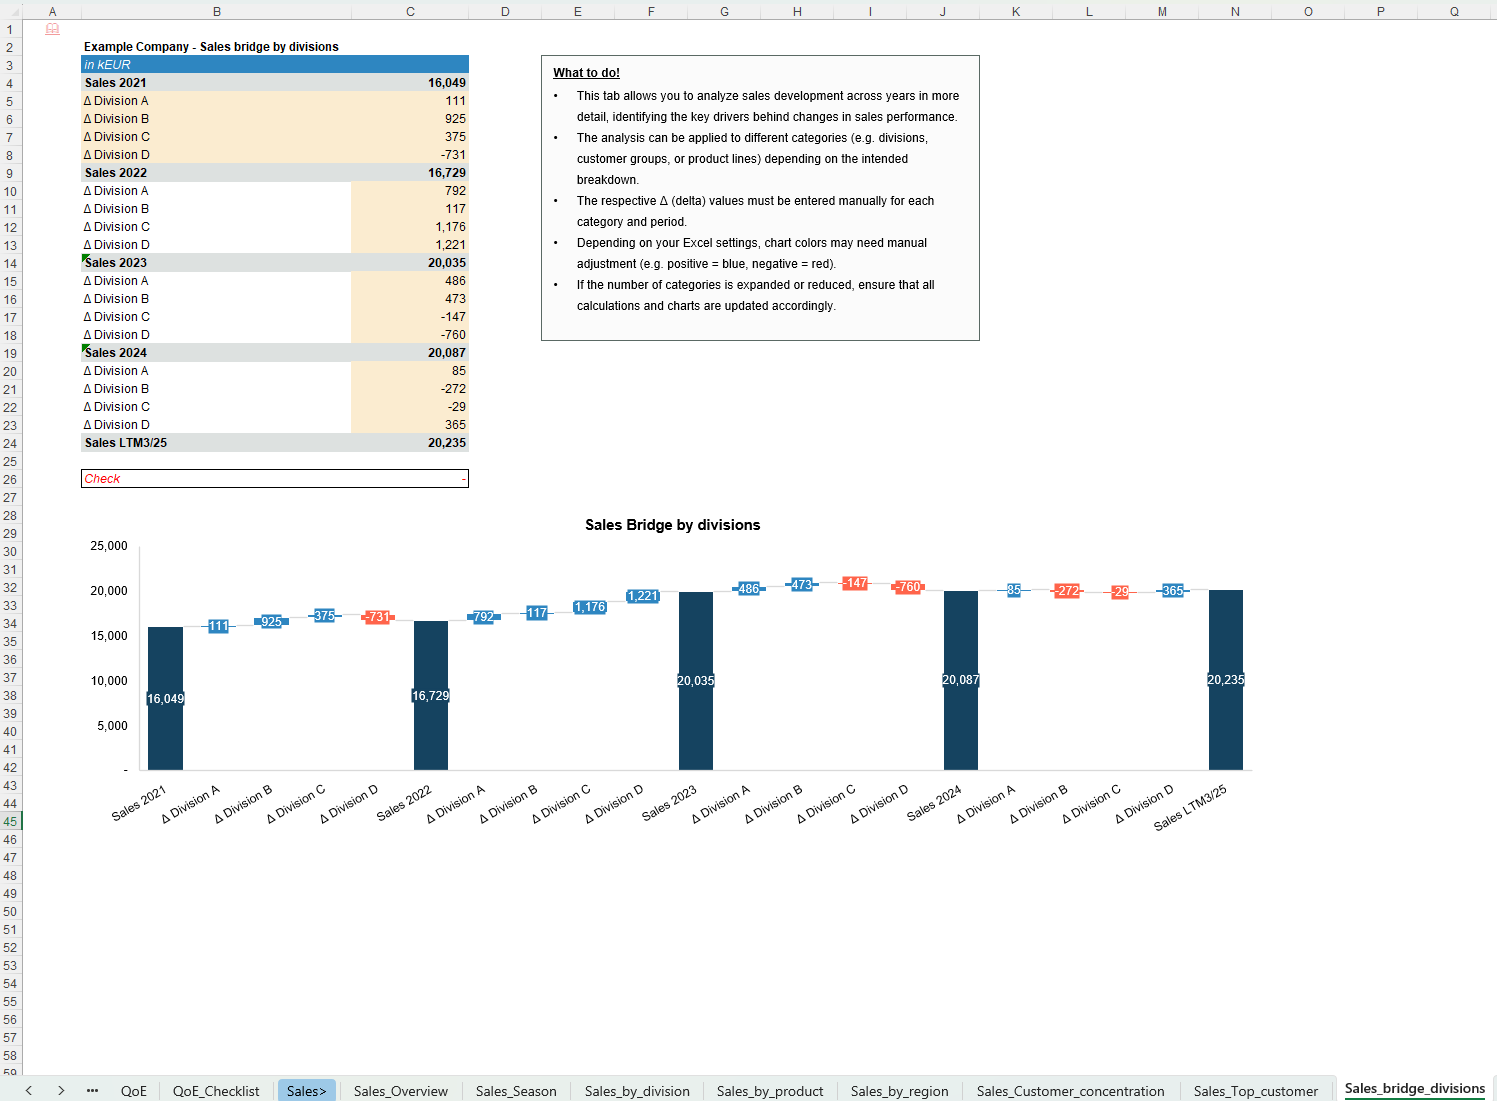
- Reported, adjusted and pro-forma EBITDA and margins
- Structured adjustment schedules (reclassifications, normalisations, pro-forma items) and bridges
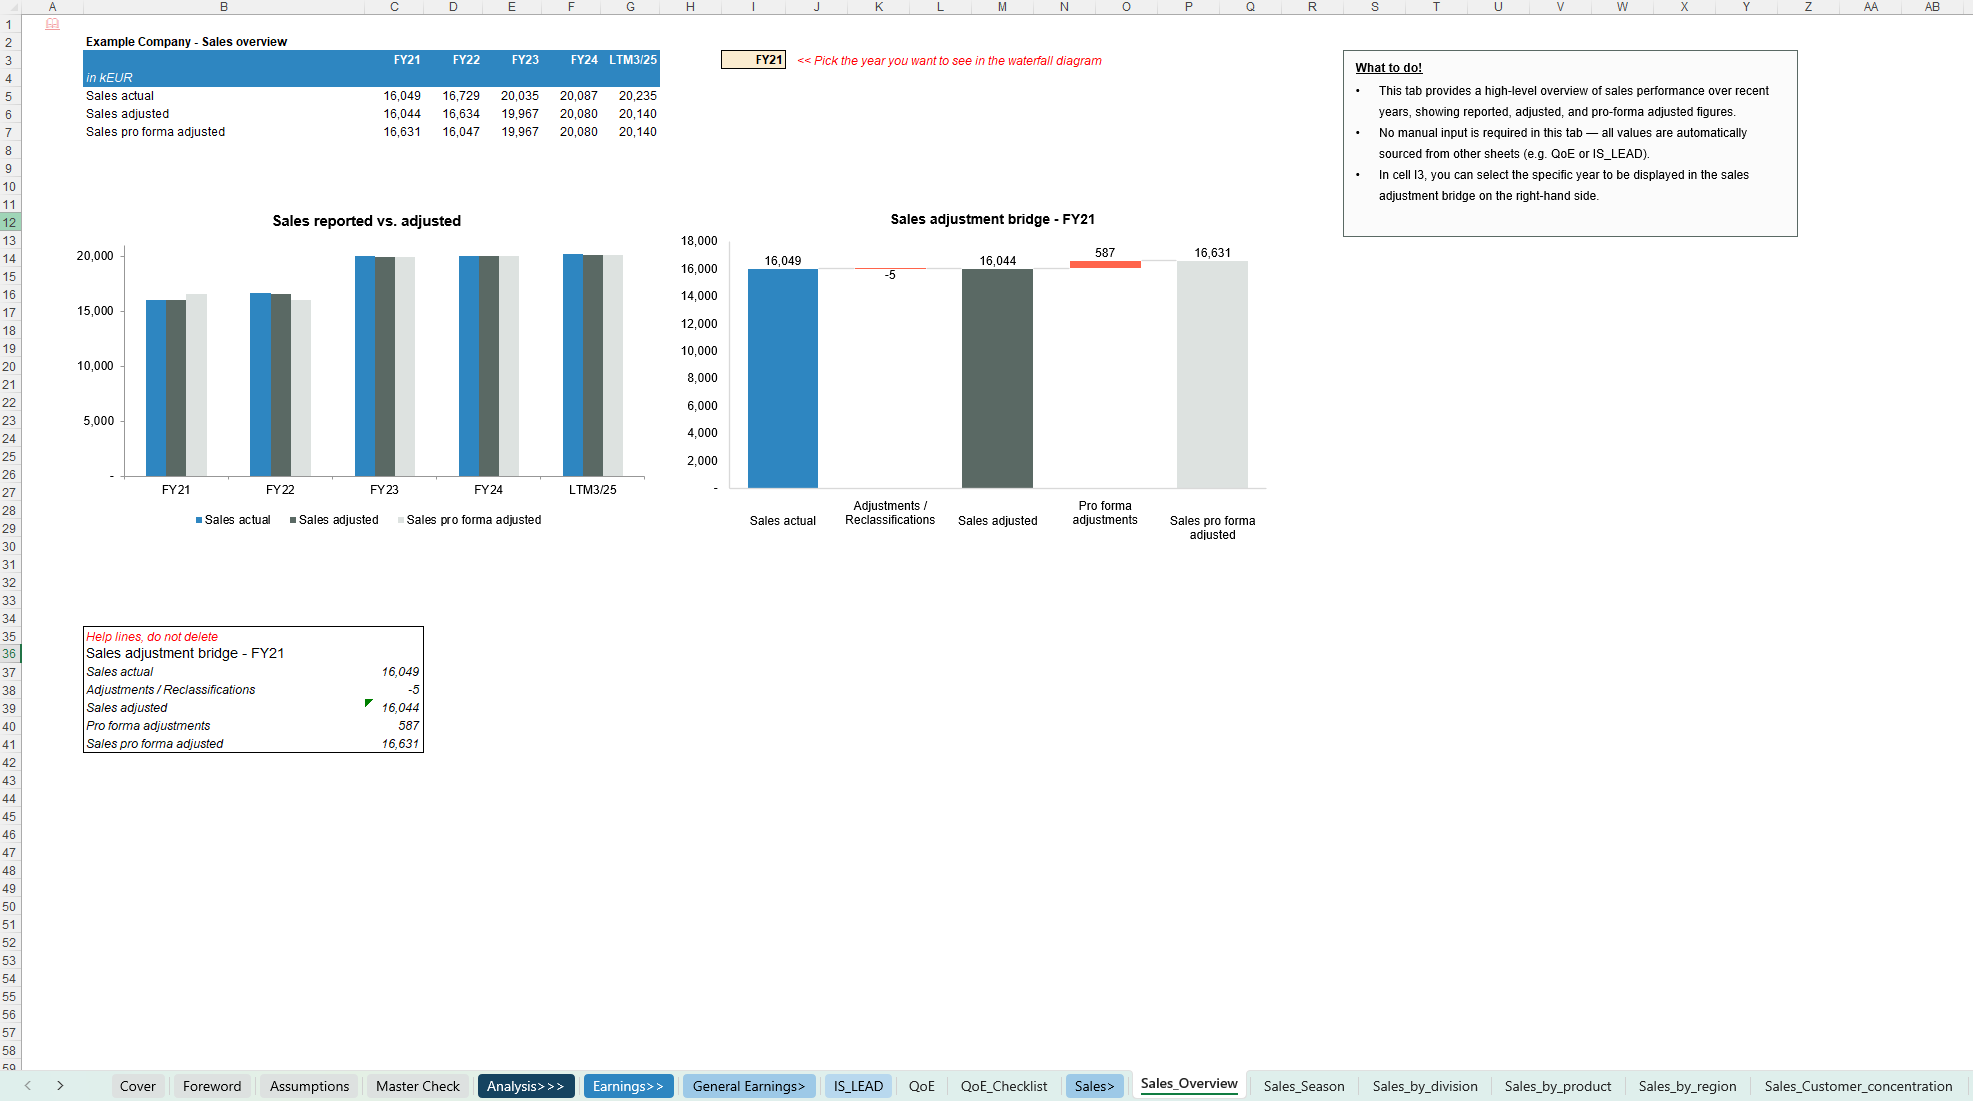
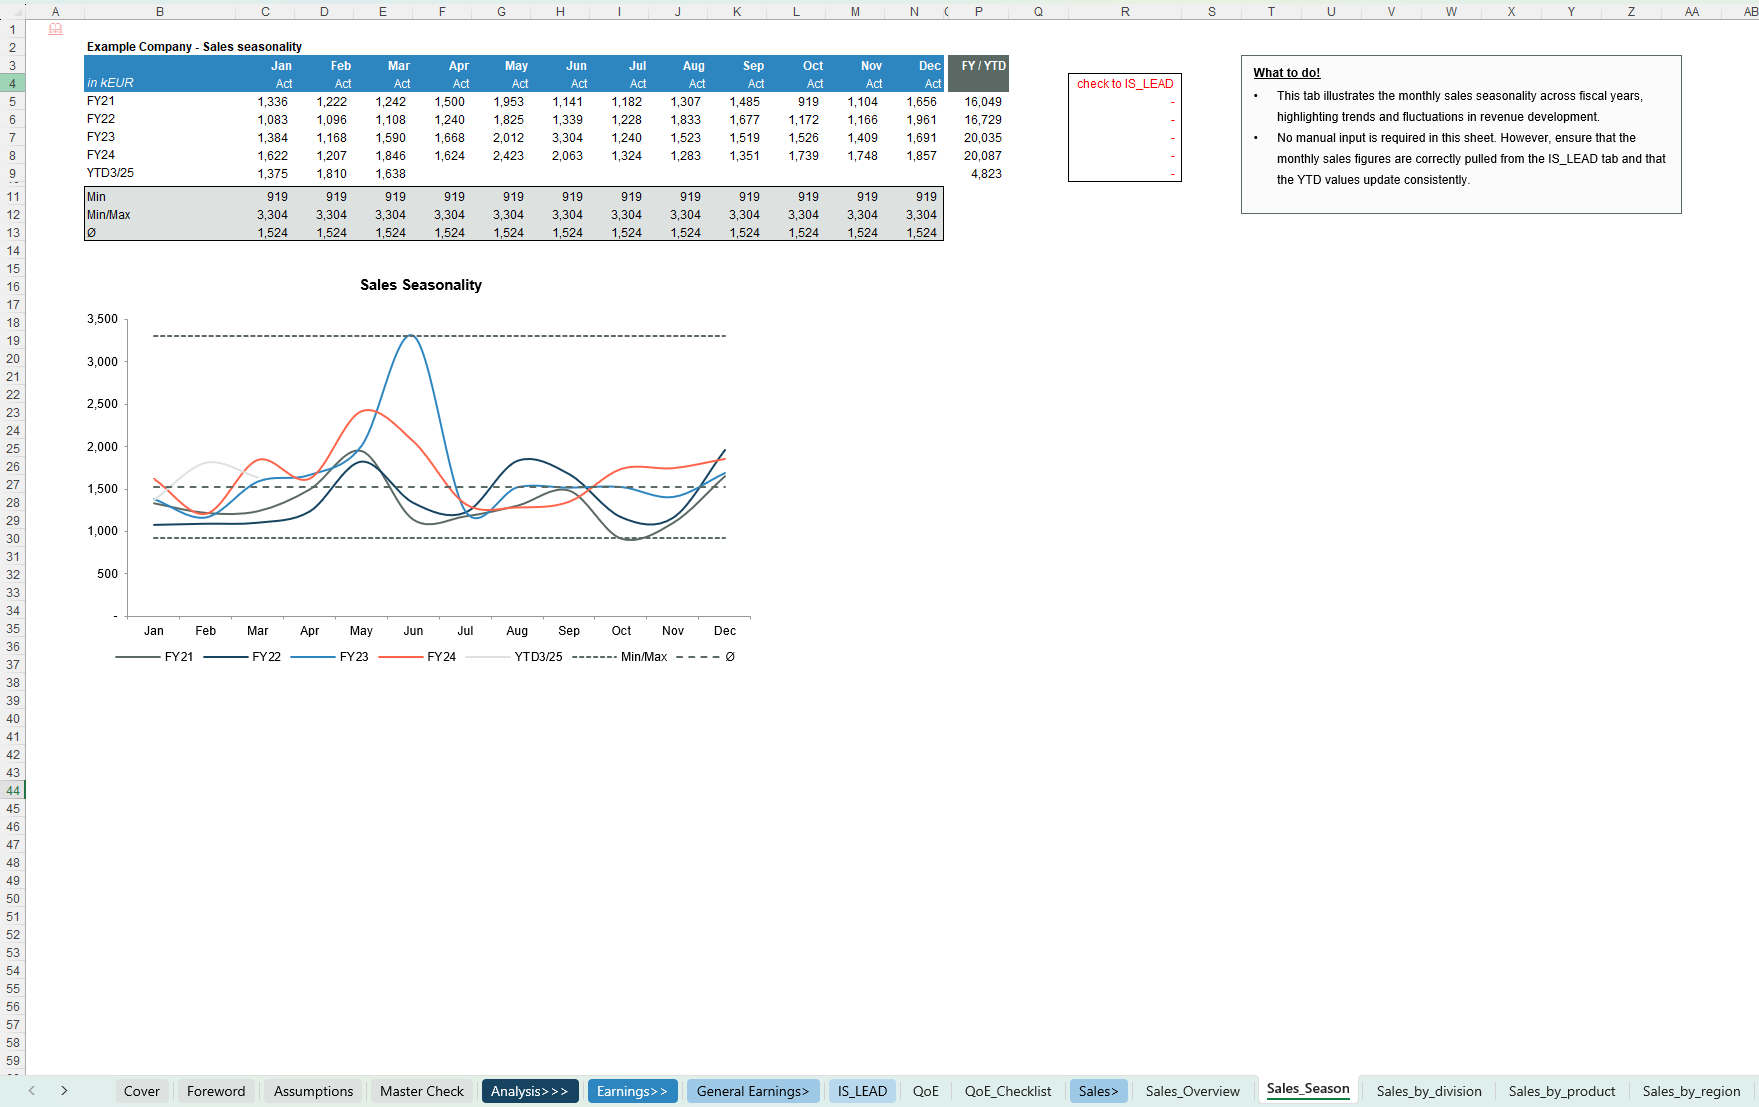
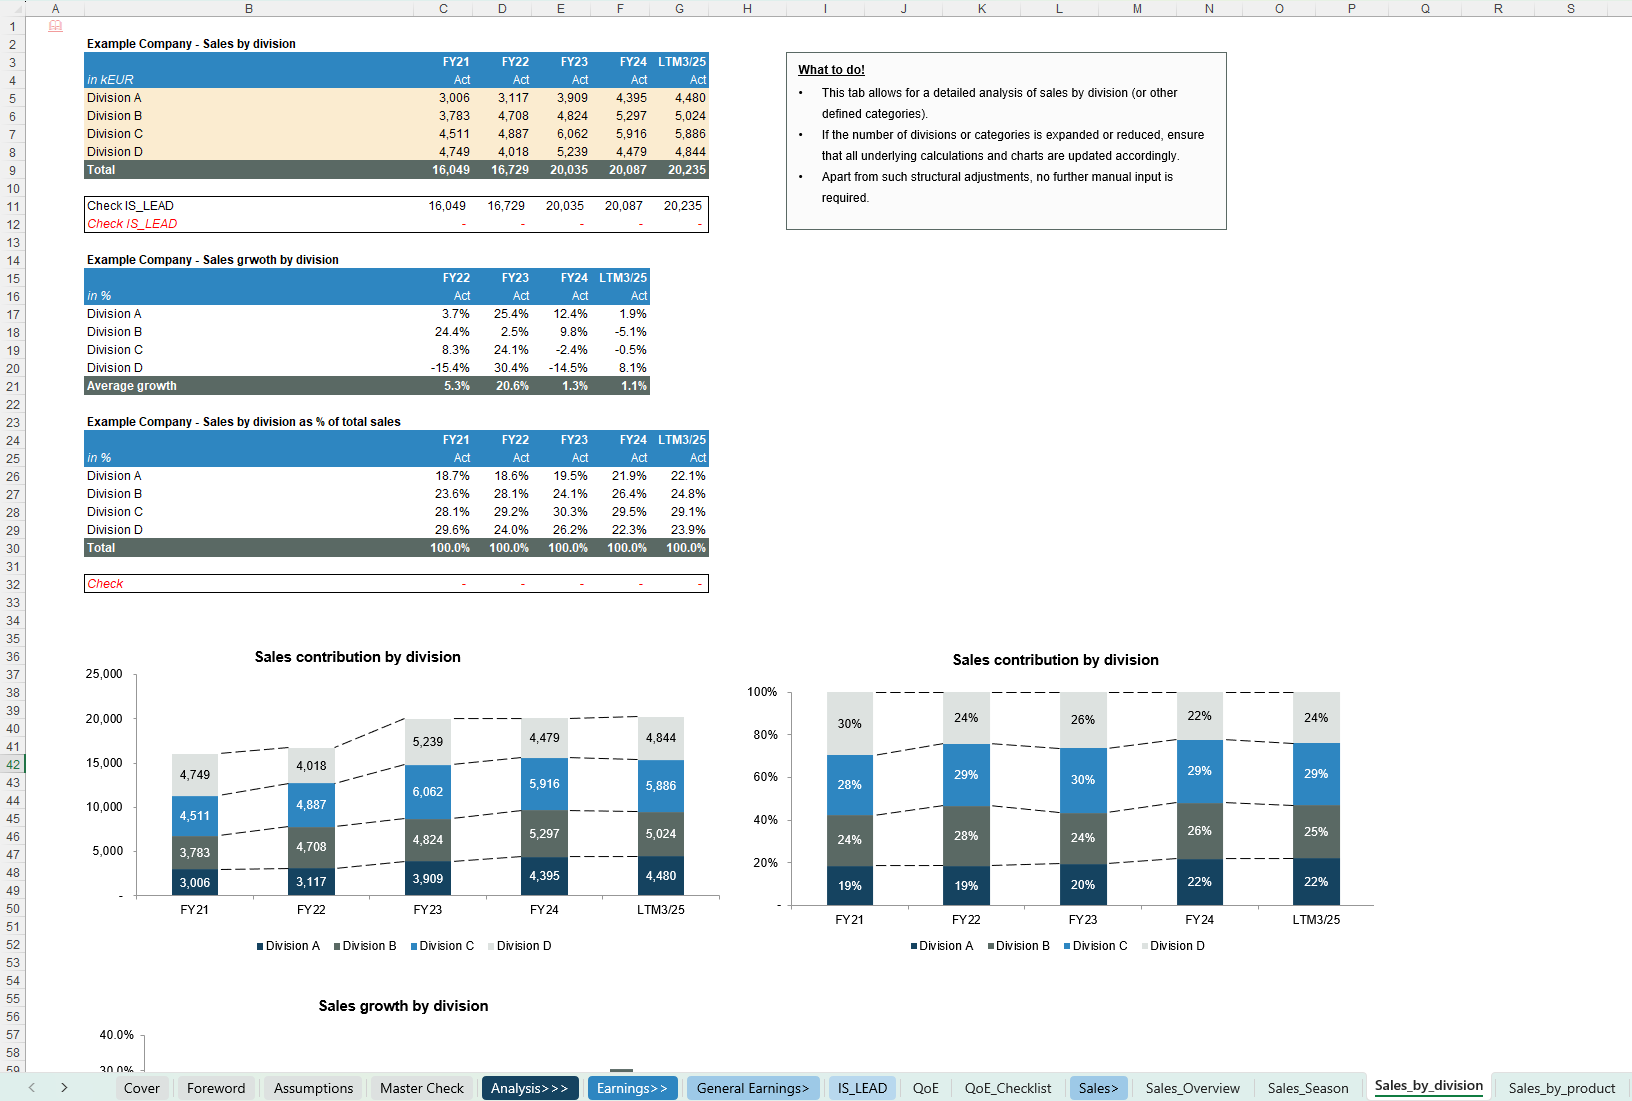
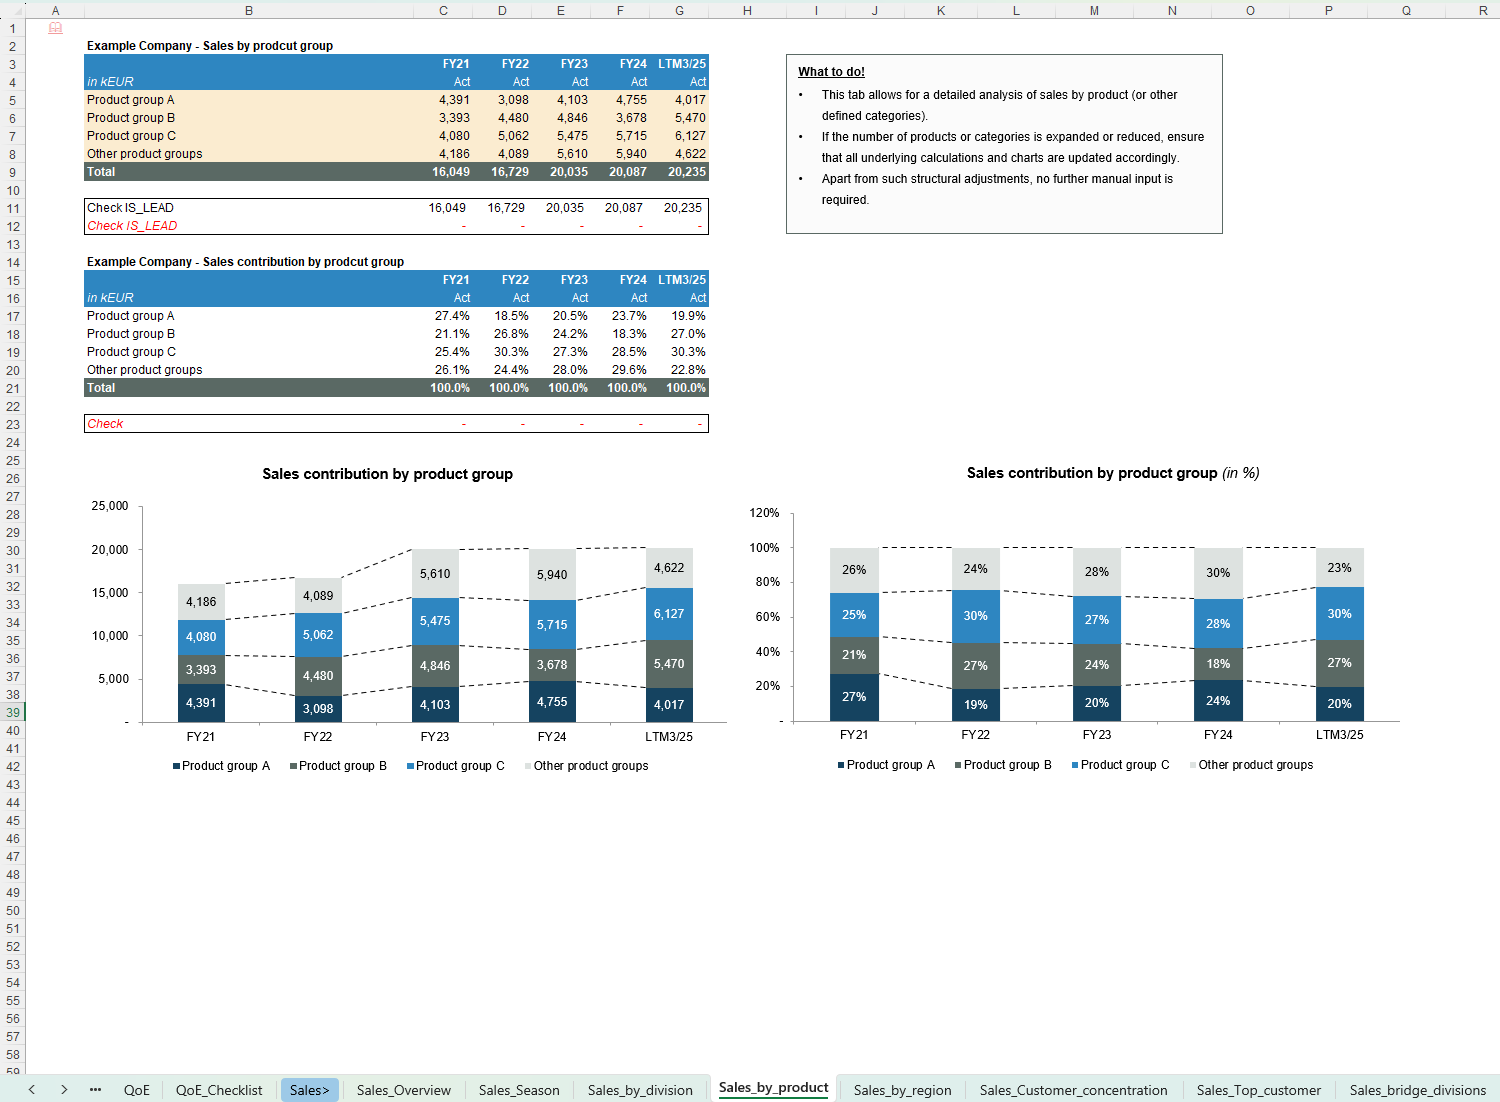
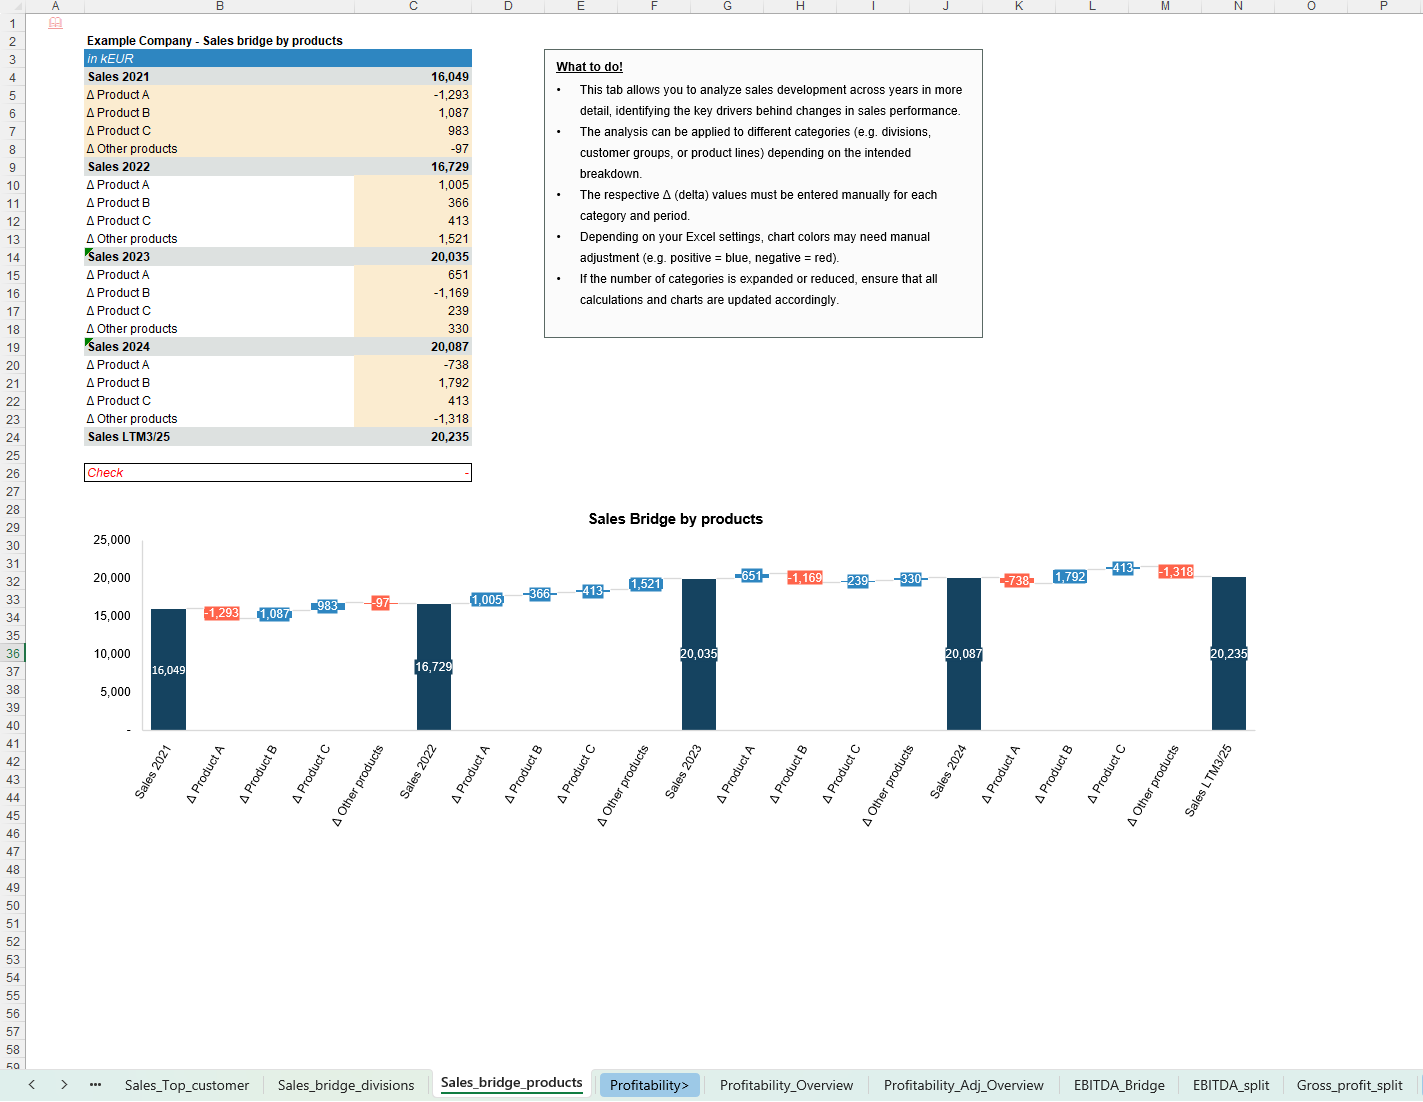
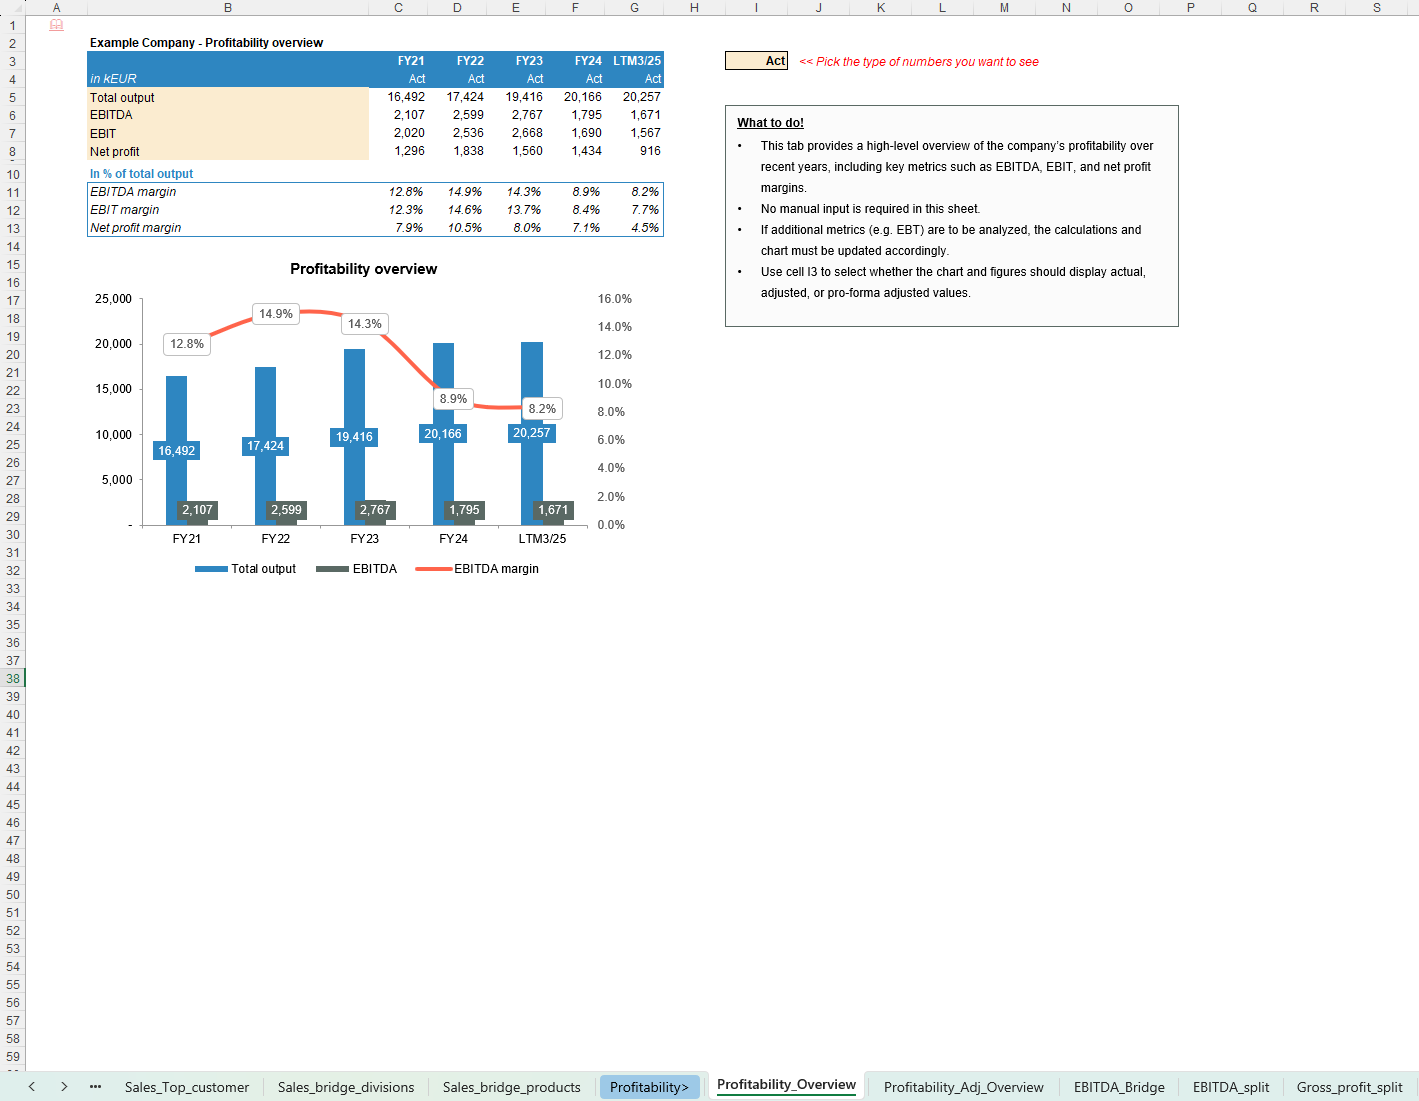
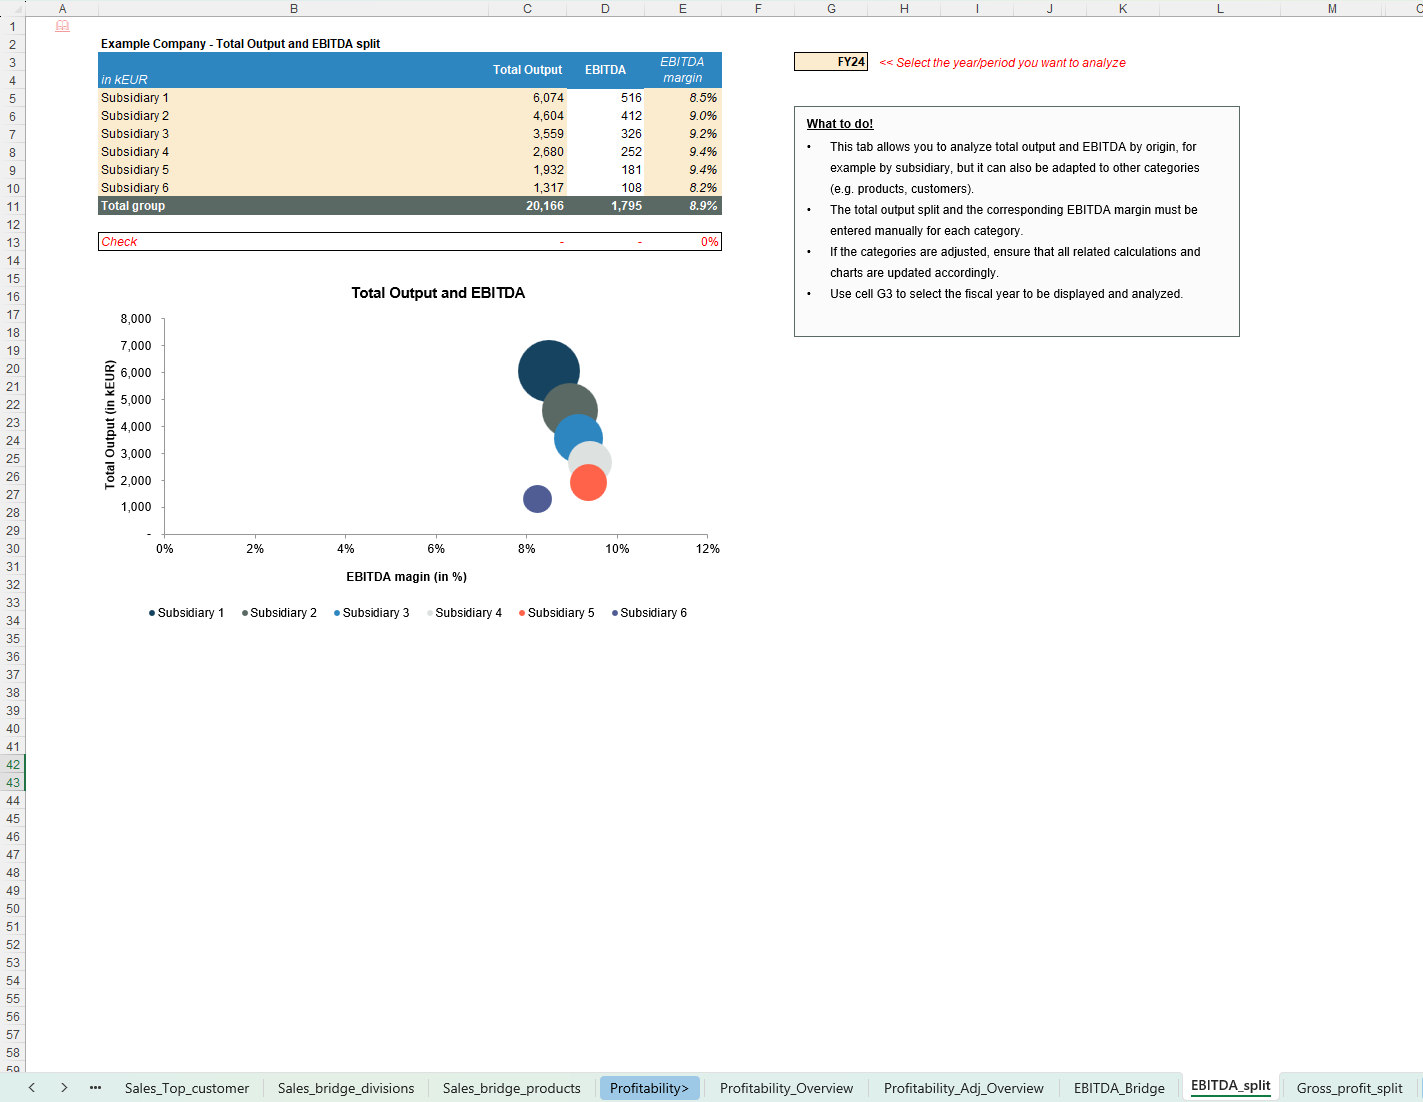
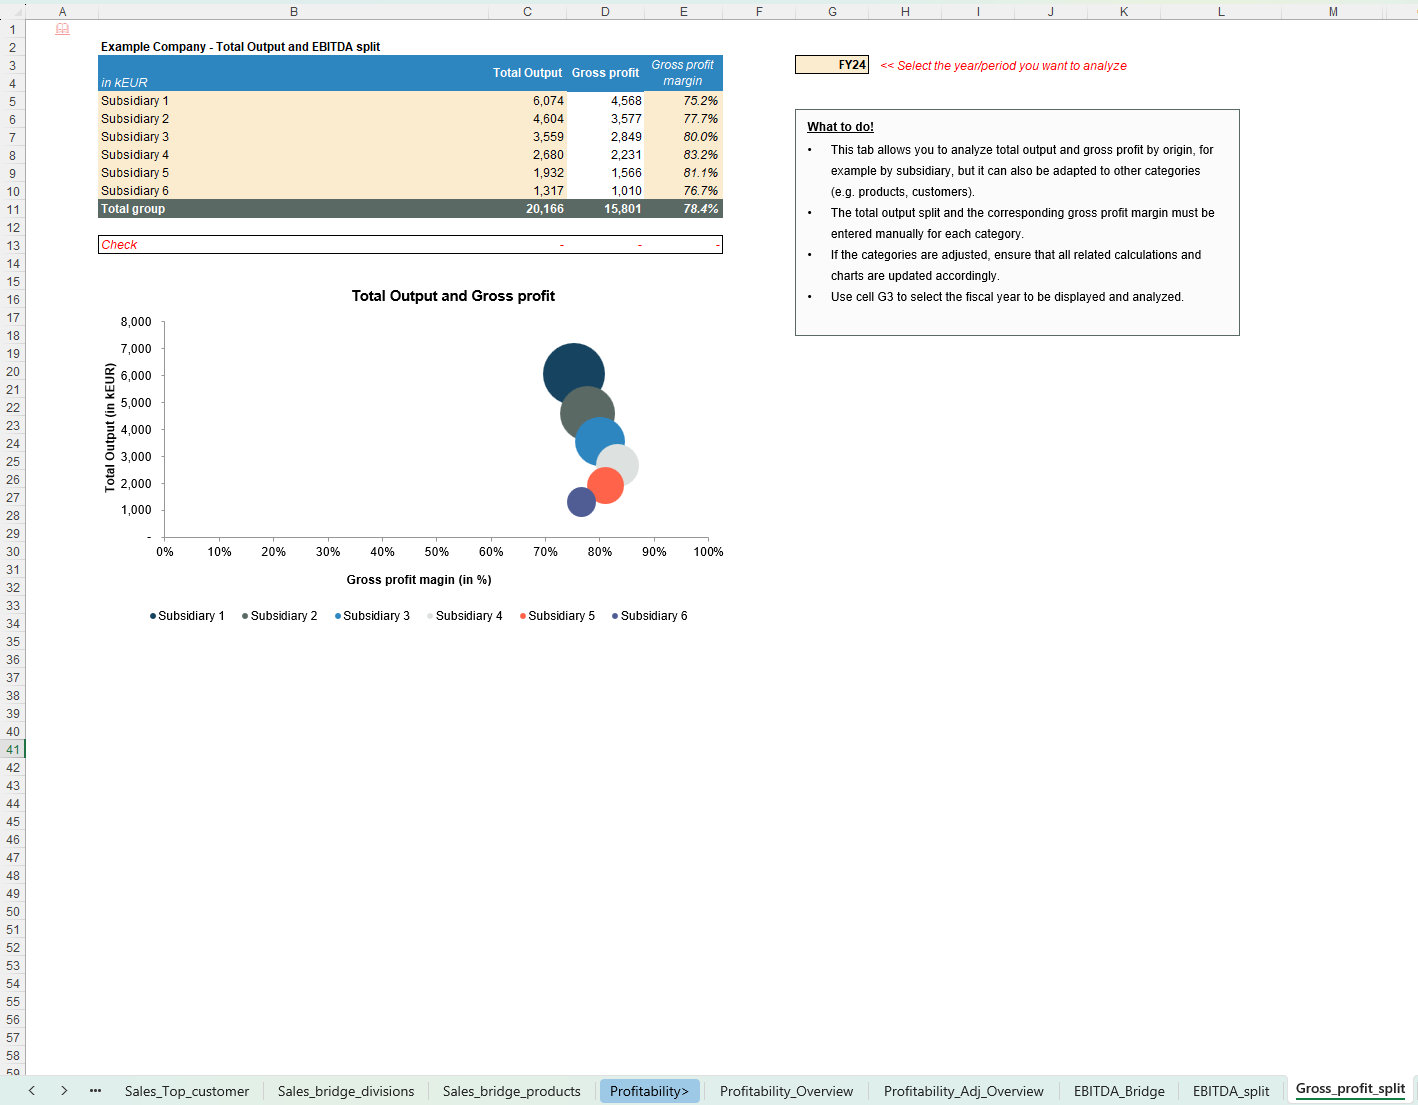
- Sales & profitability
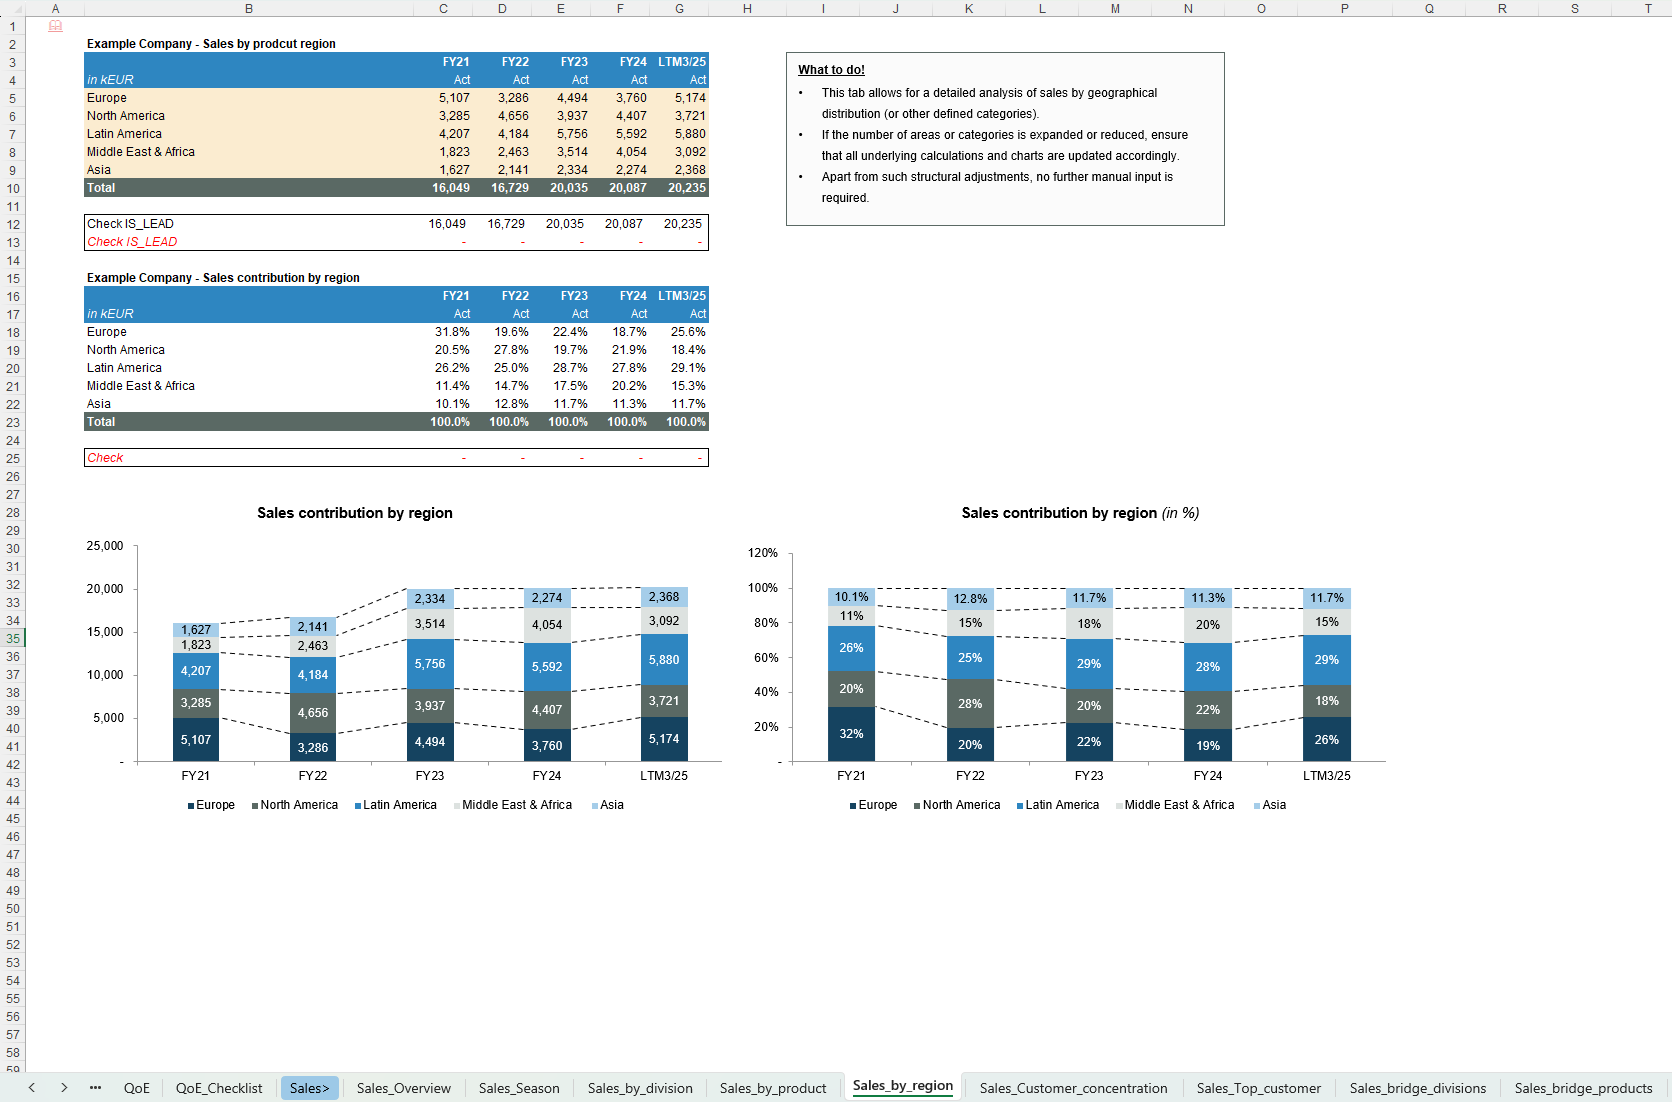
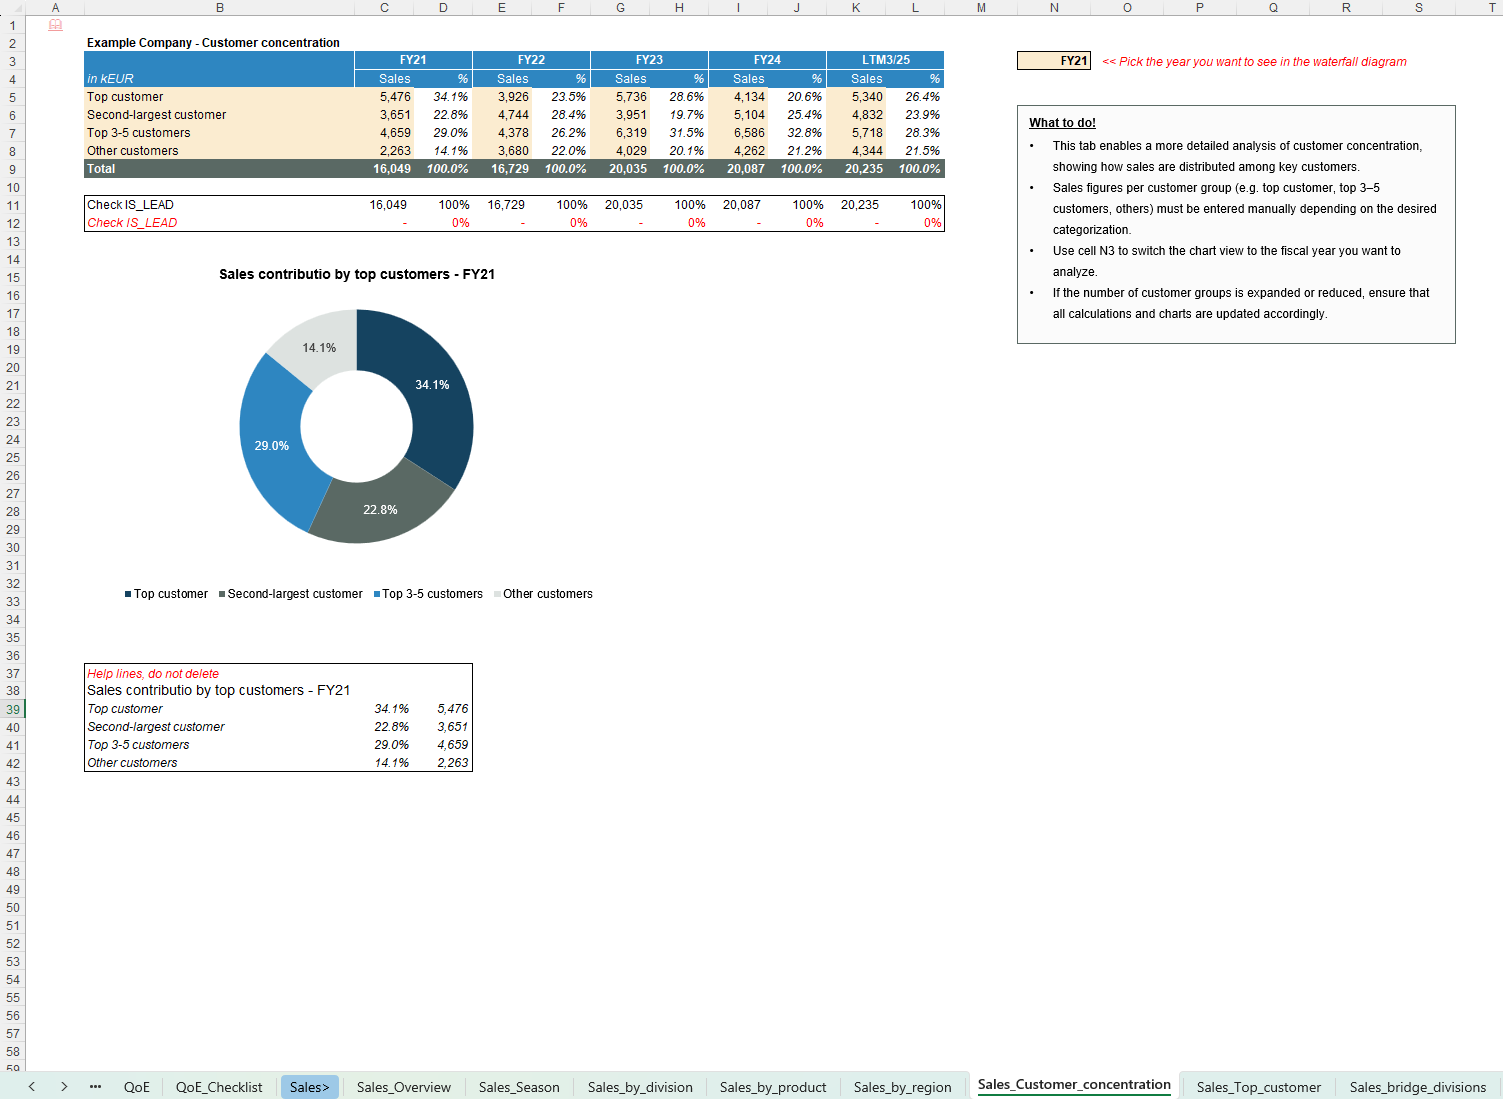
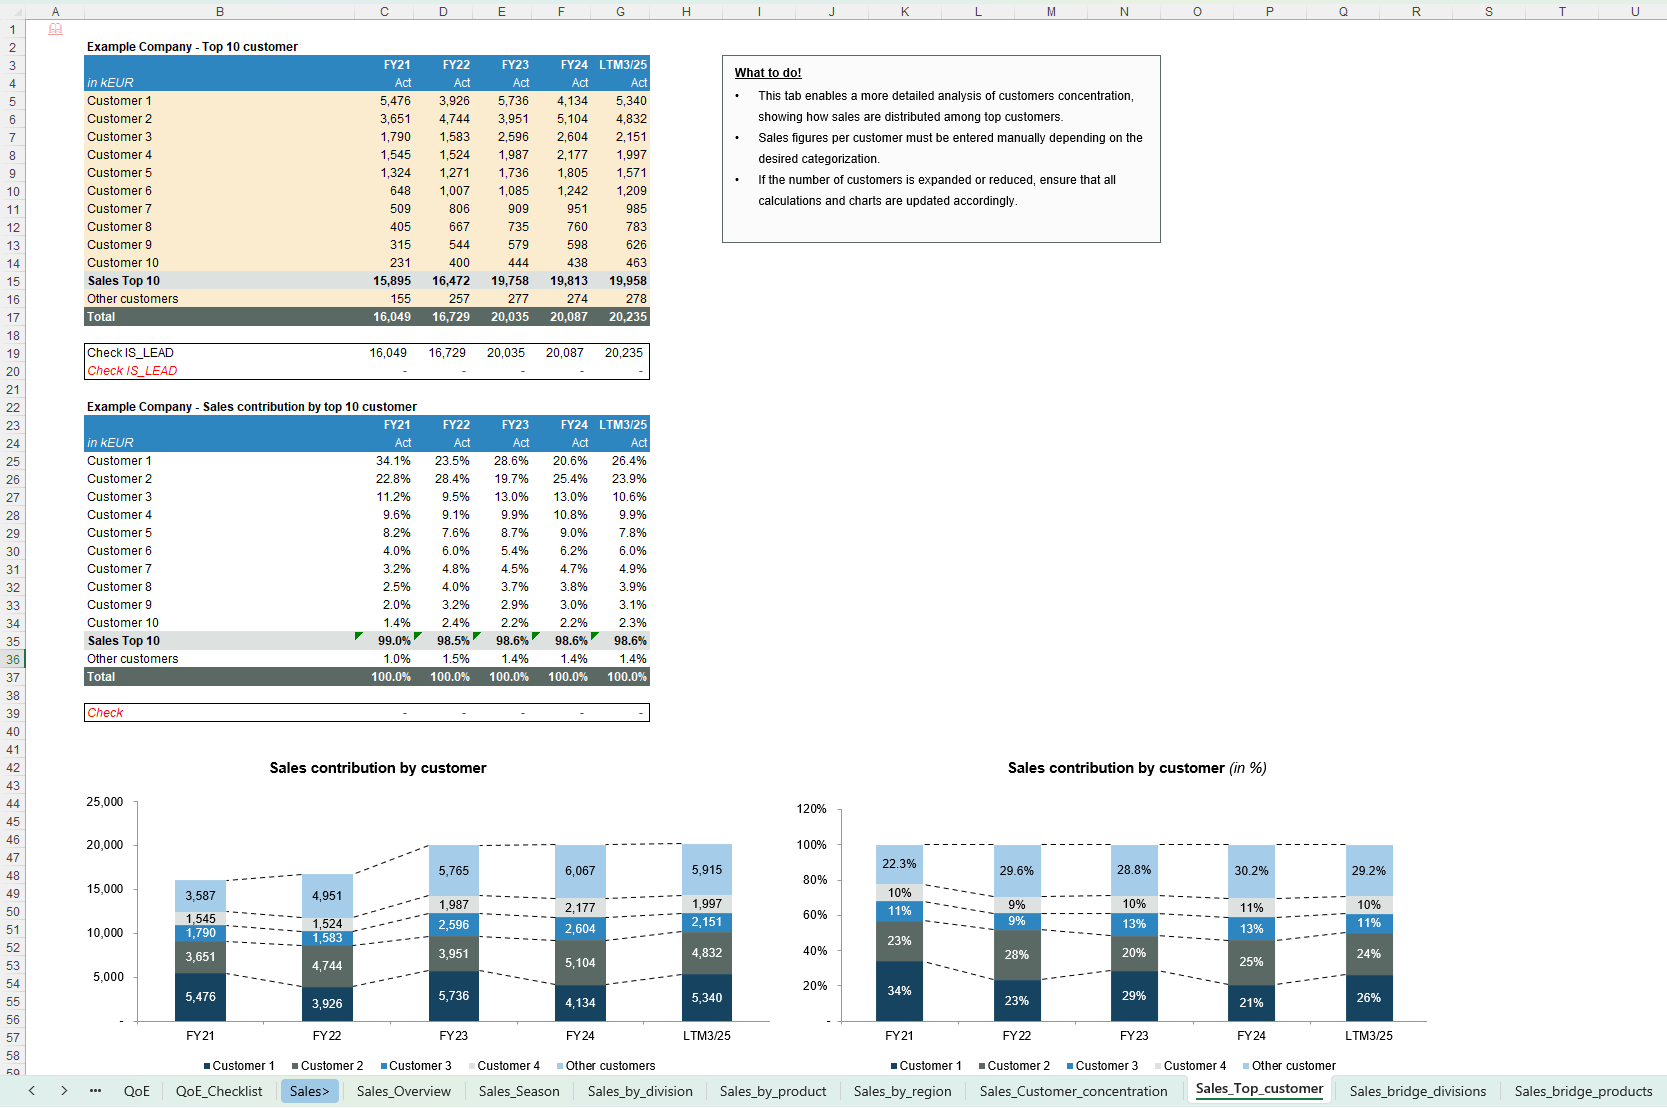
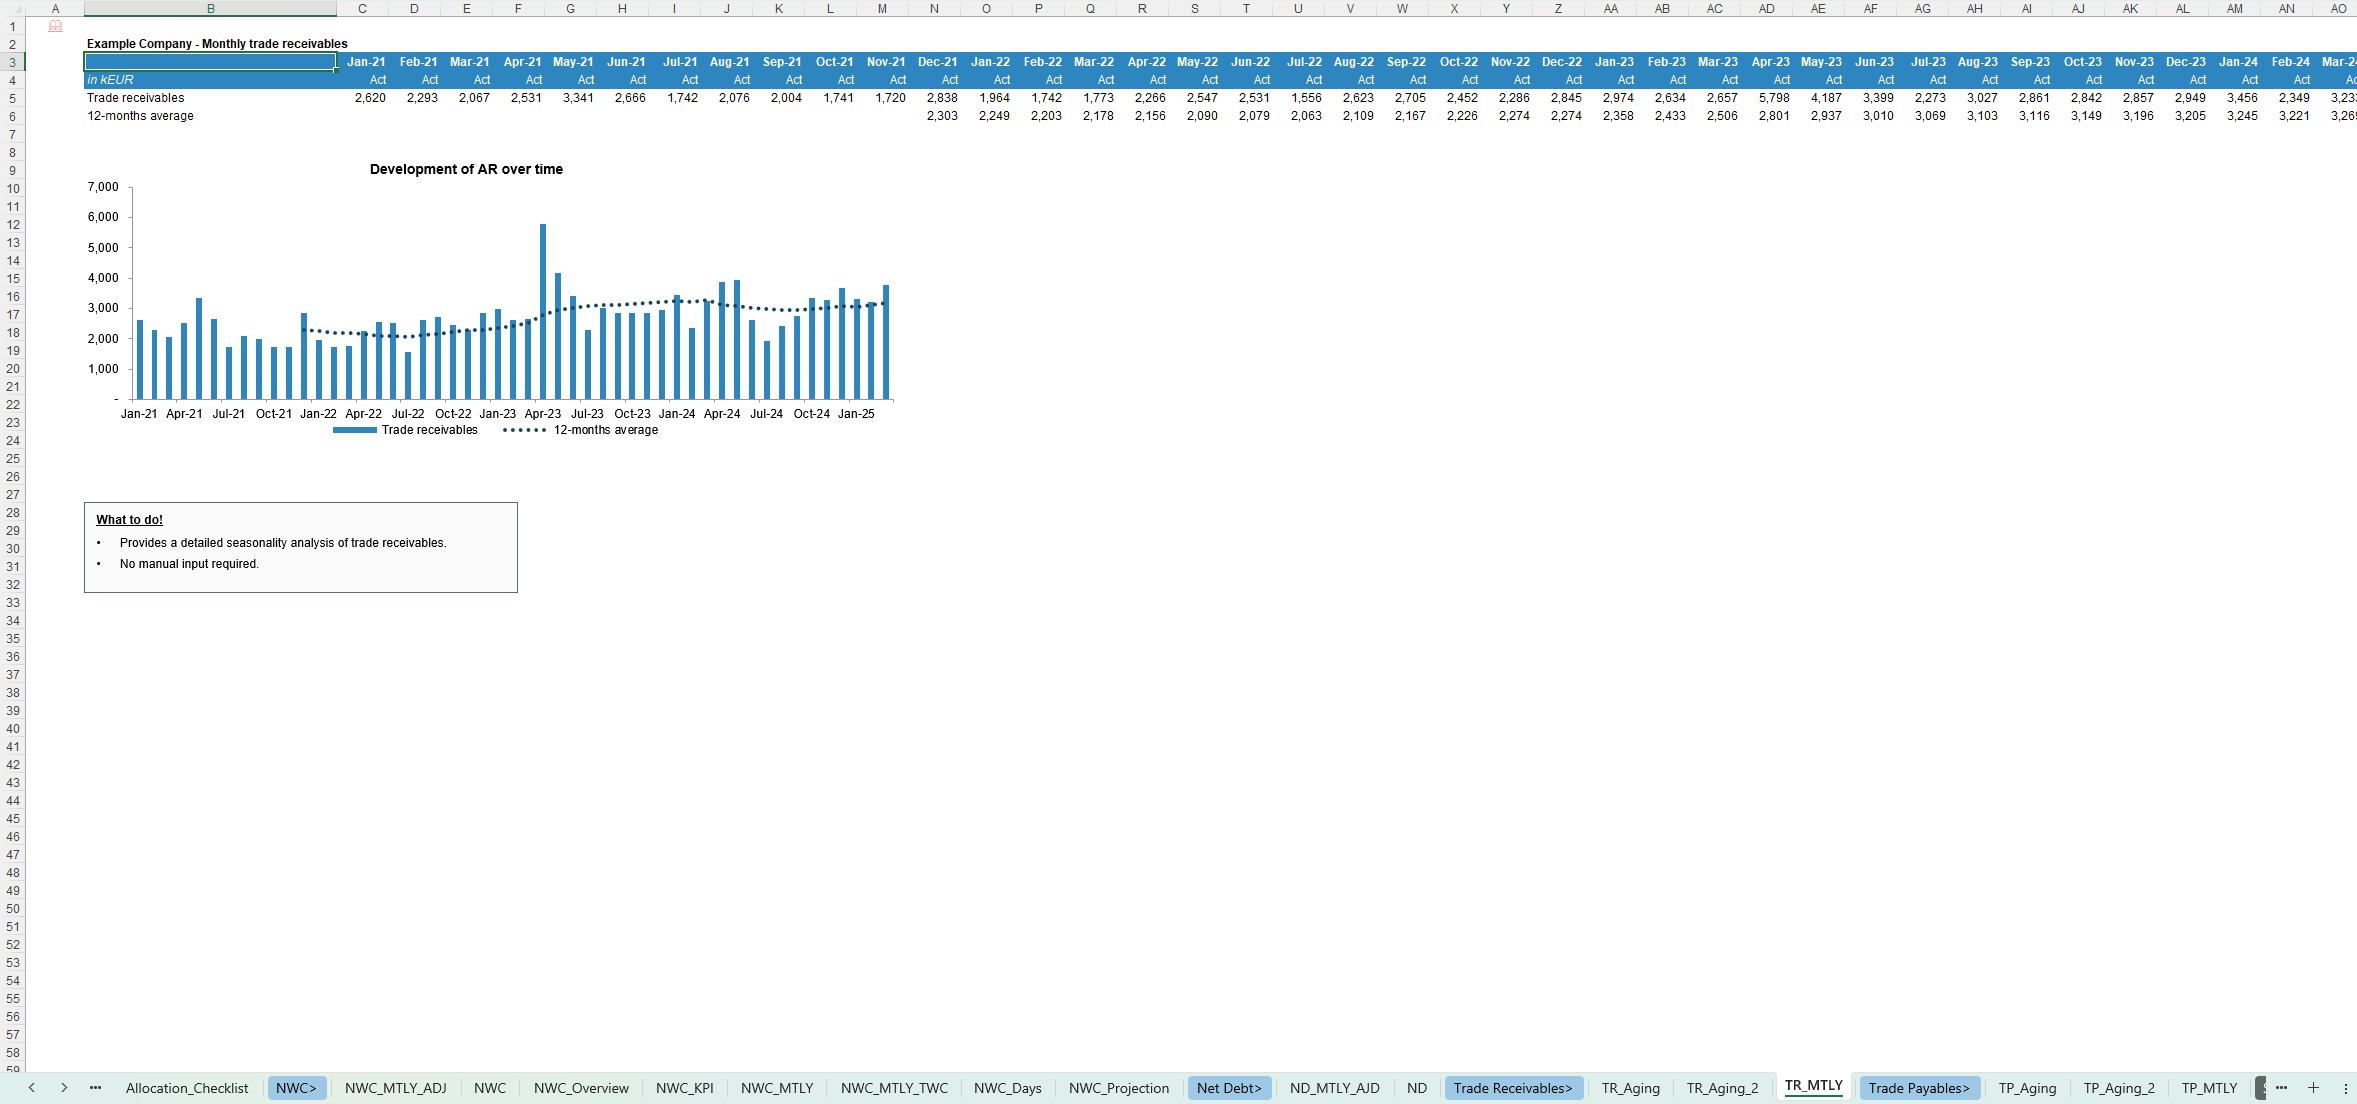
- Sales overview and seasonality
- Sales by division, product, region and customer
- Profitability by segment, including EBITDA, EBIT, net profit and margin analysis
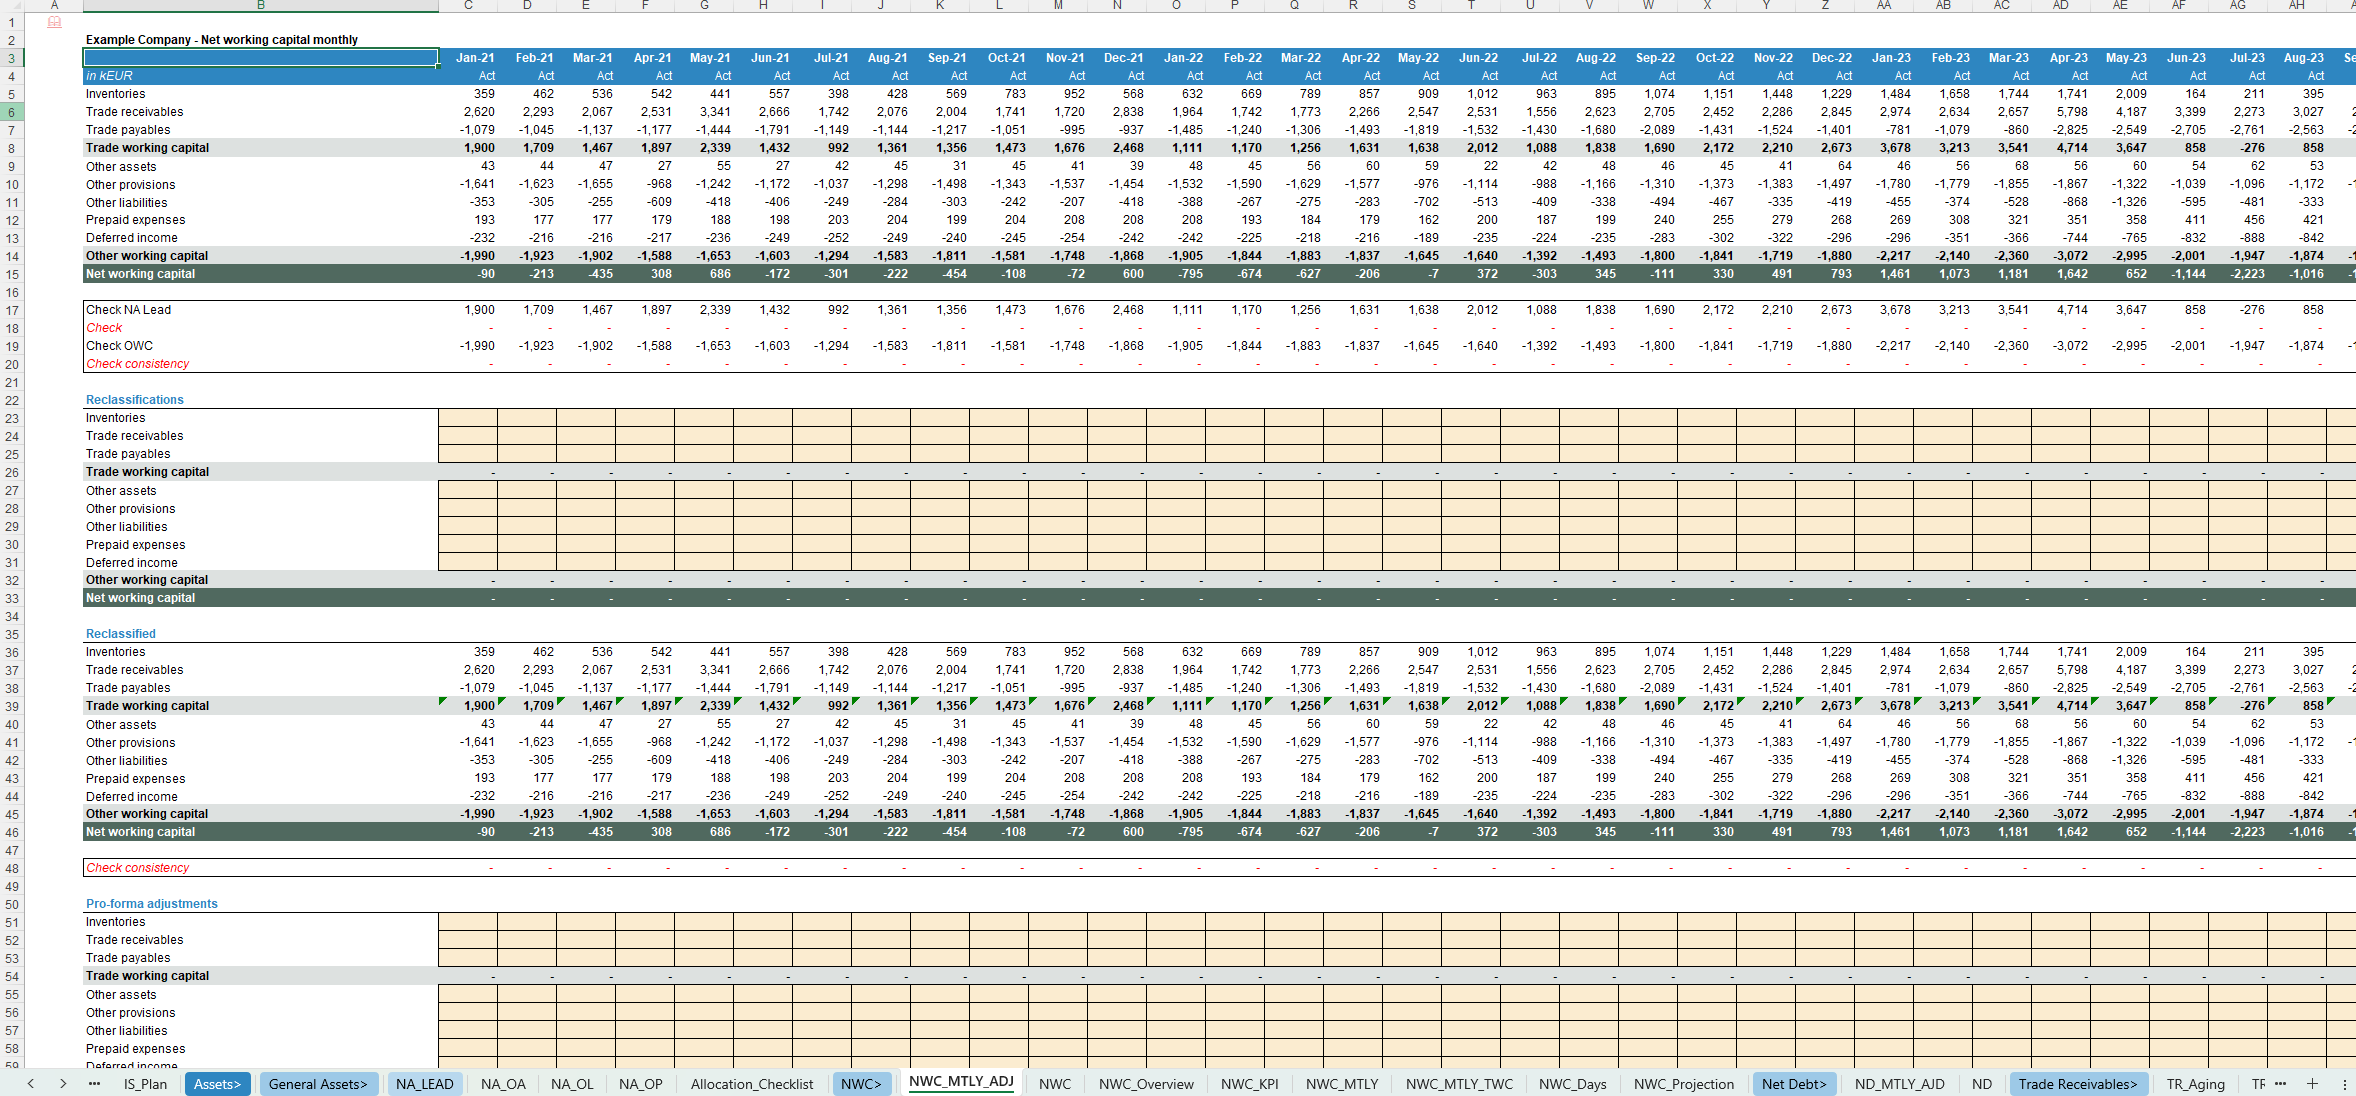
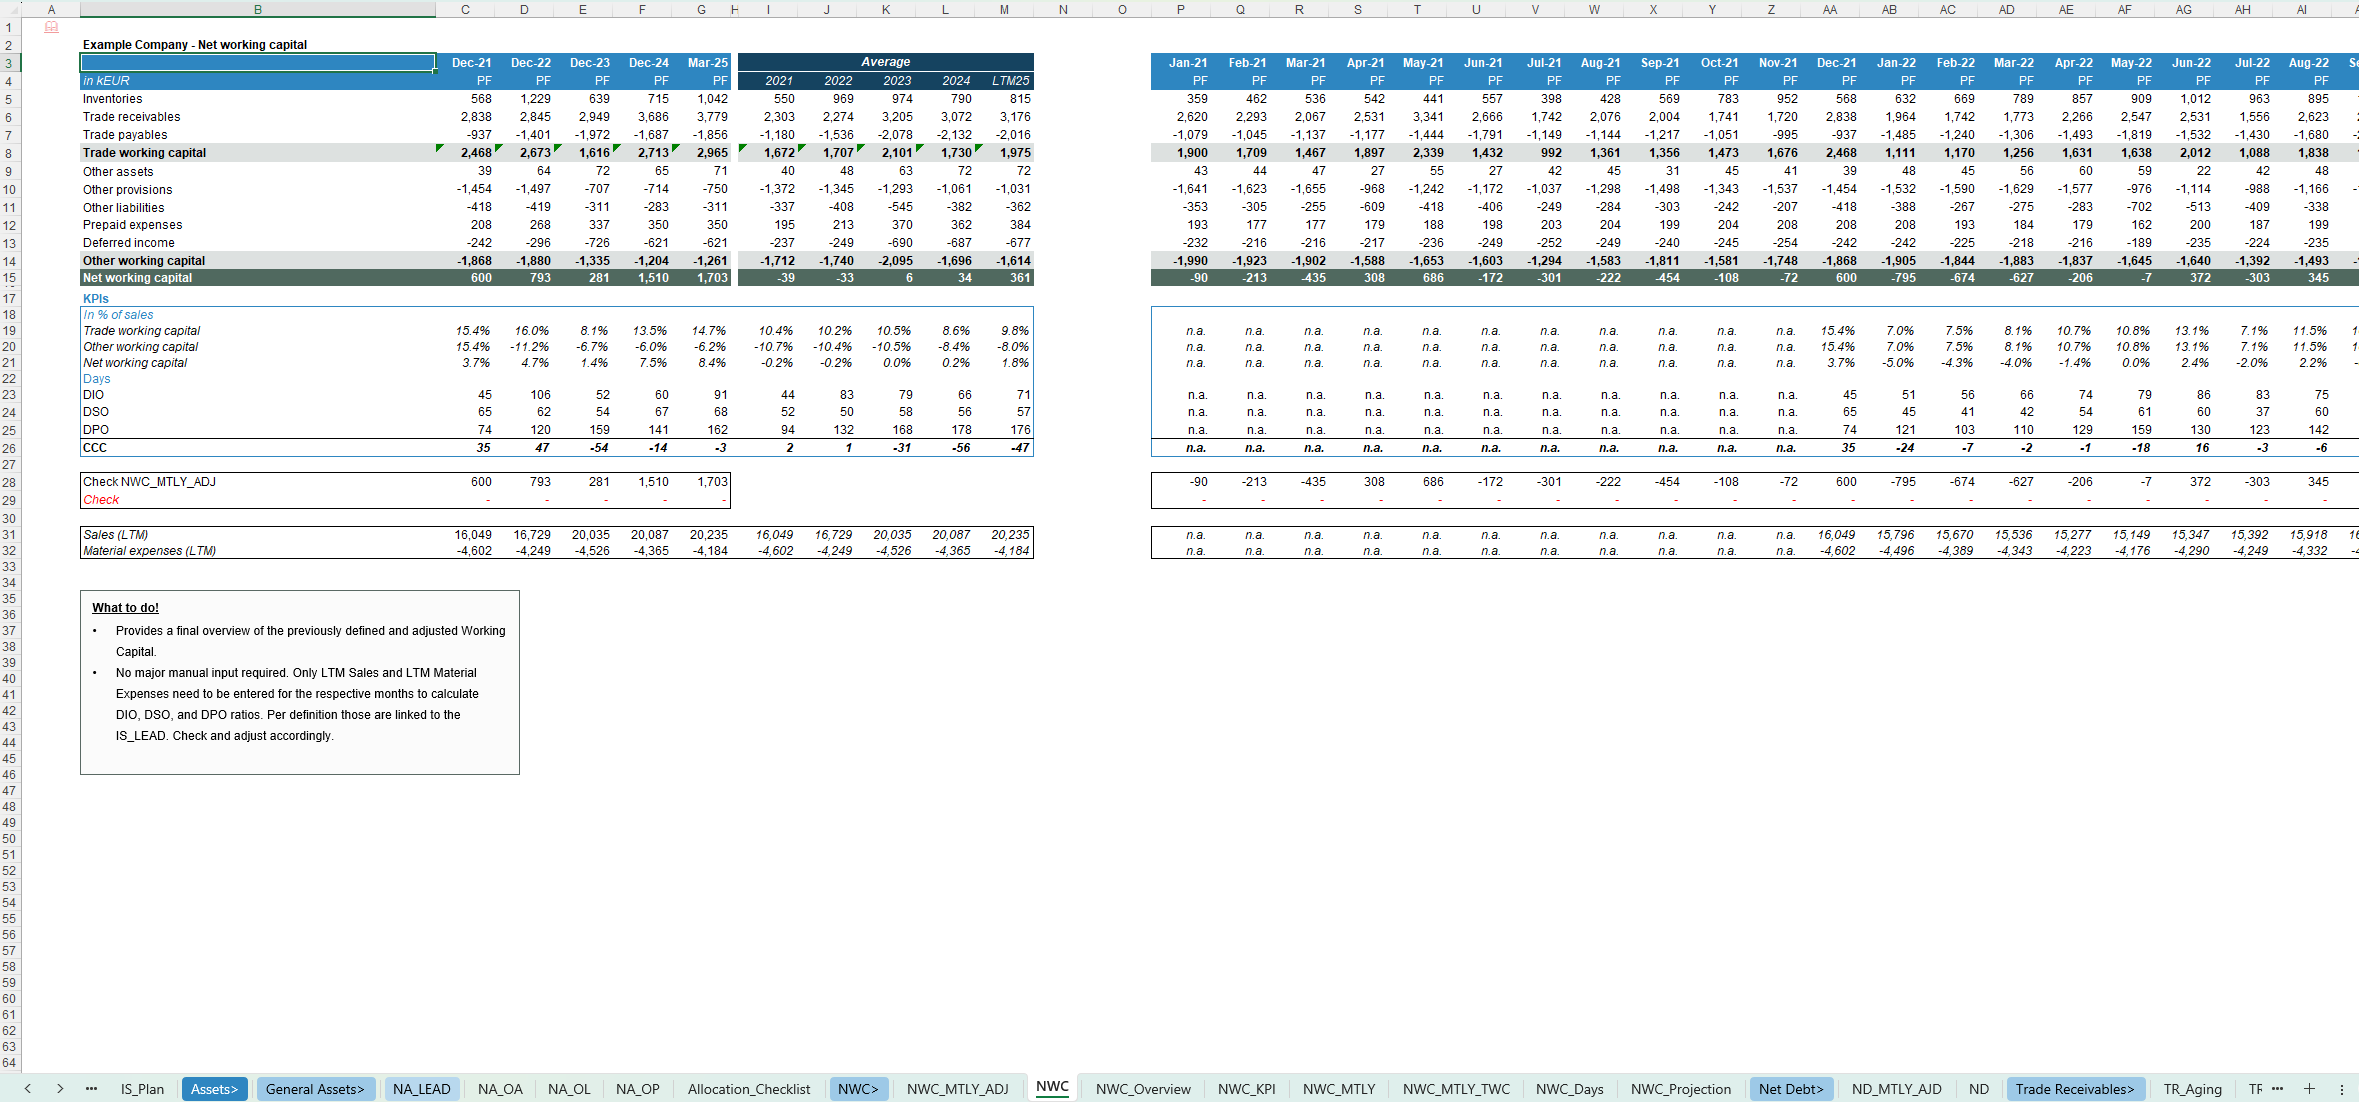
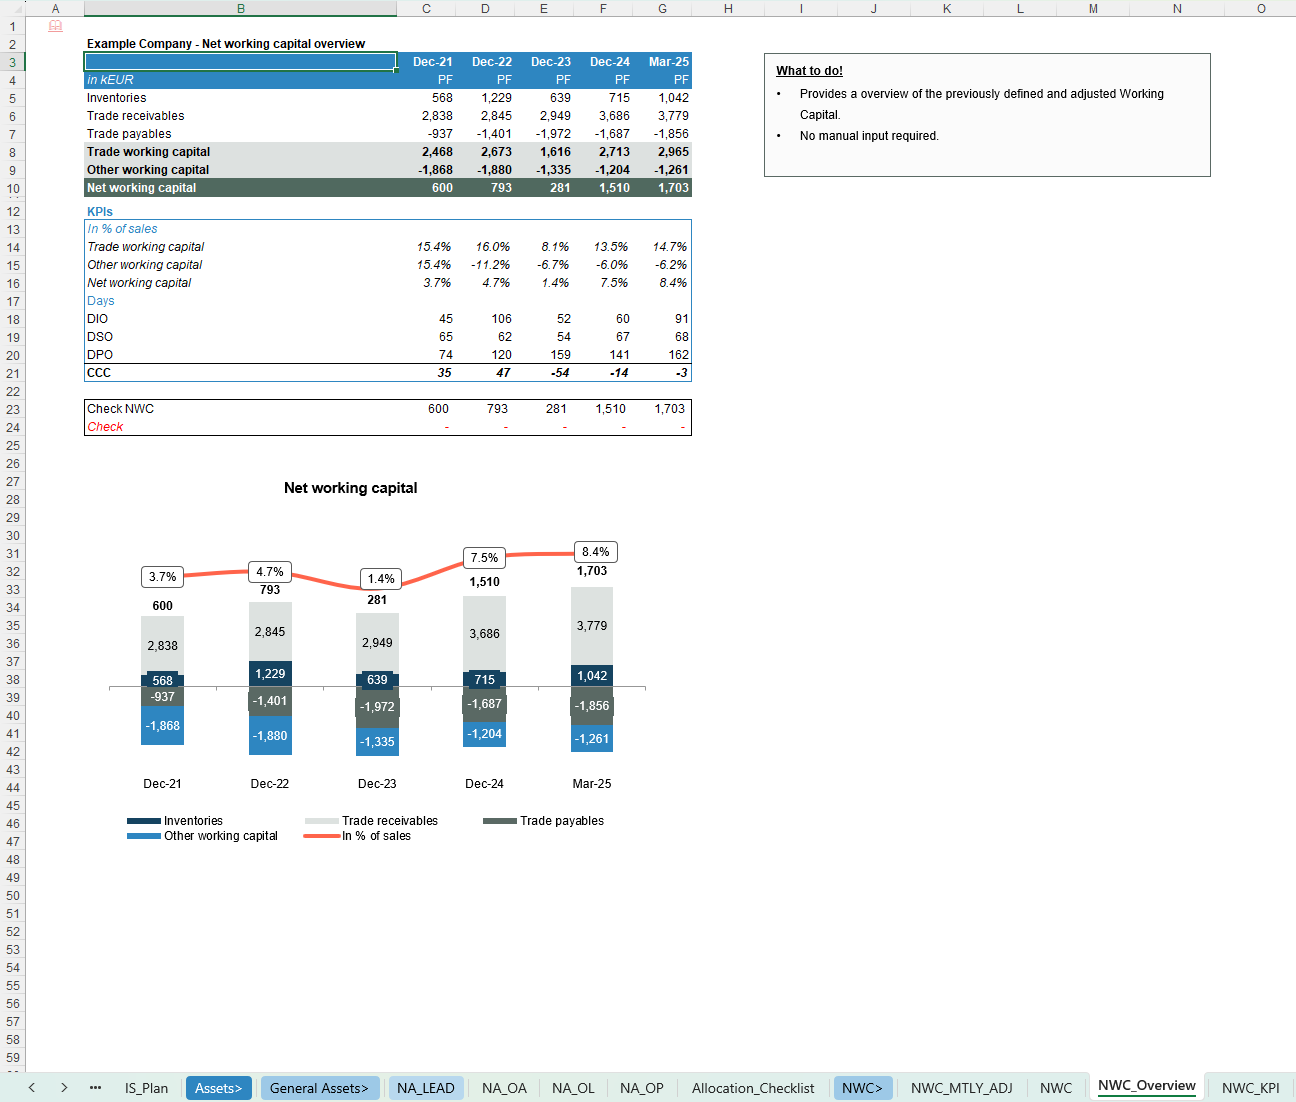
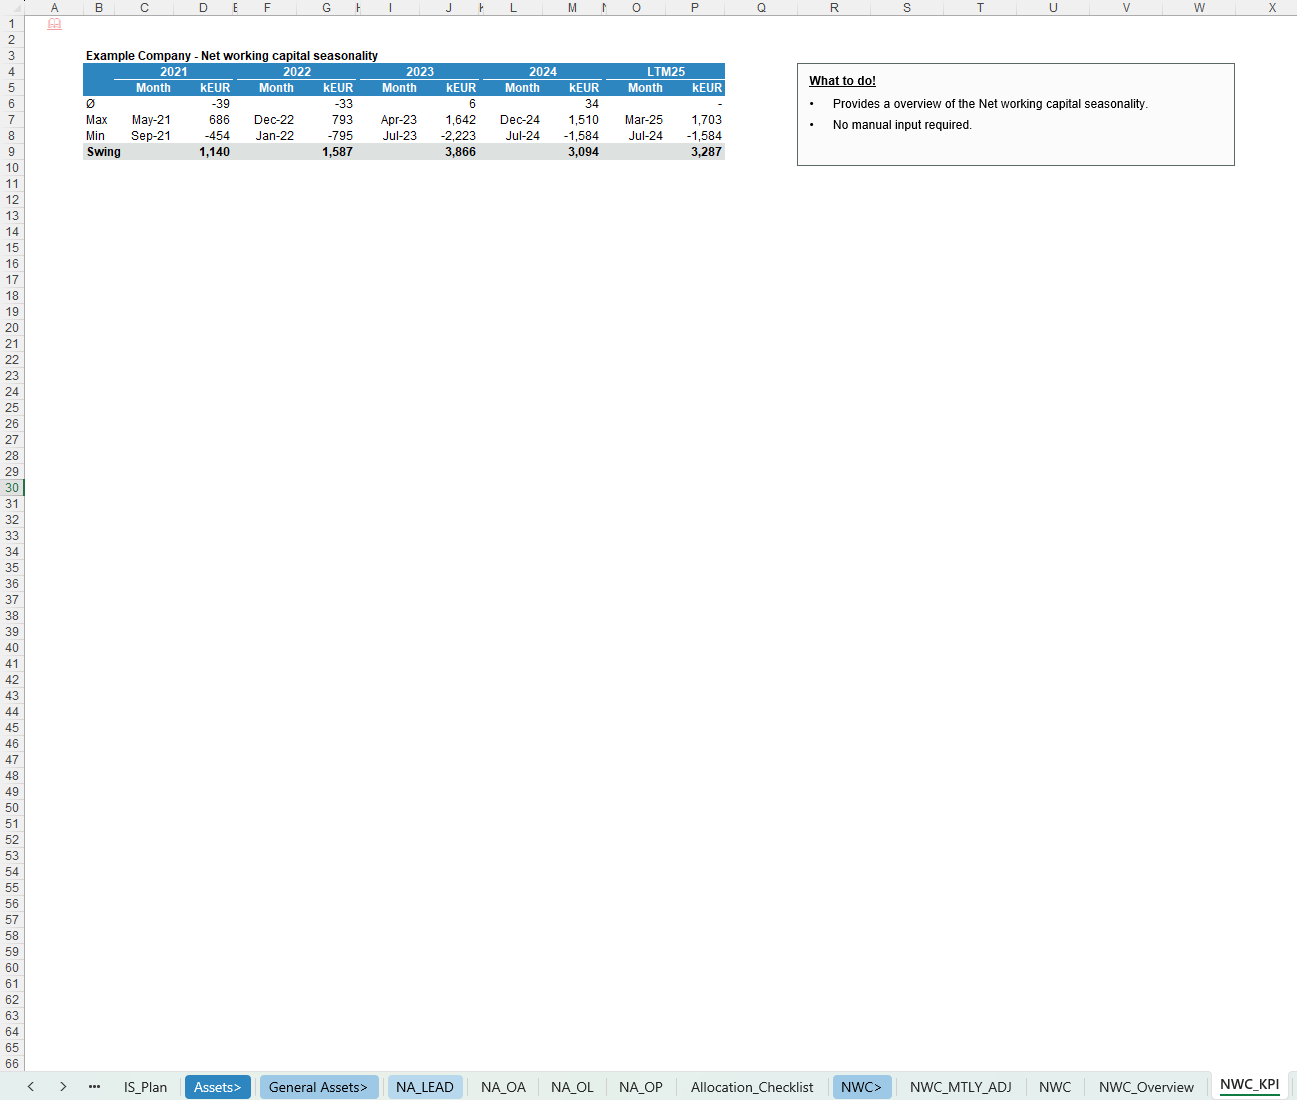
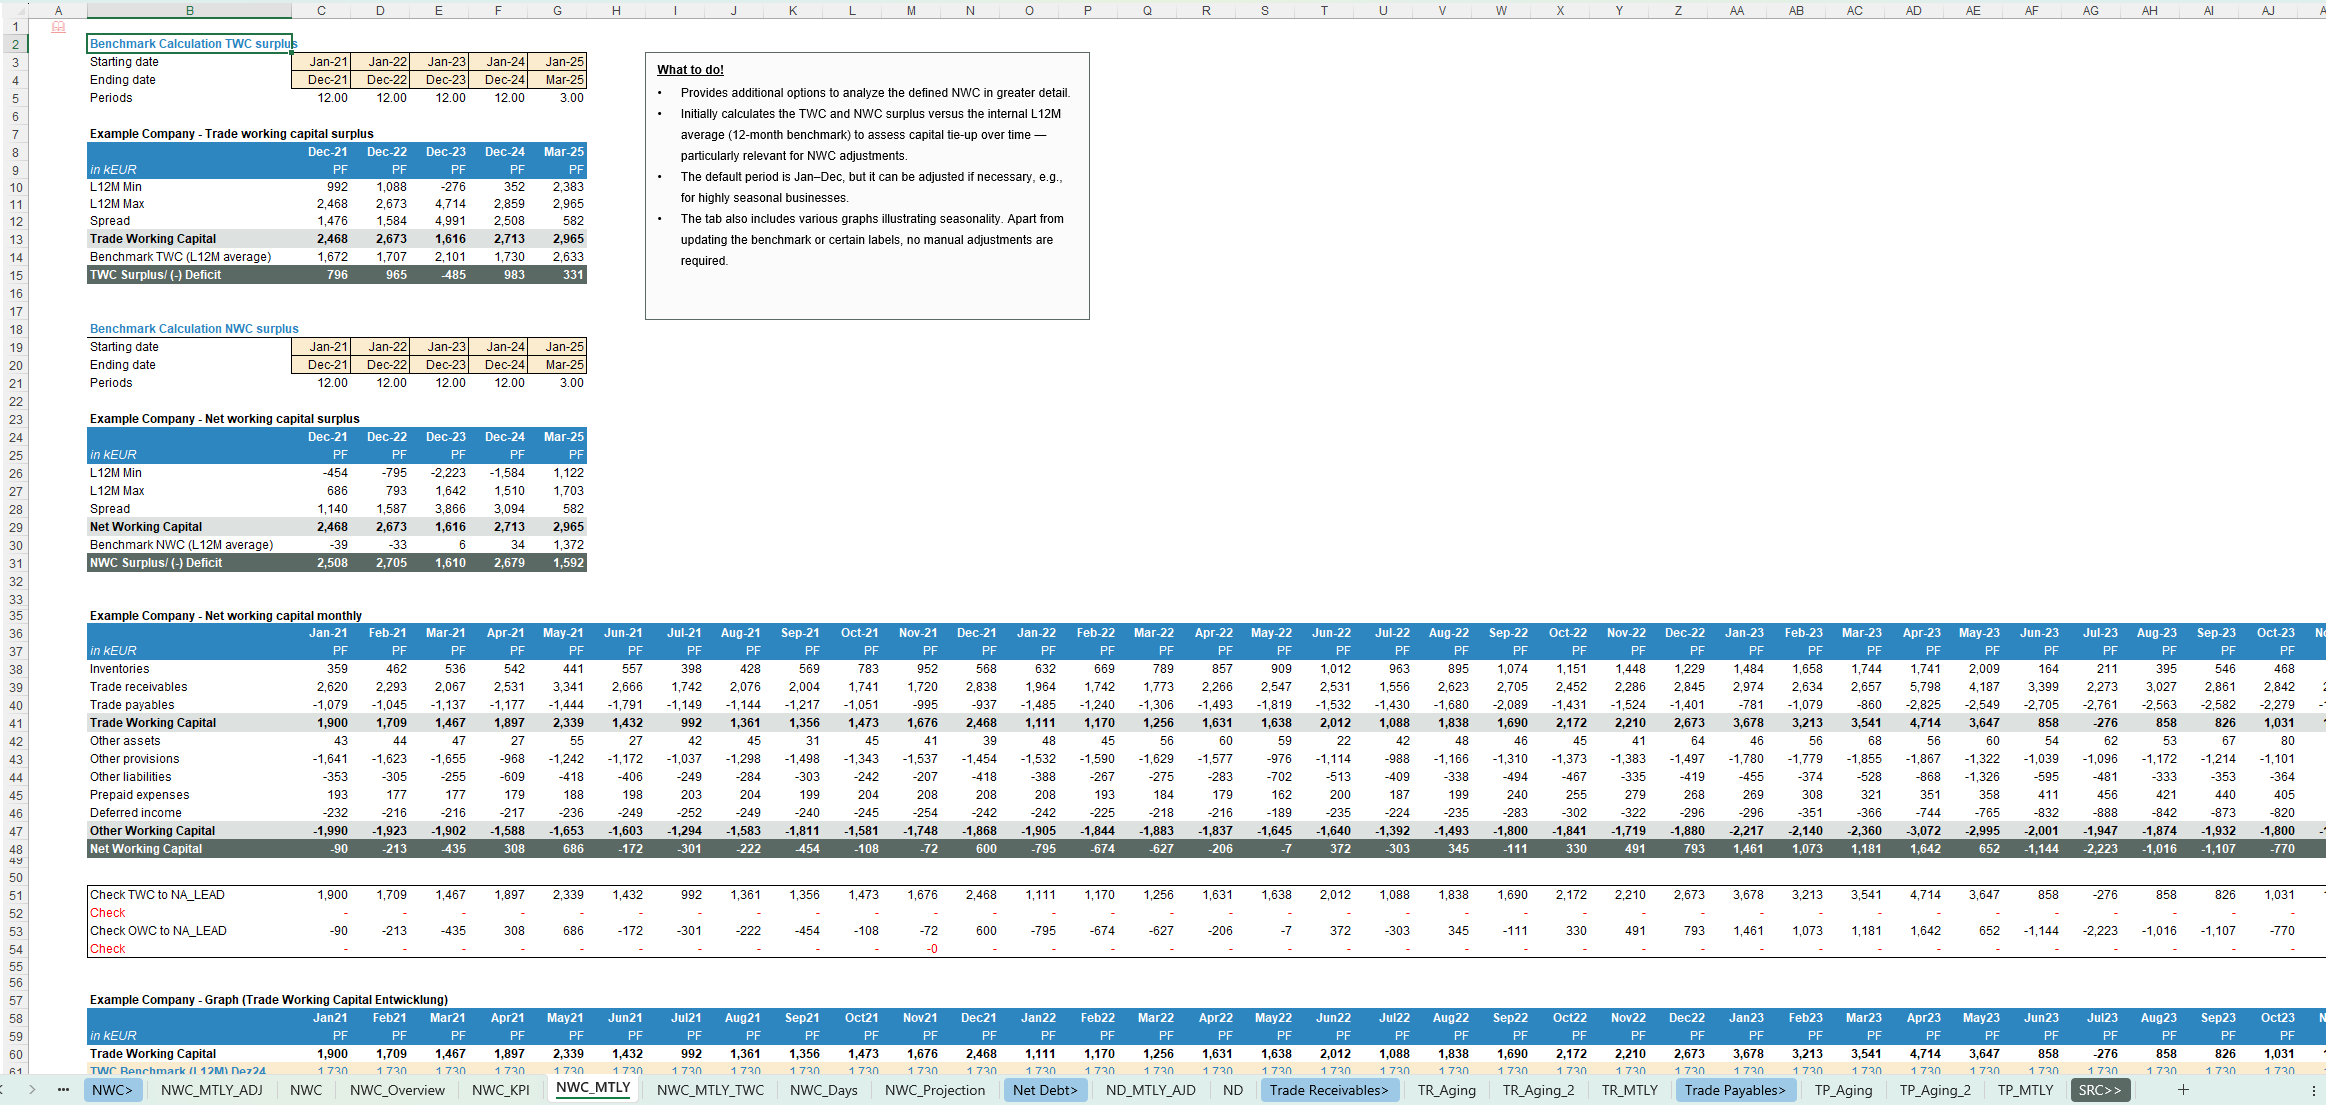
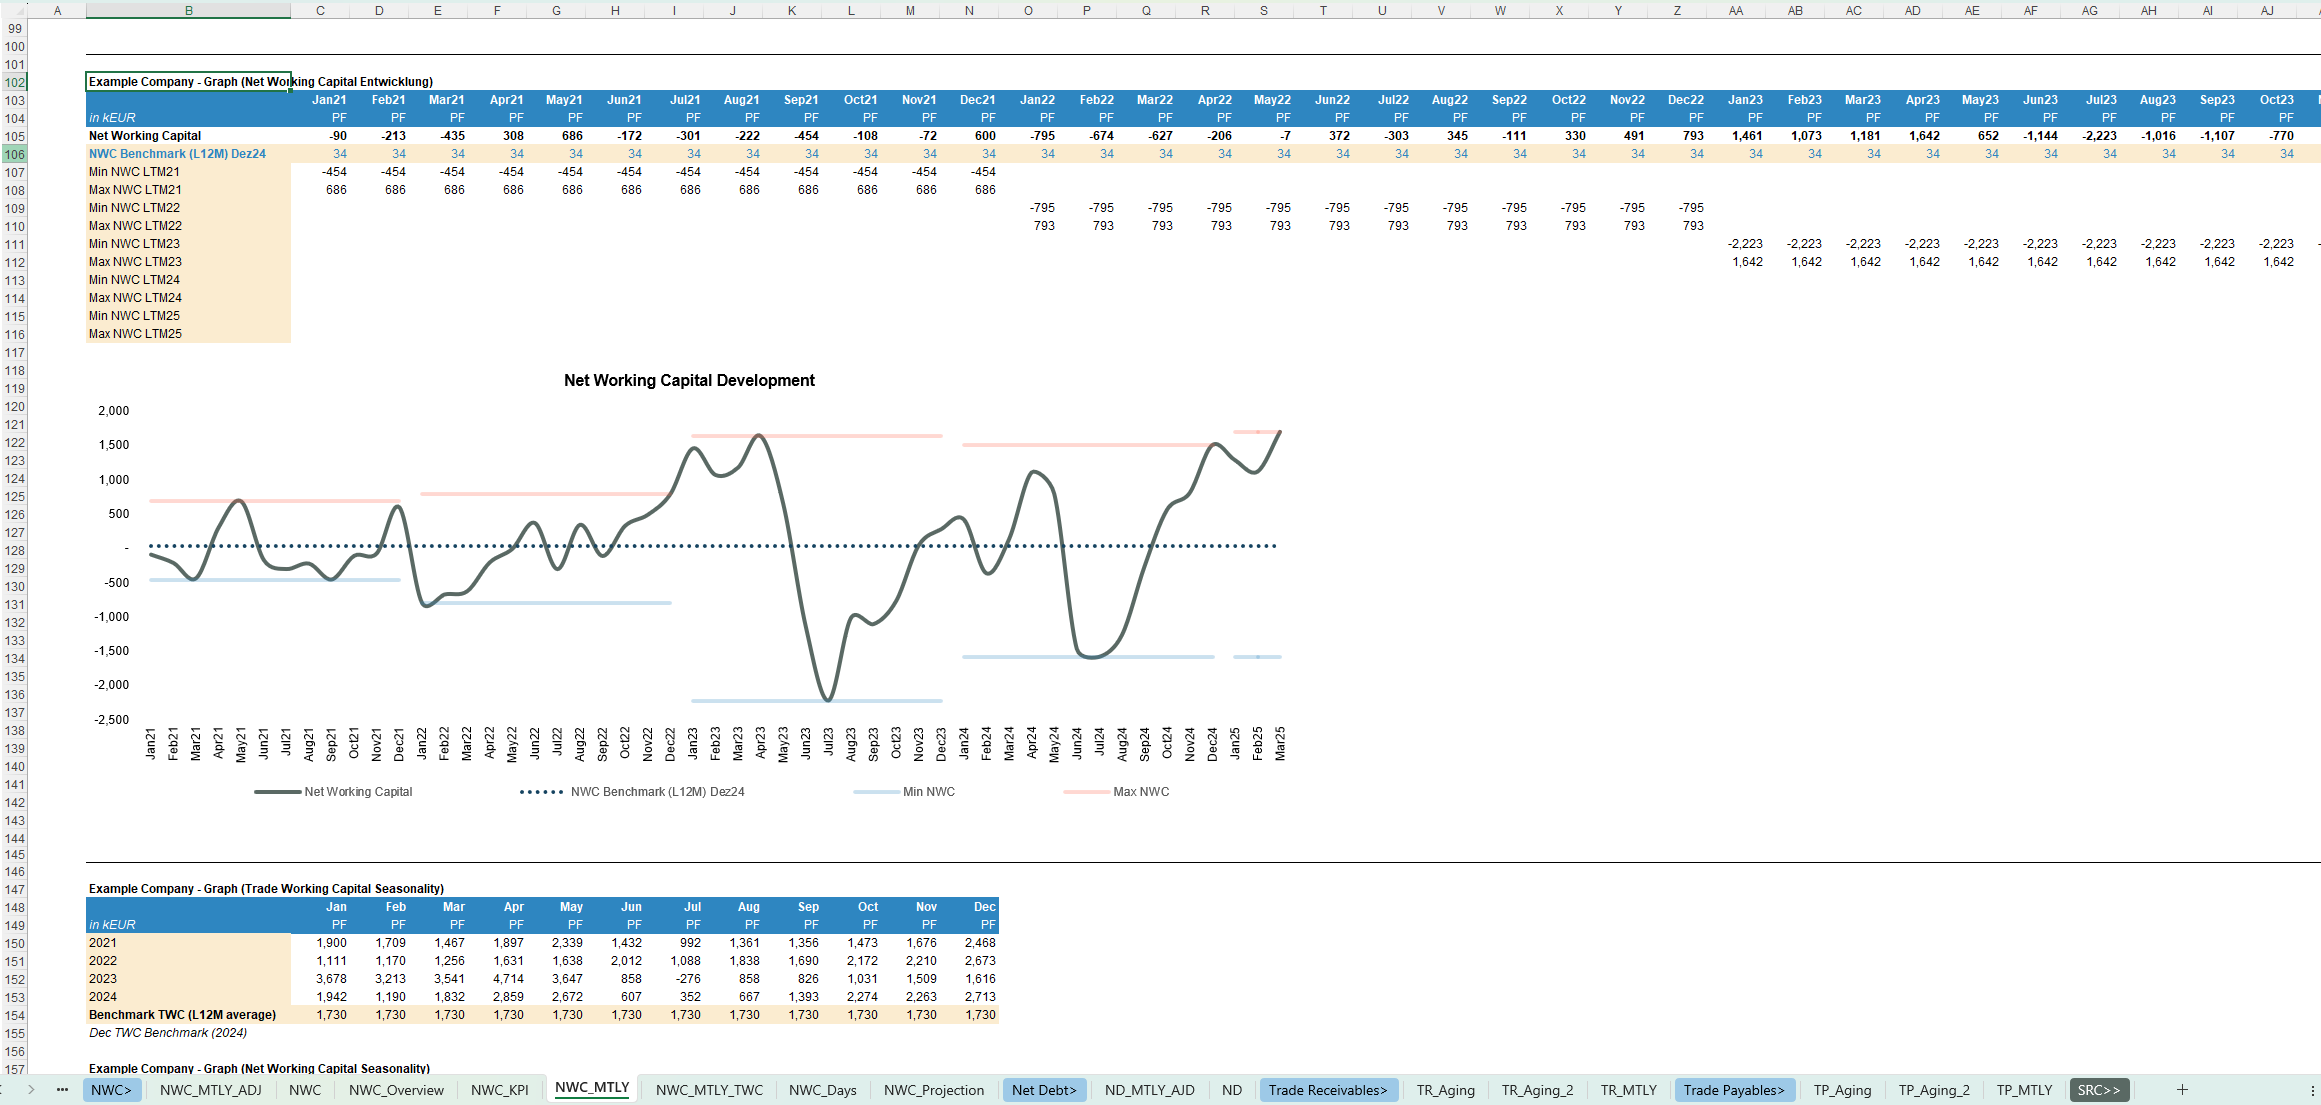
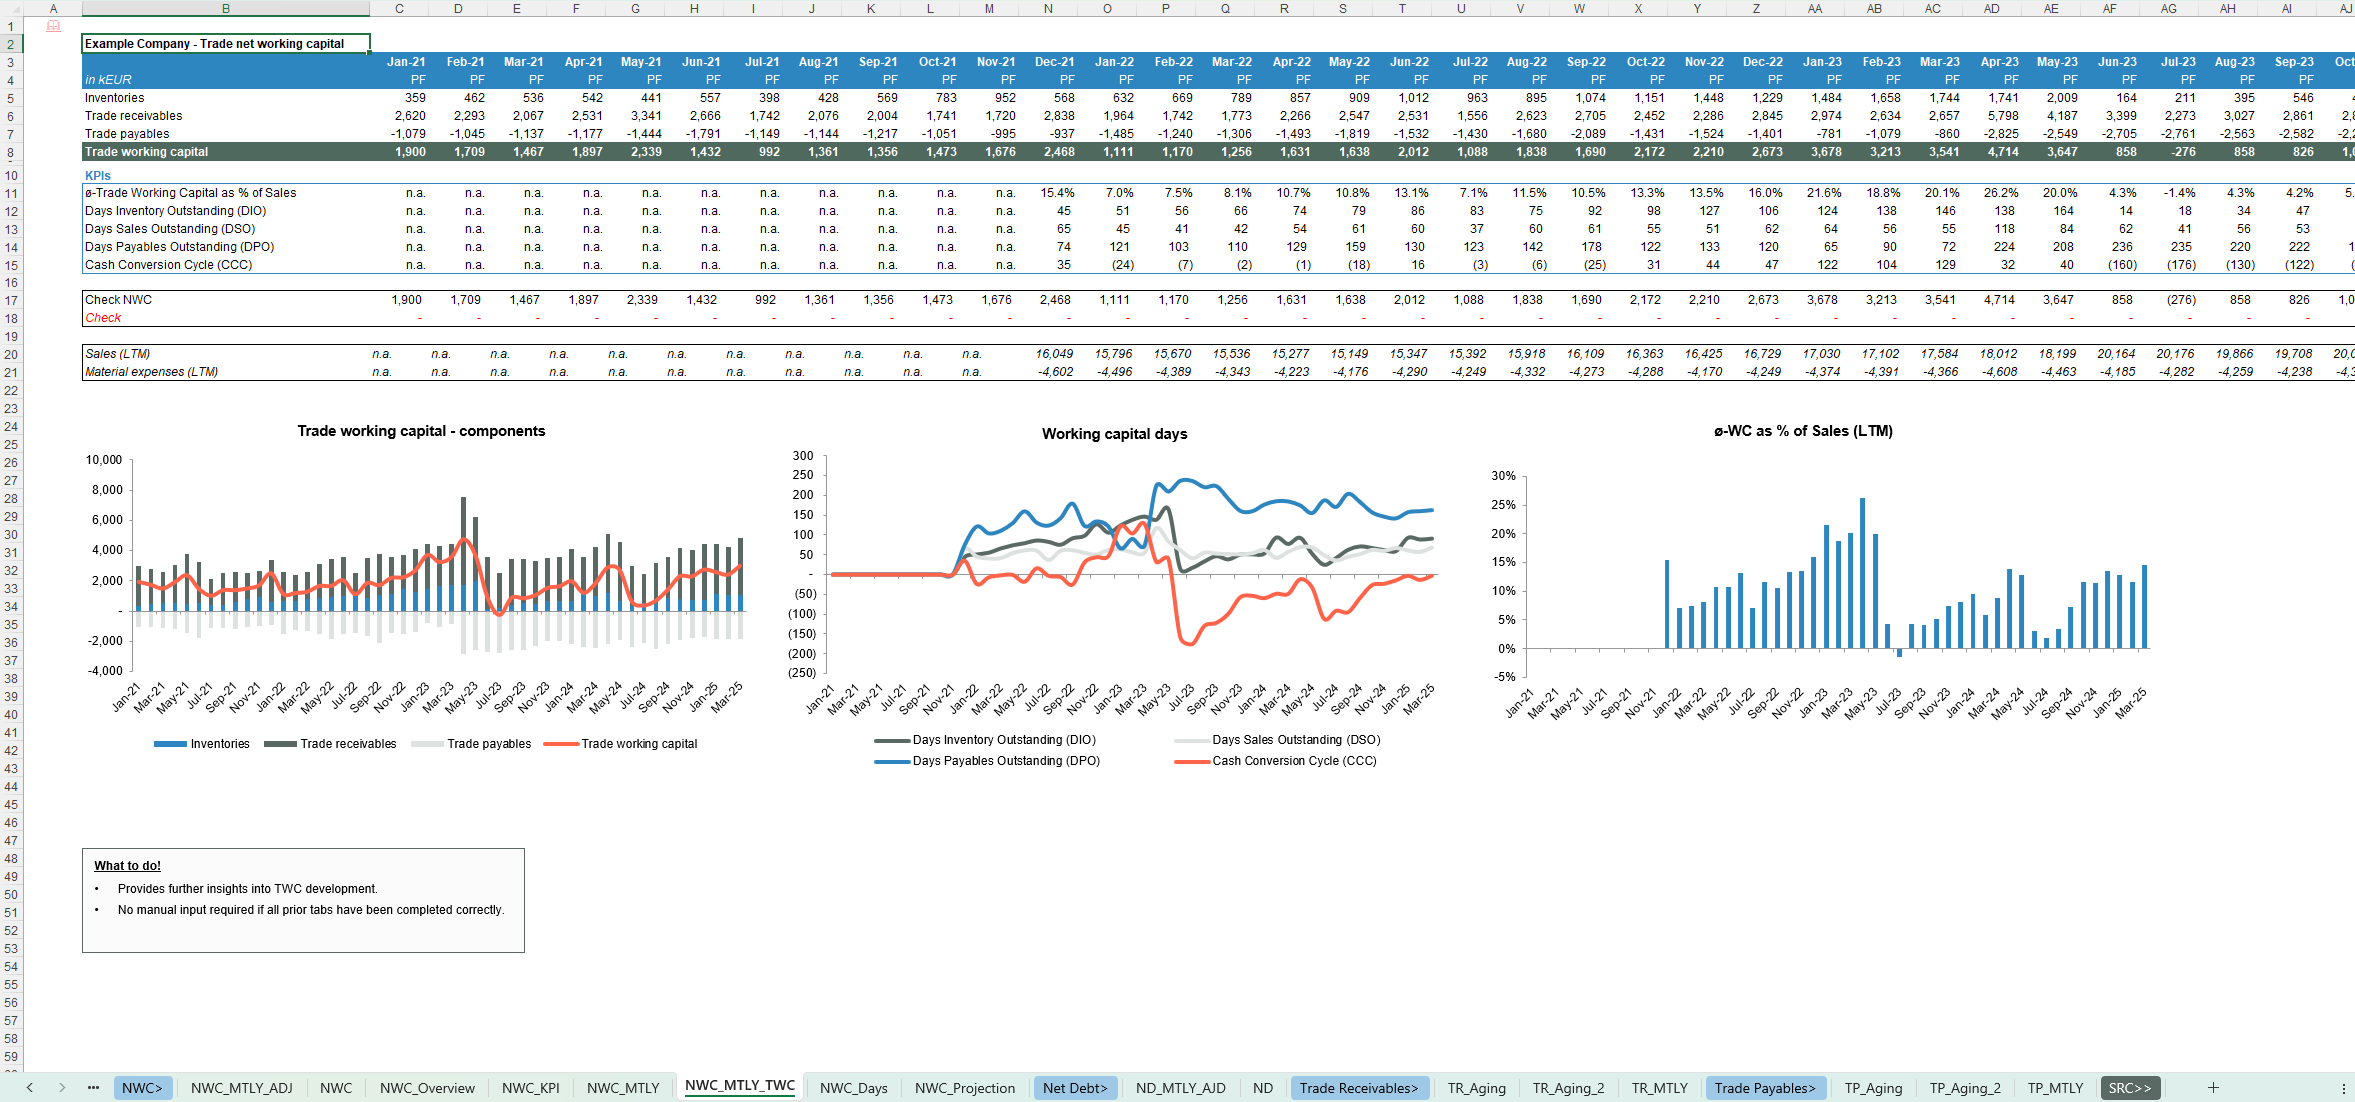
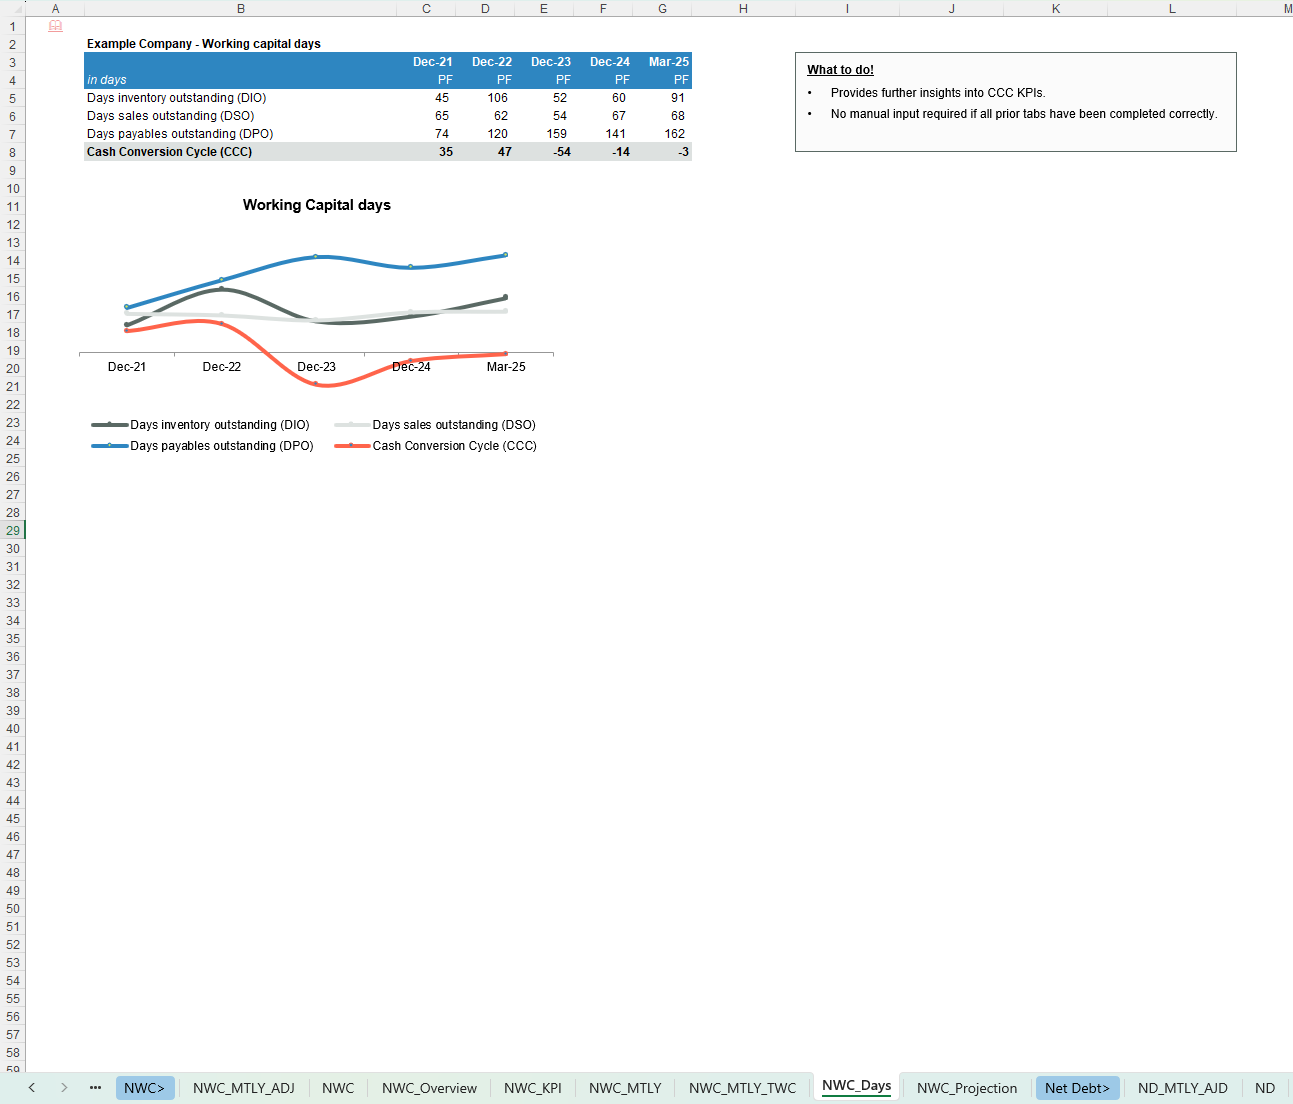
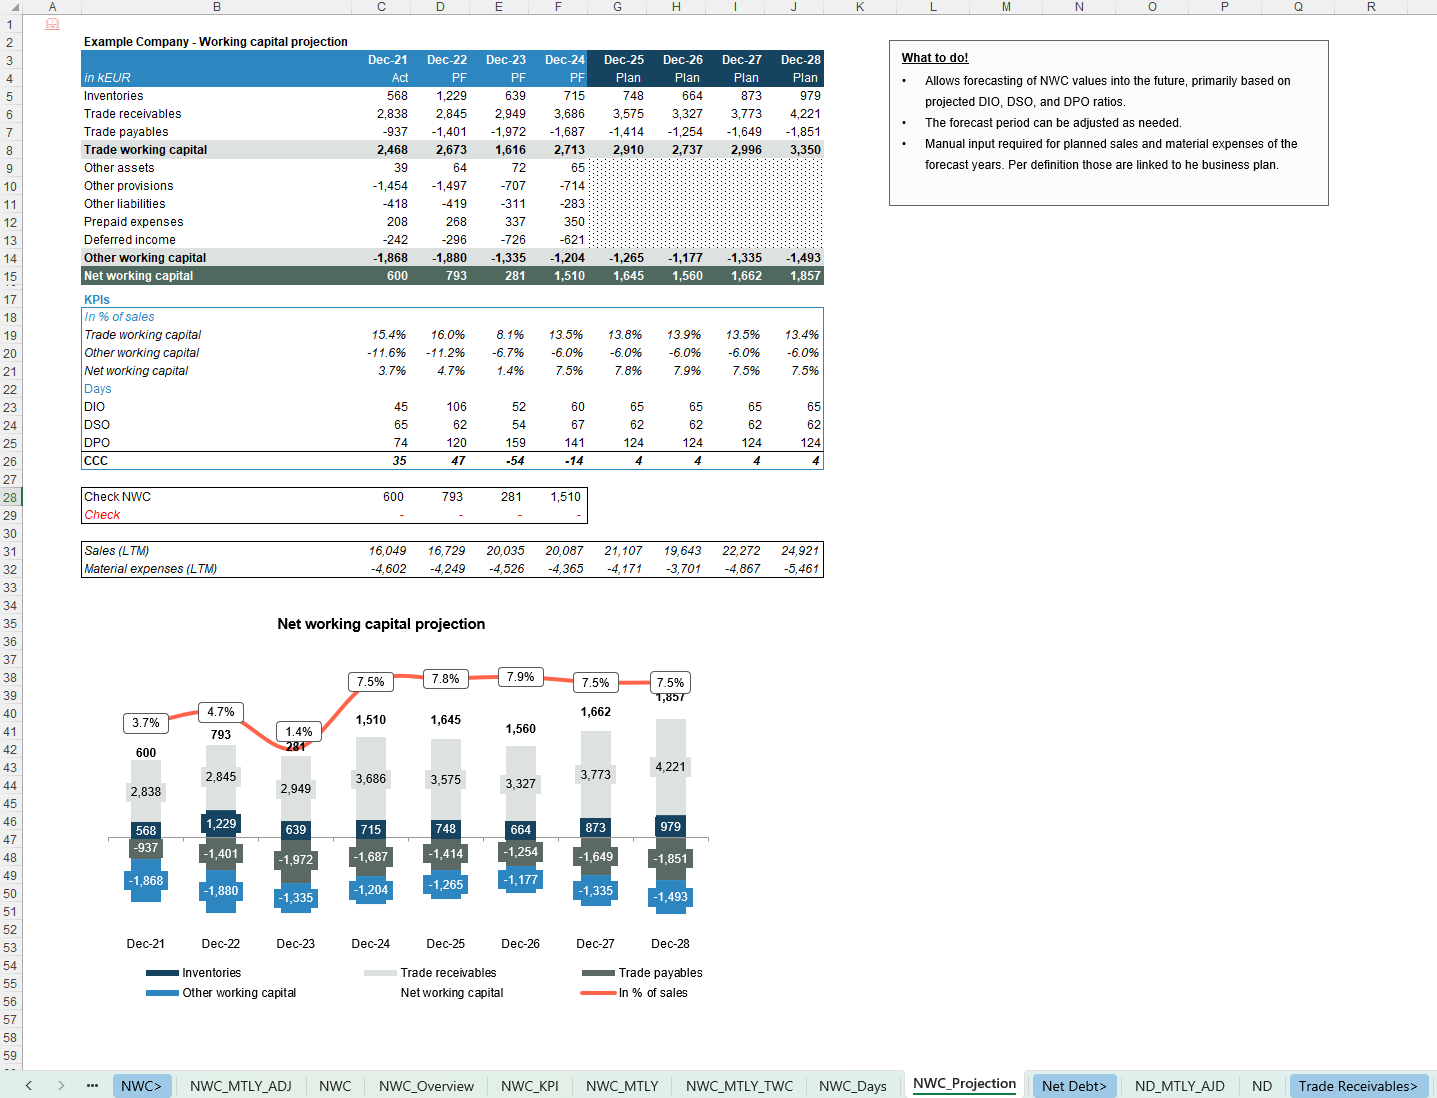
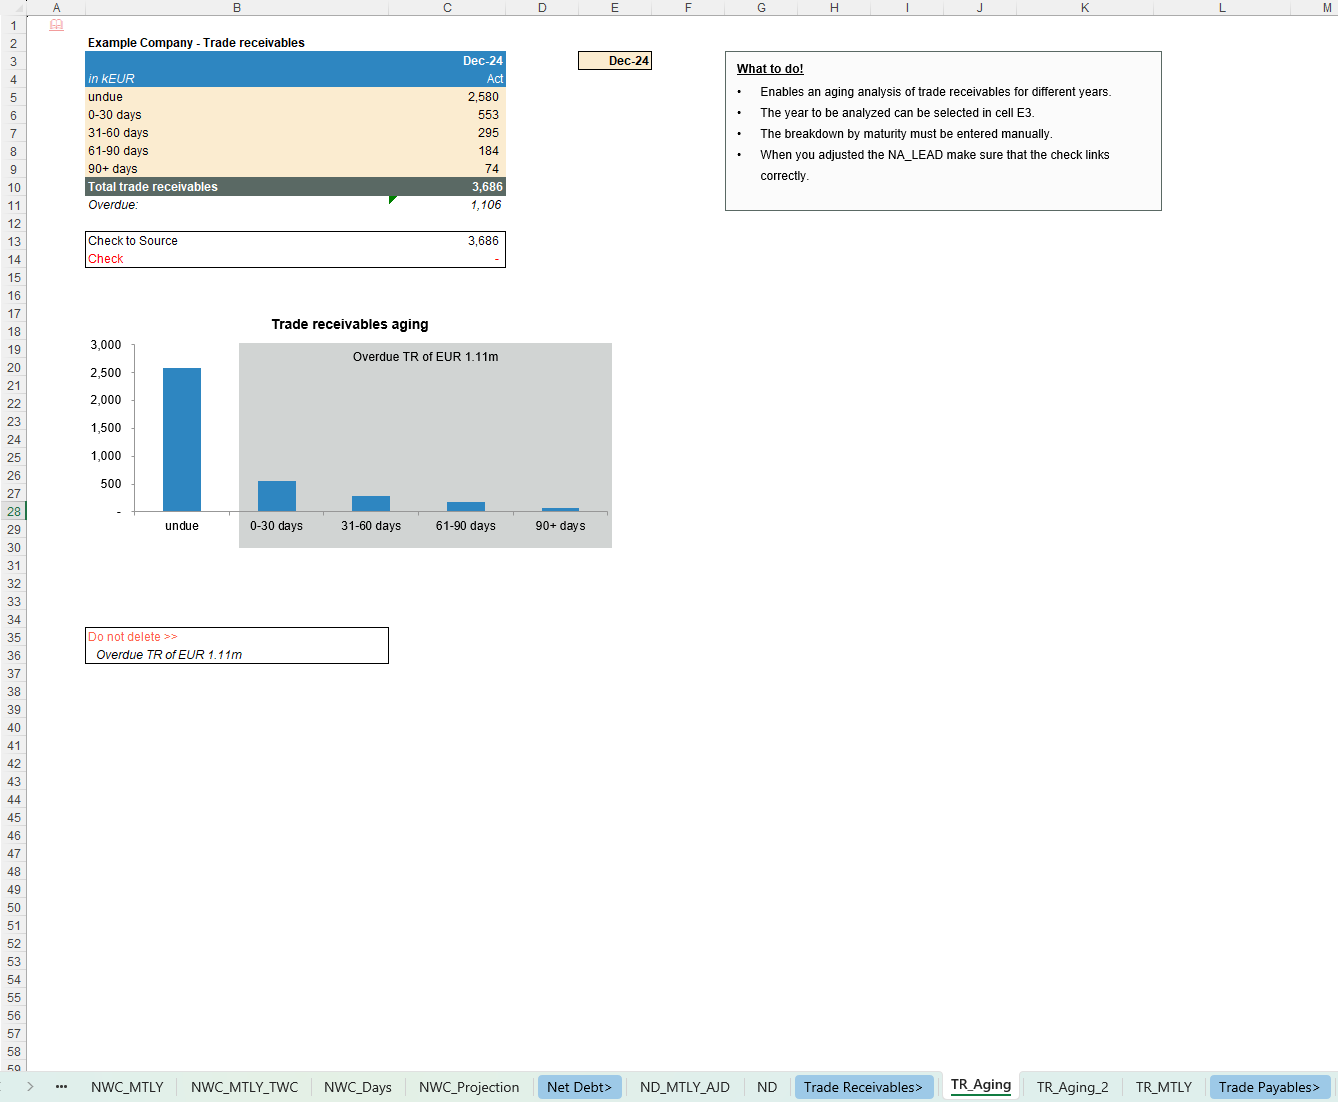
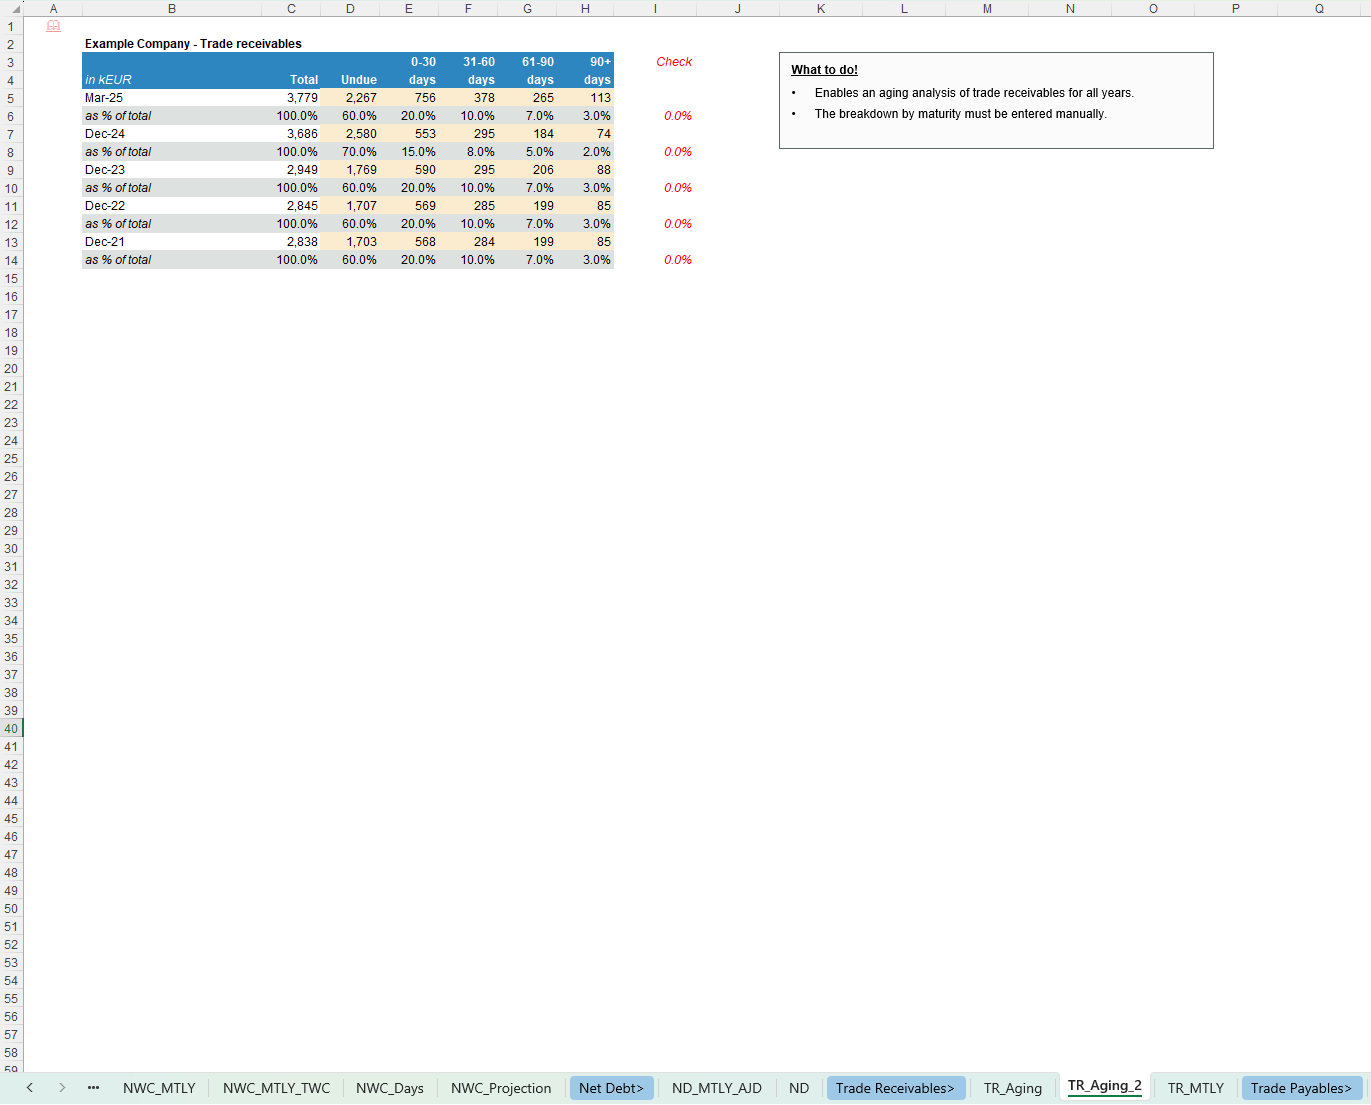
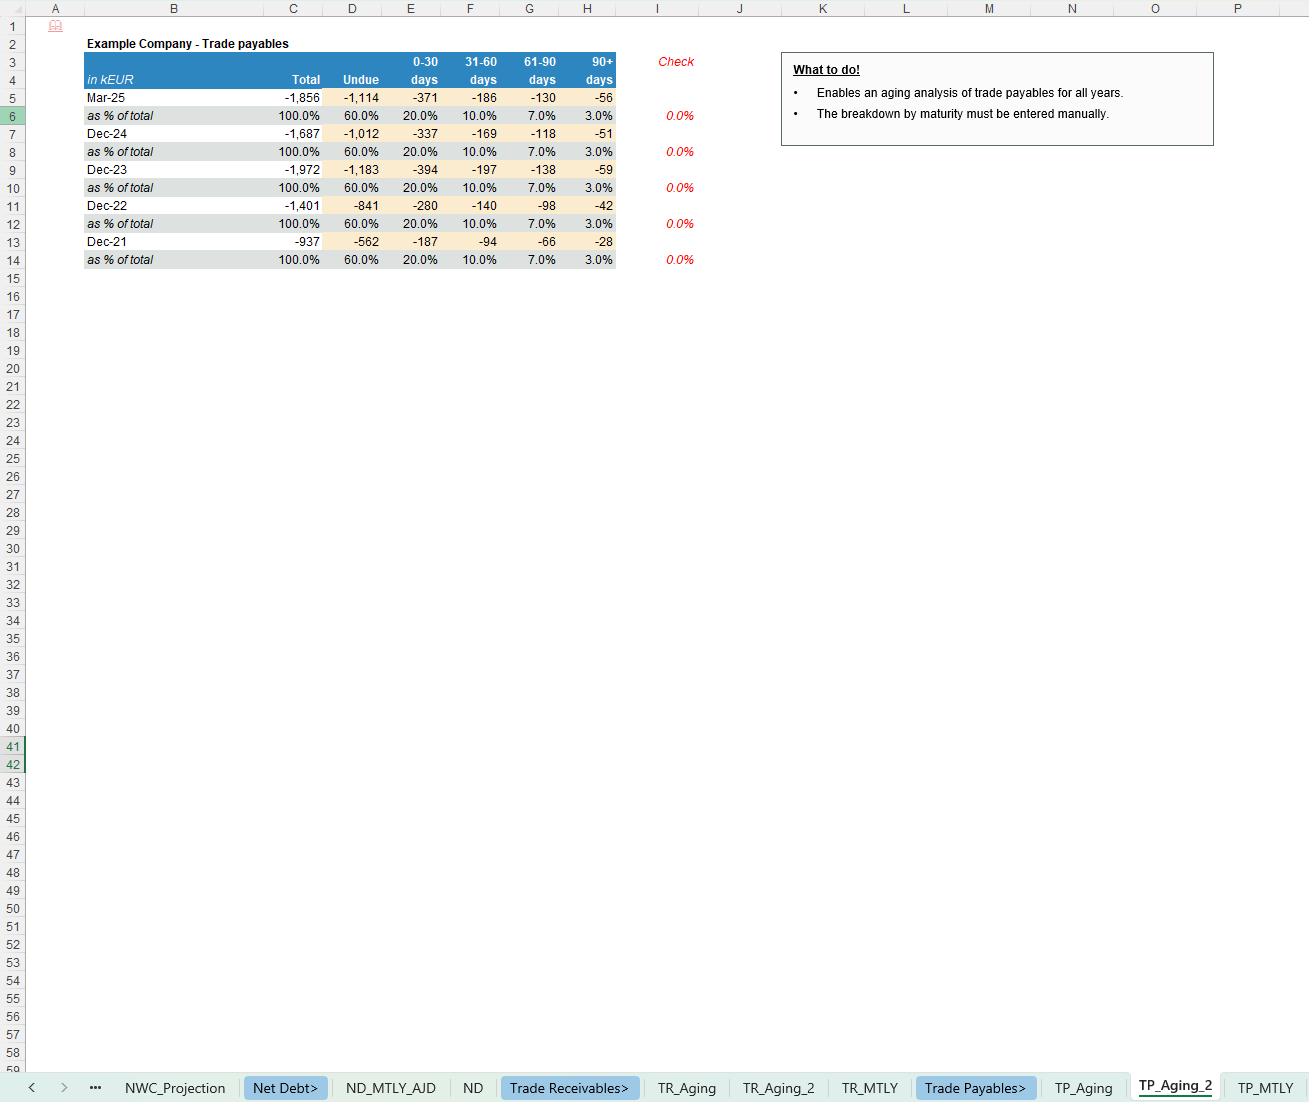
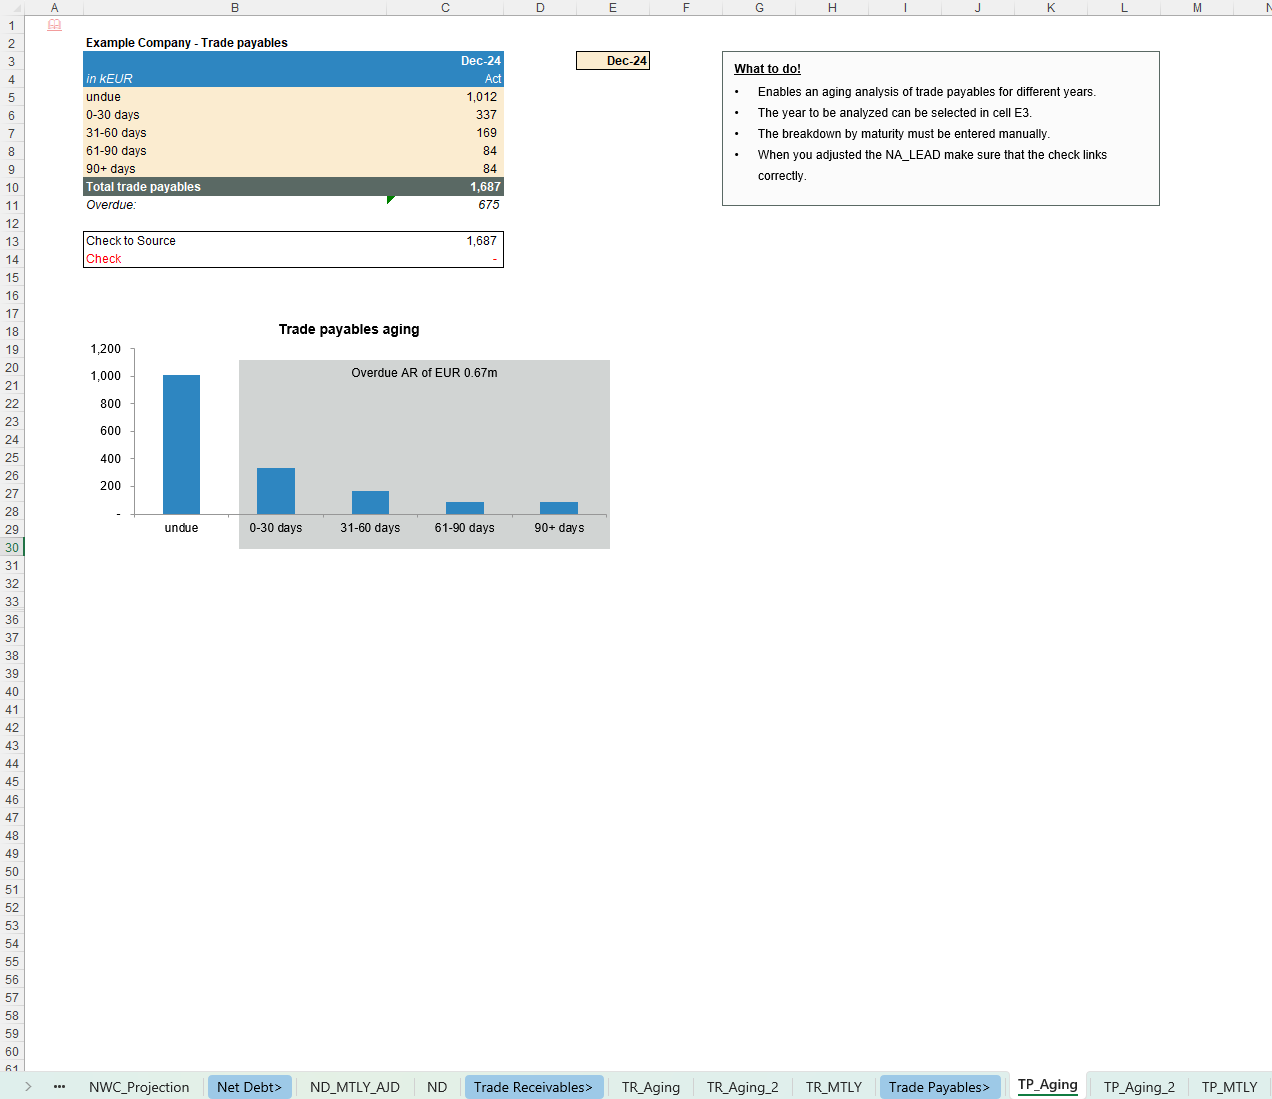
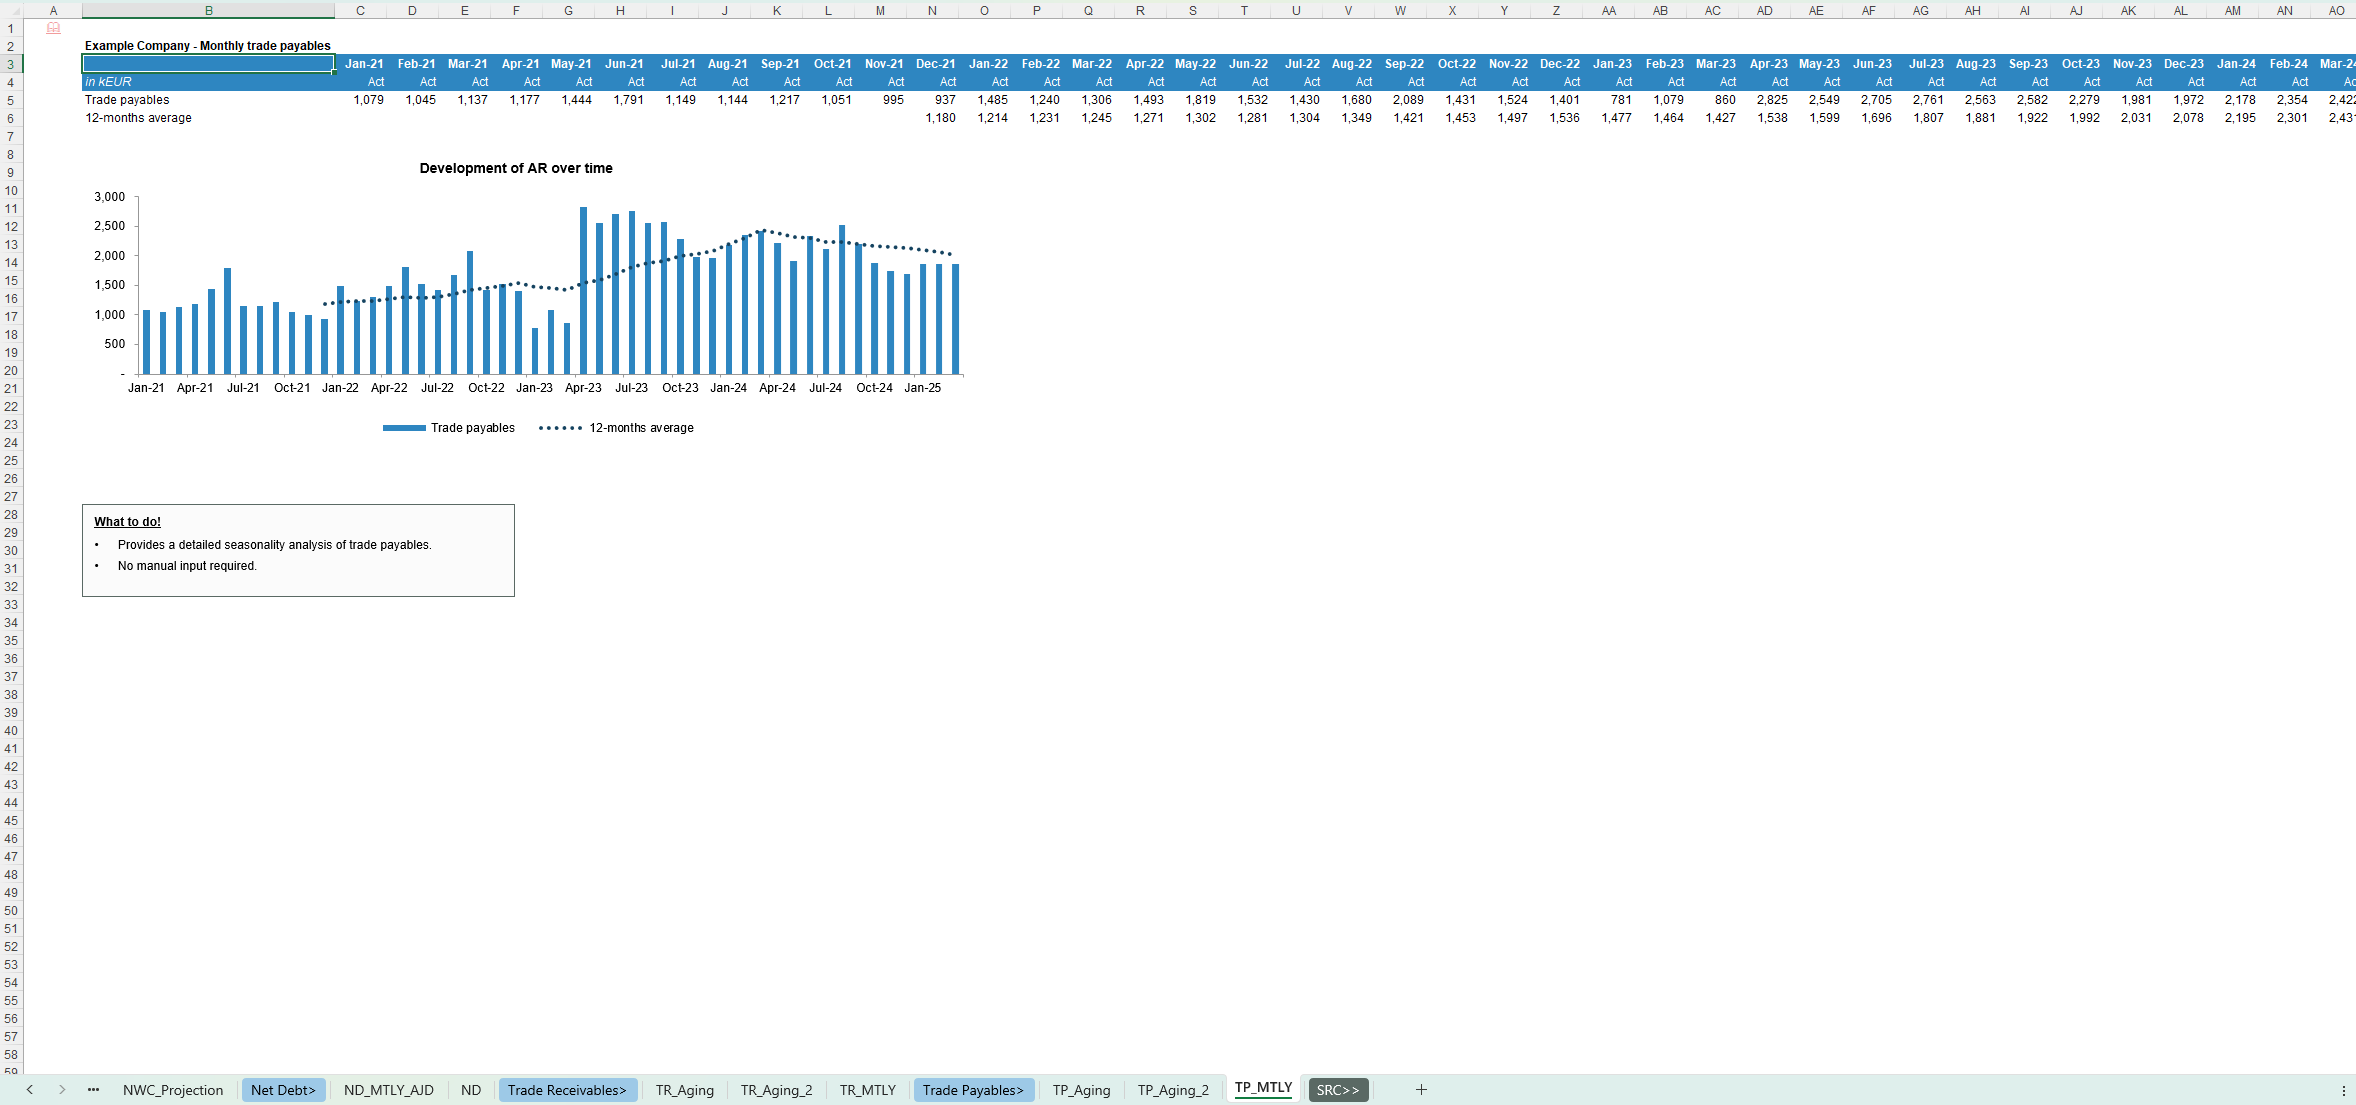
- Working Capital & aging
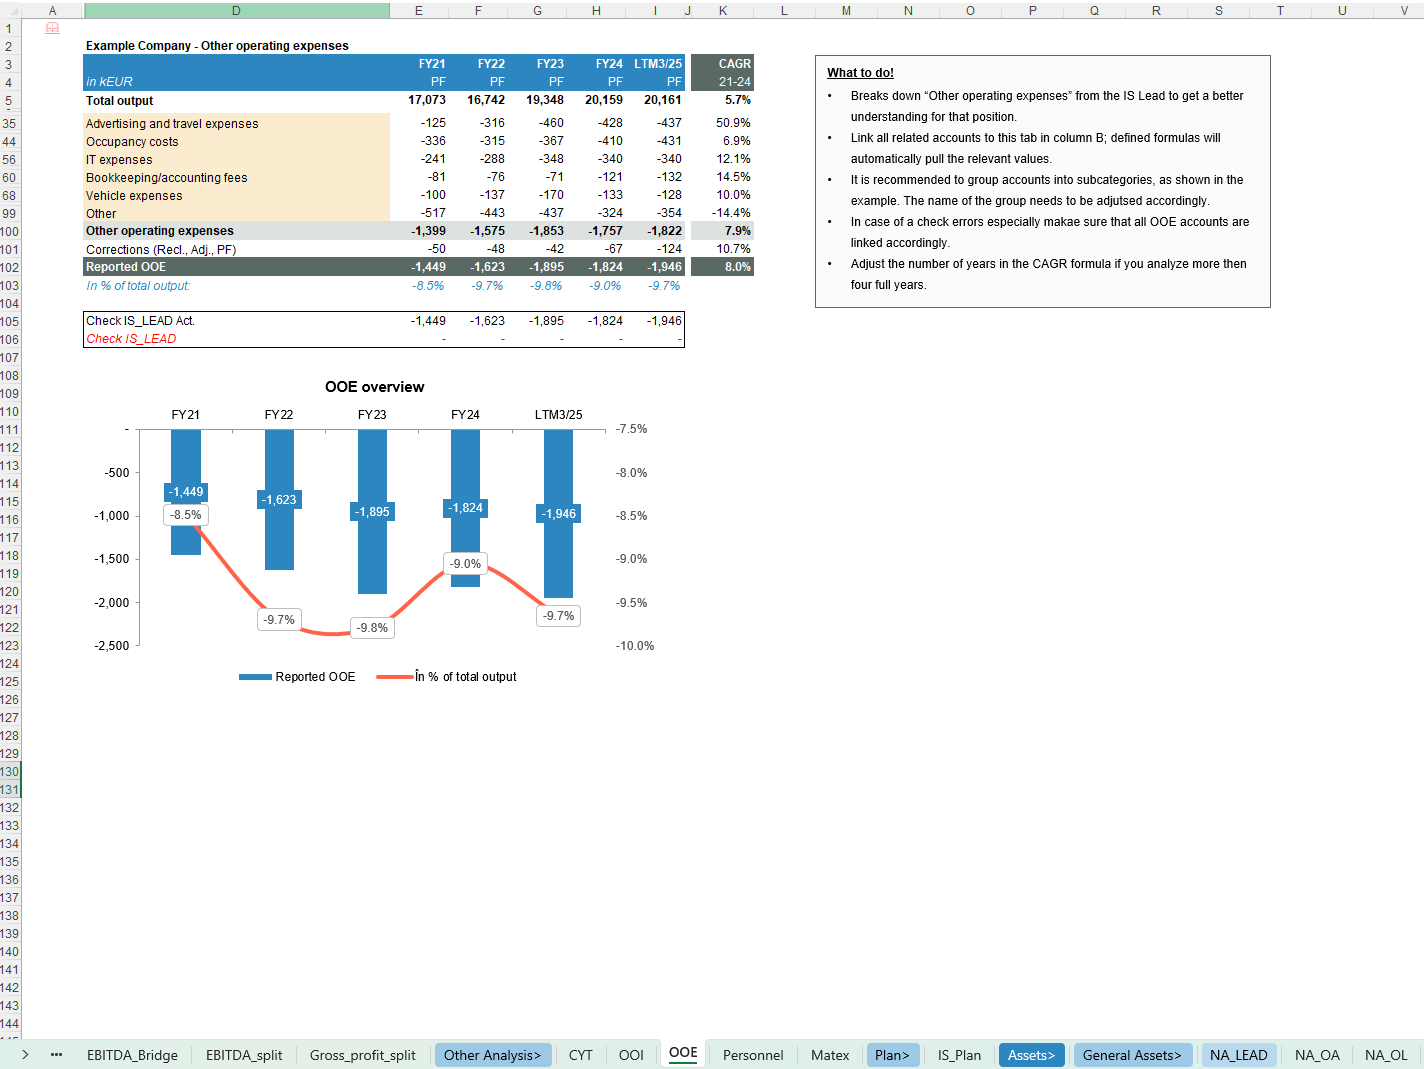
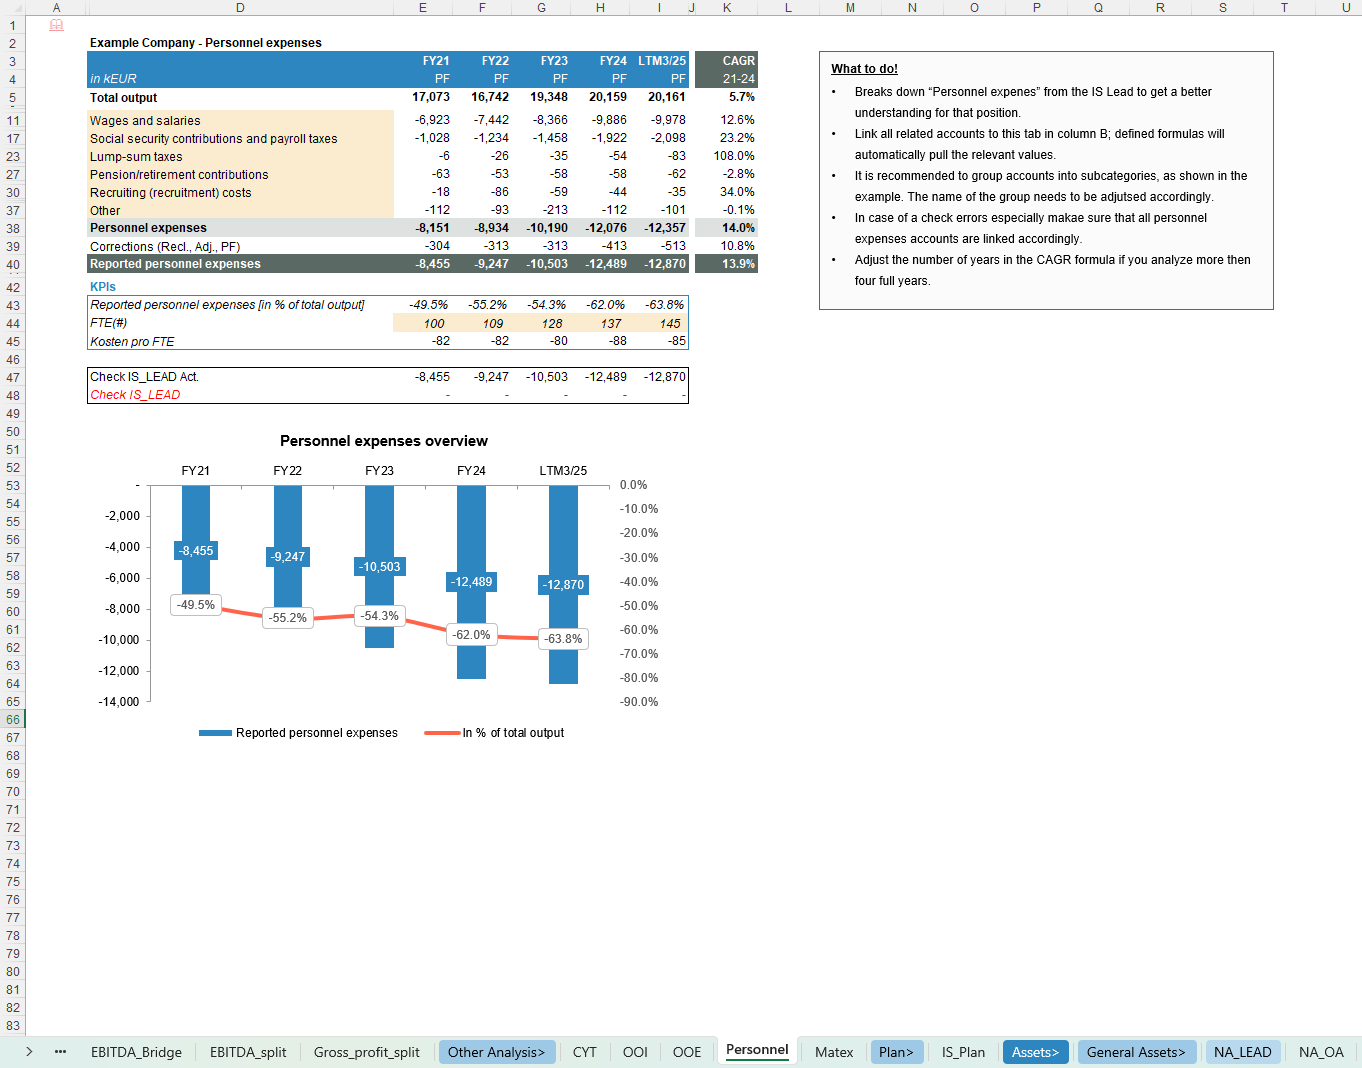
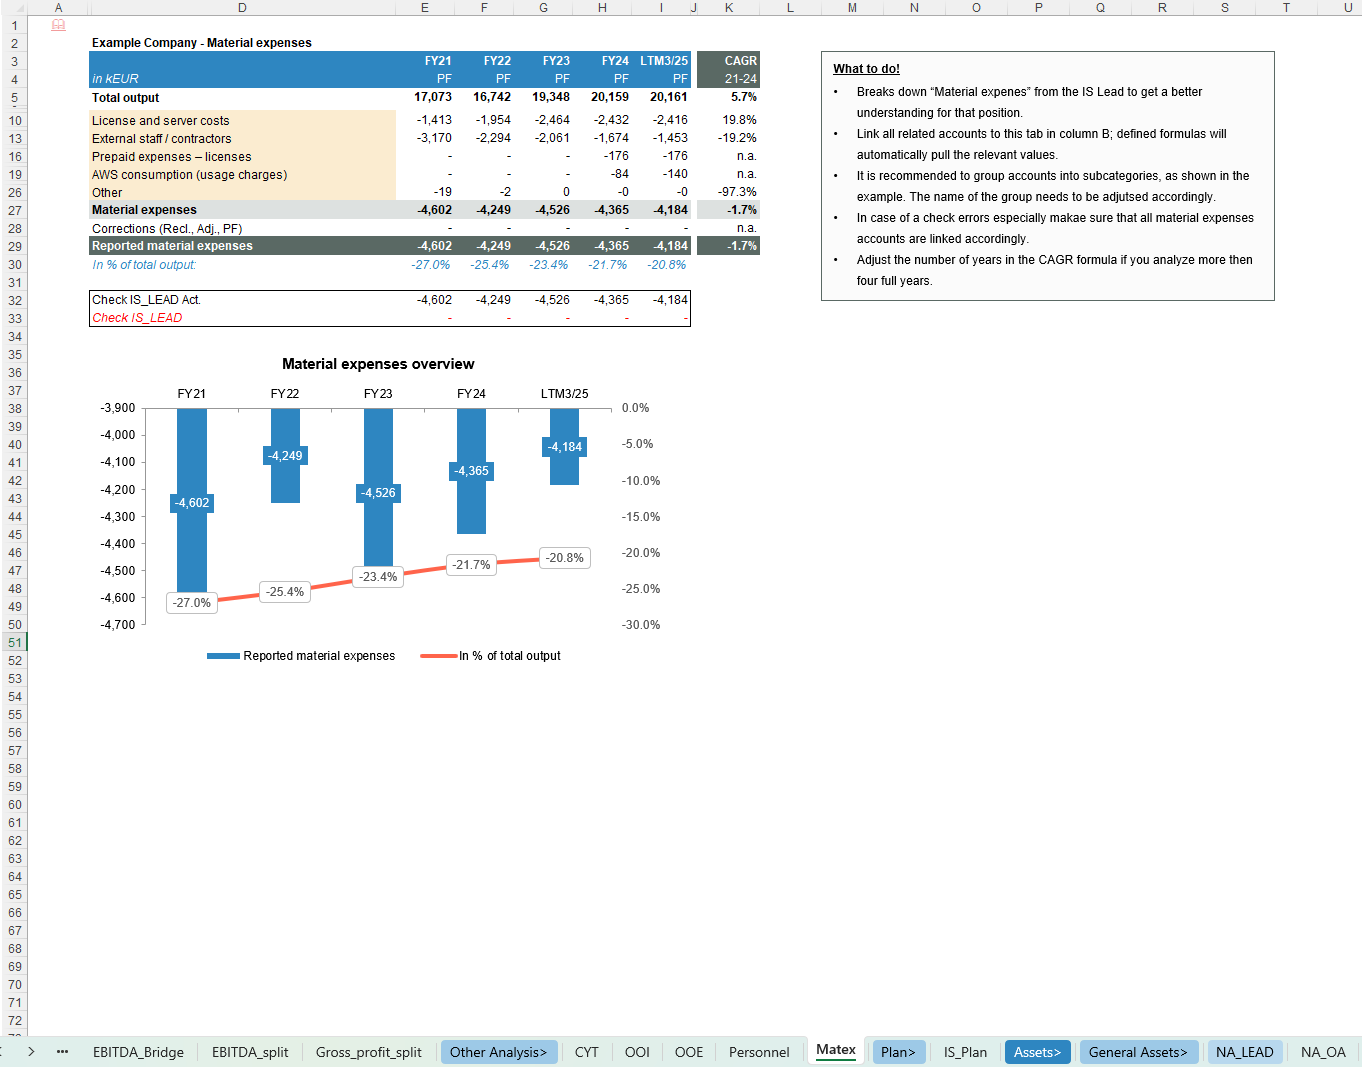
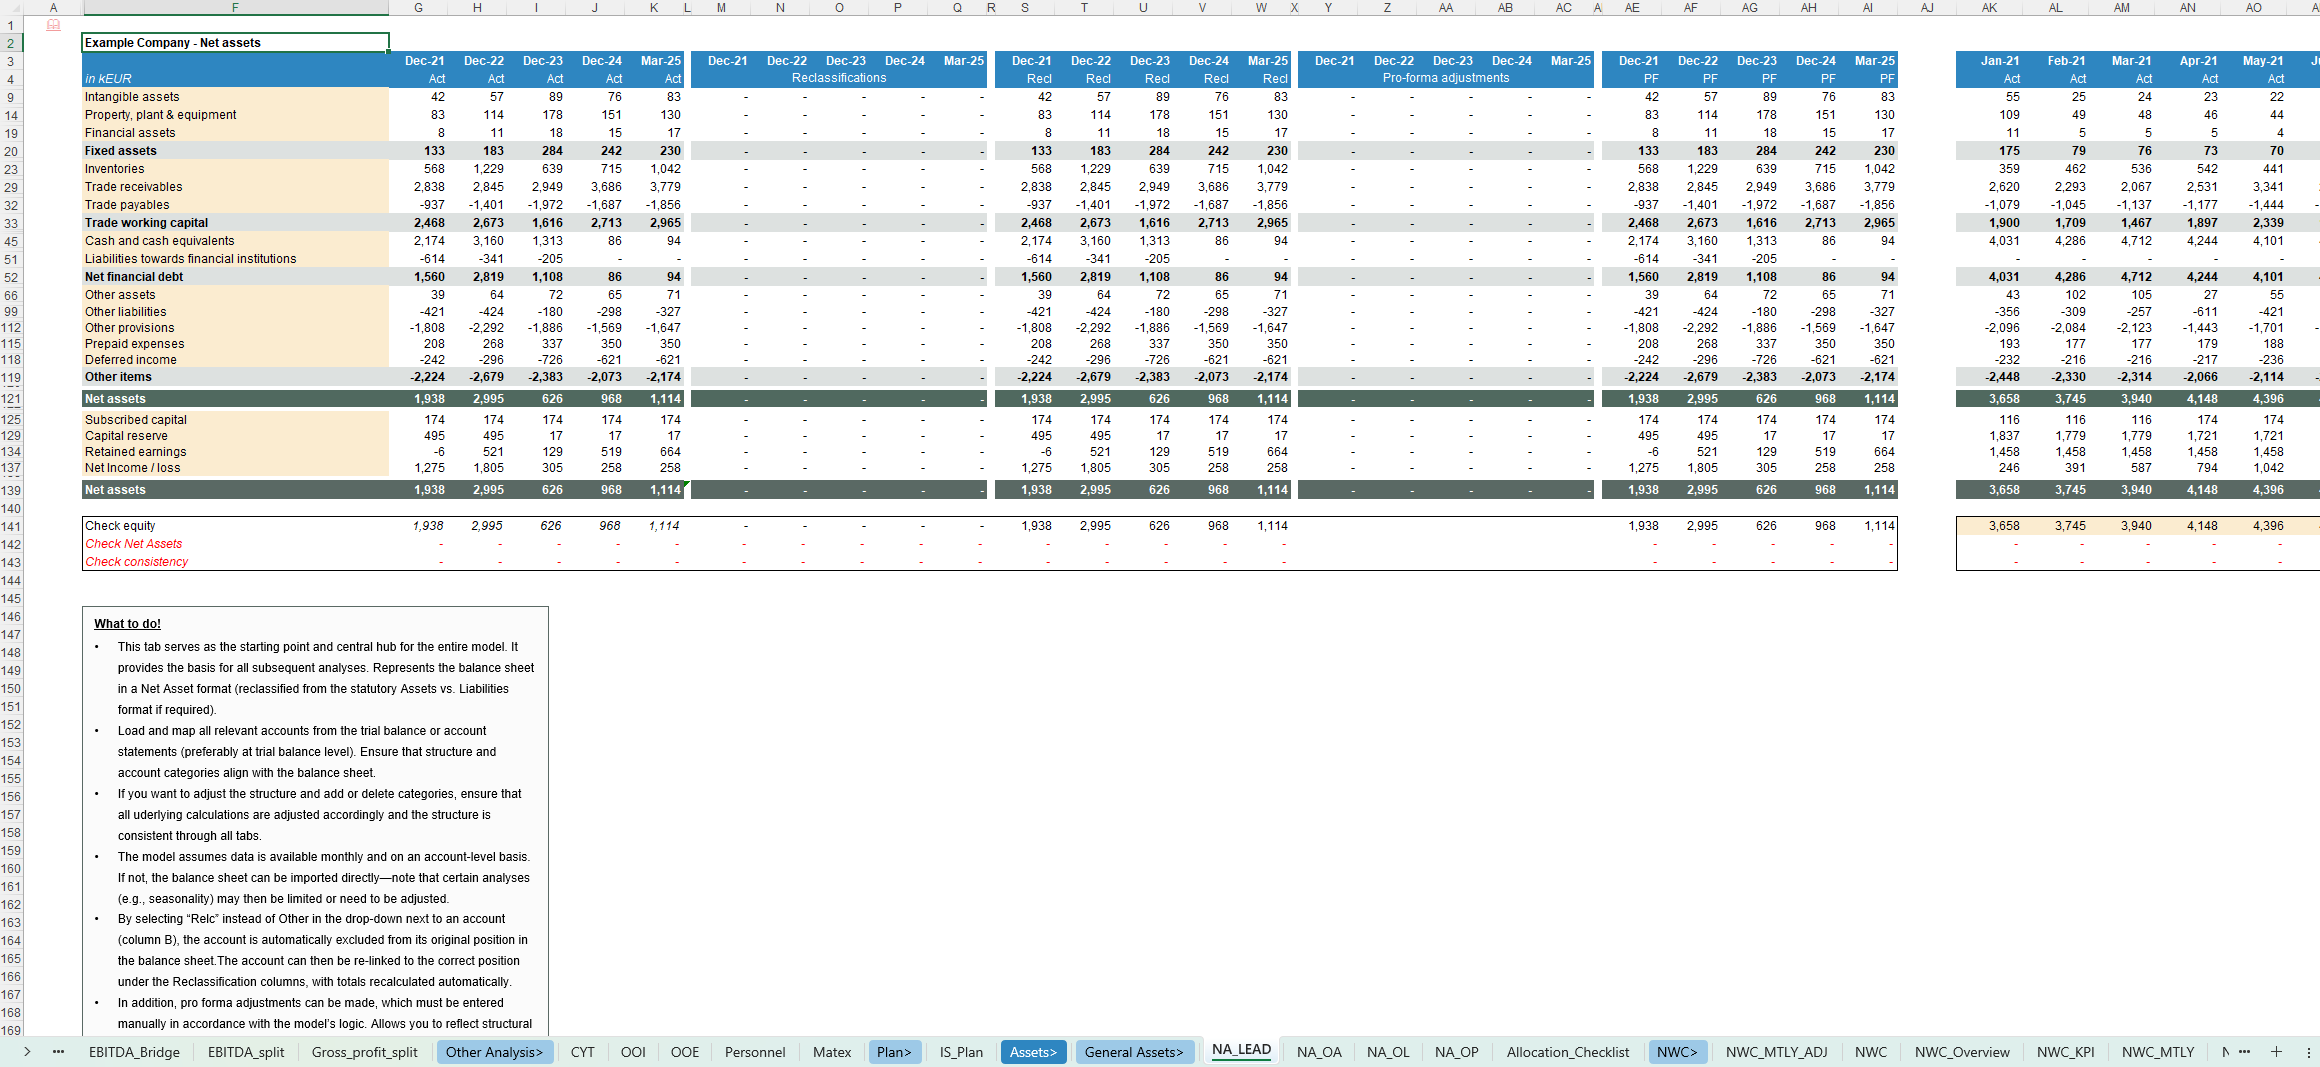
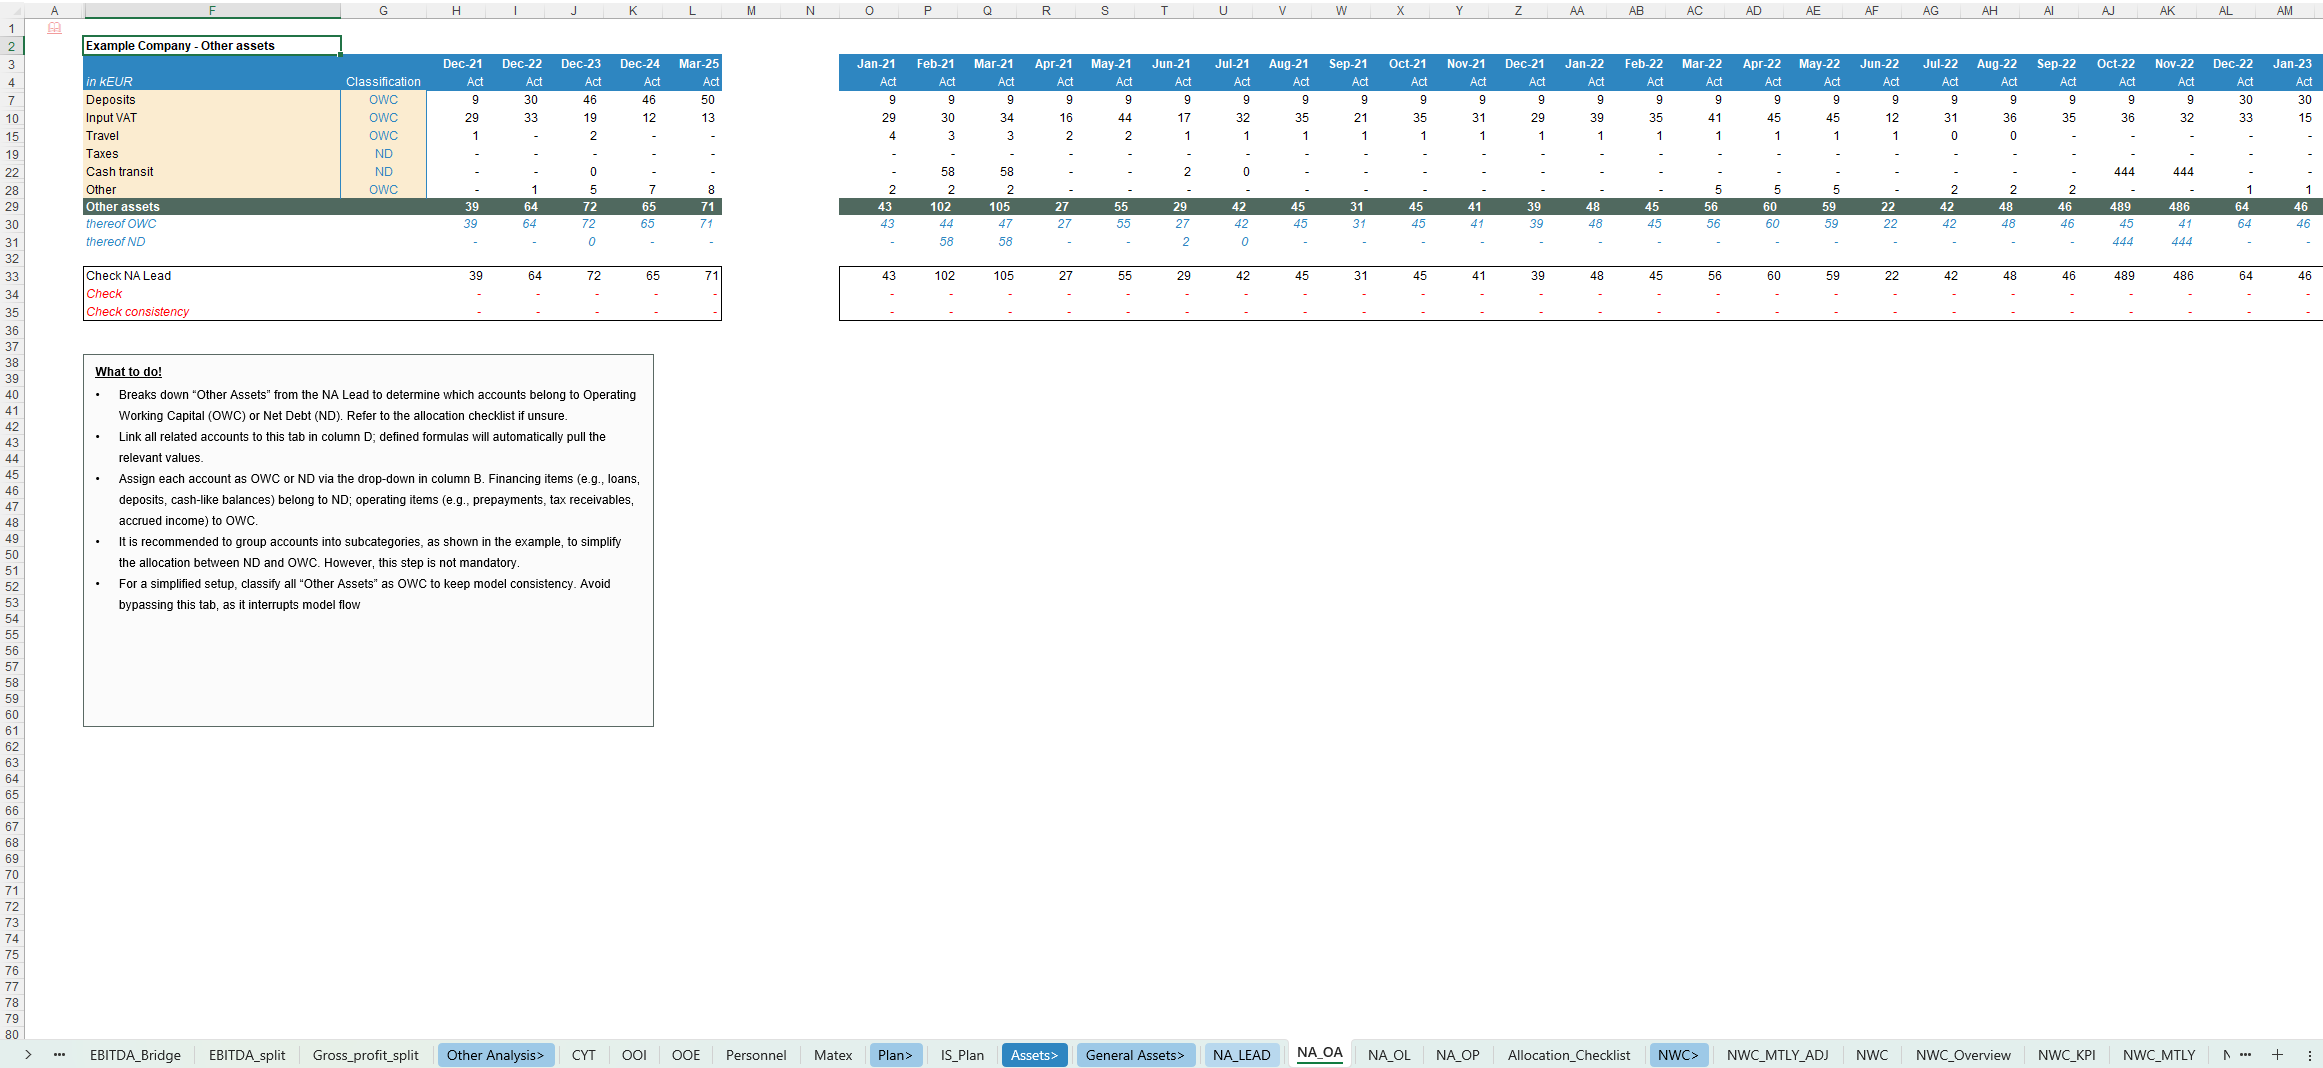
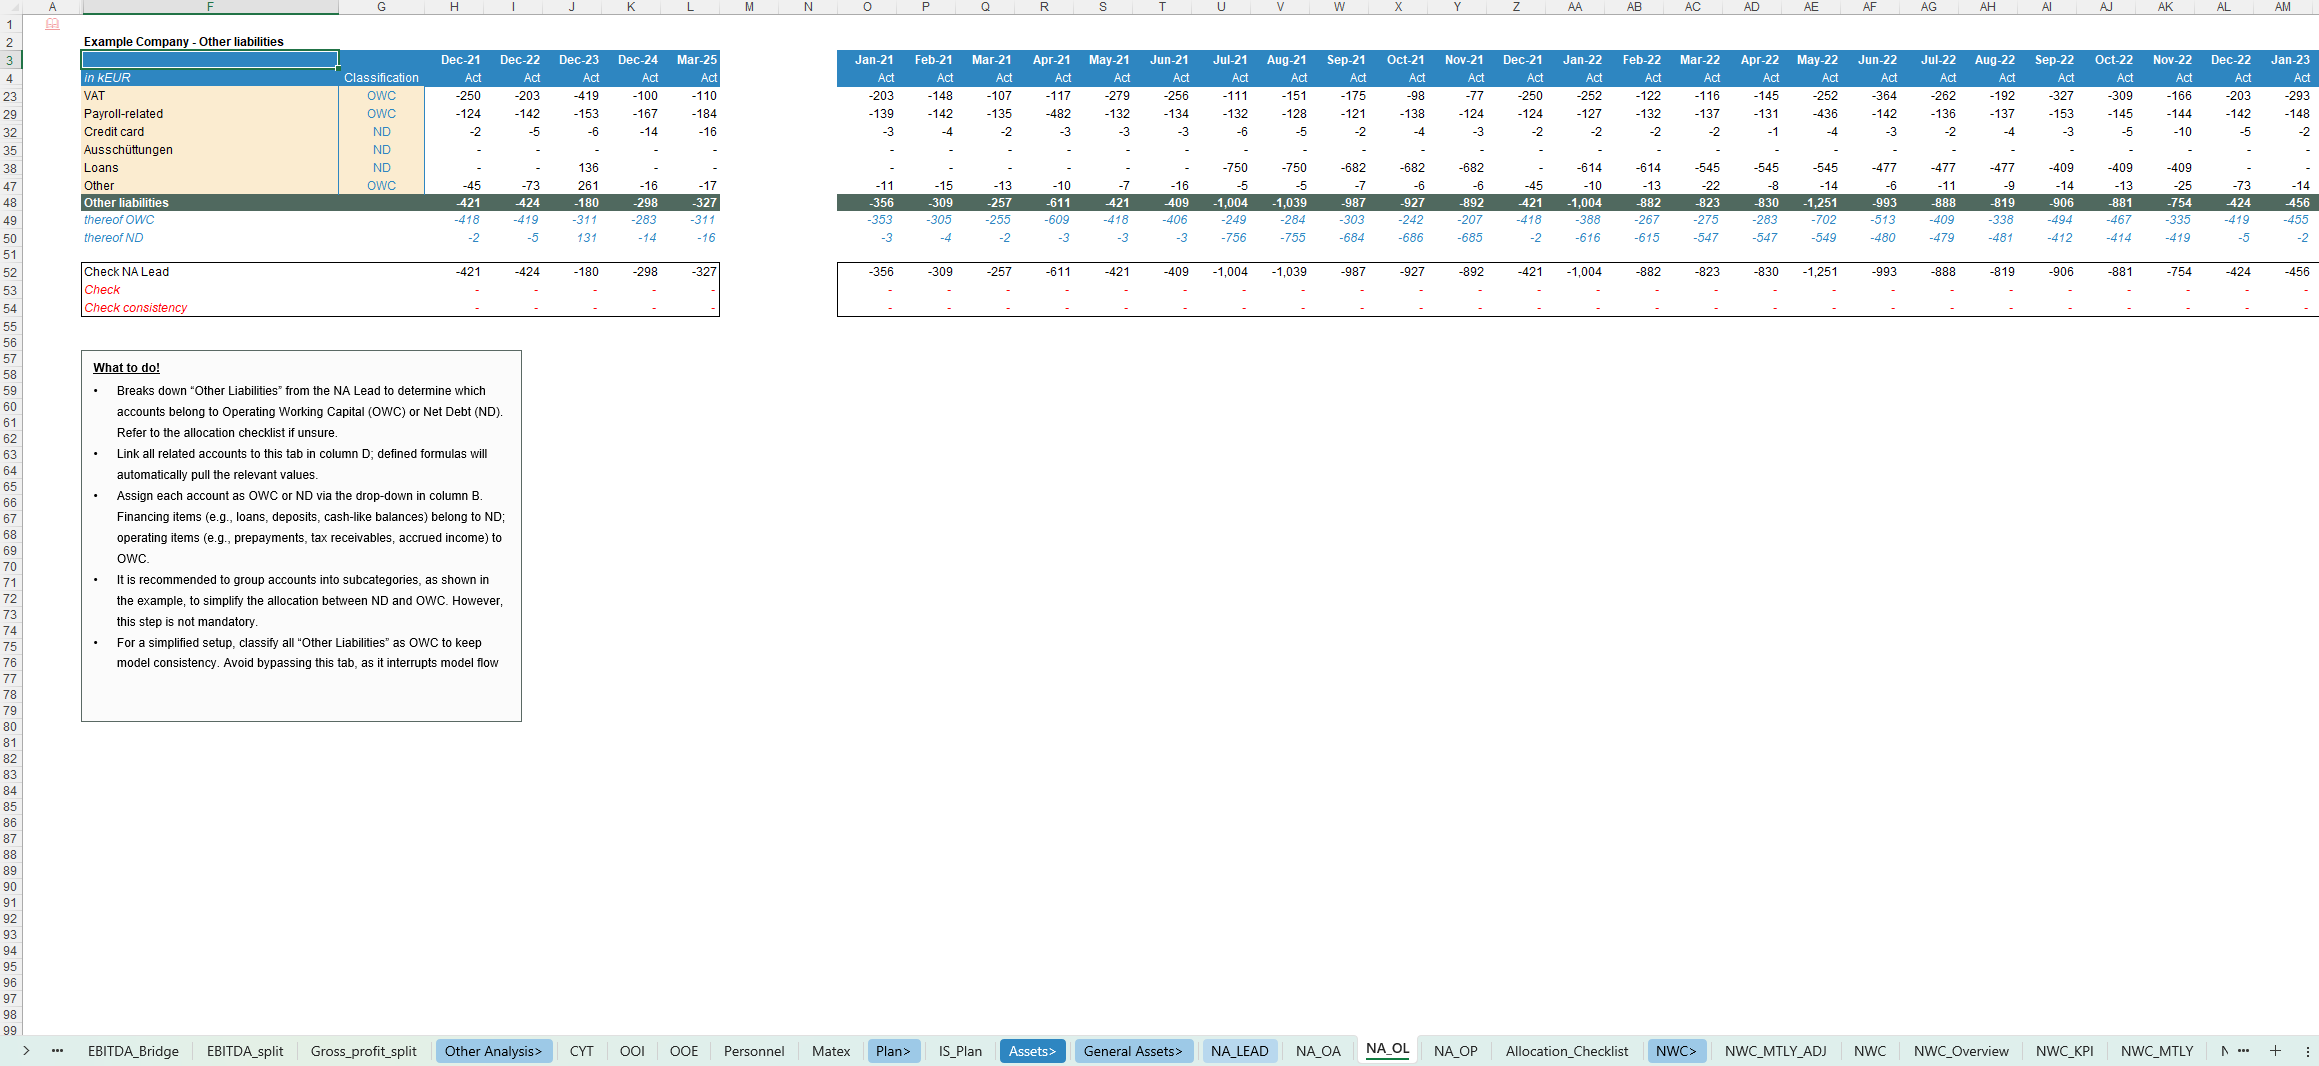
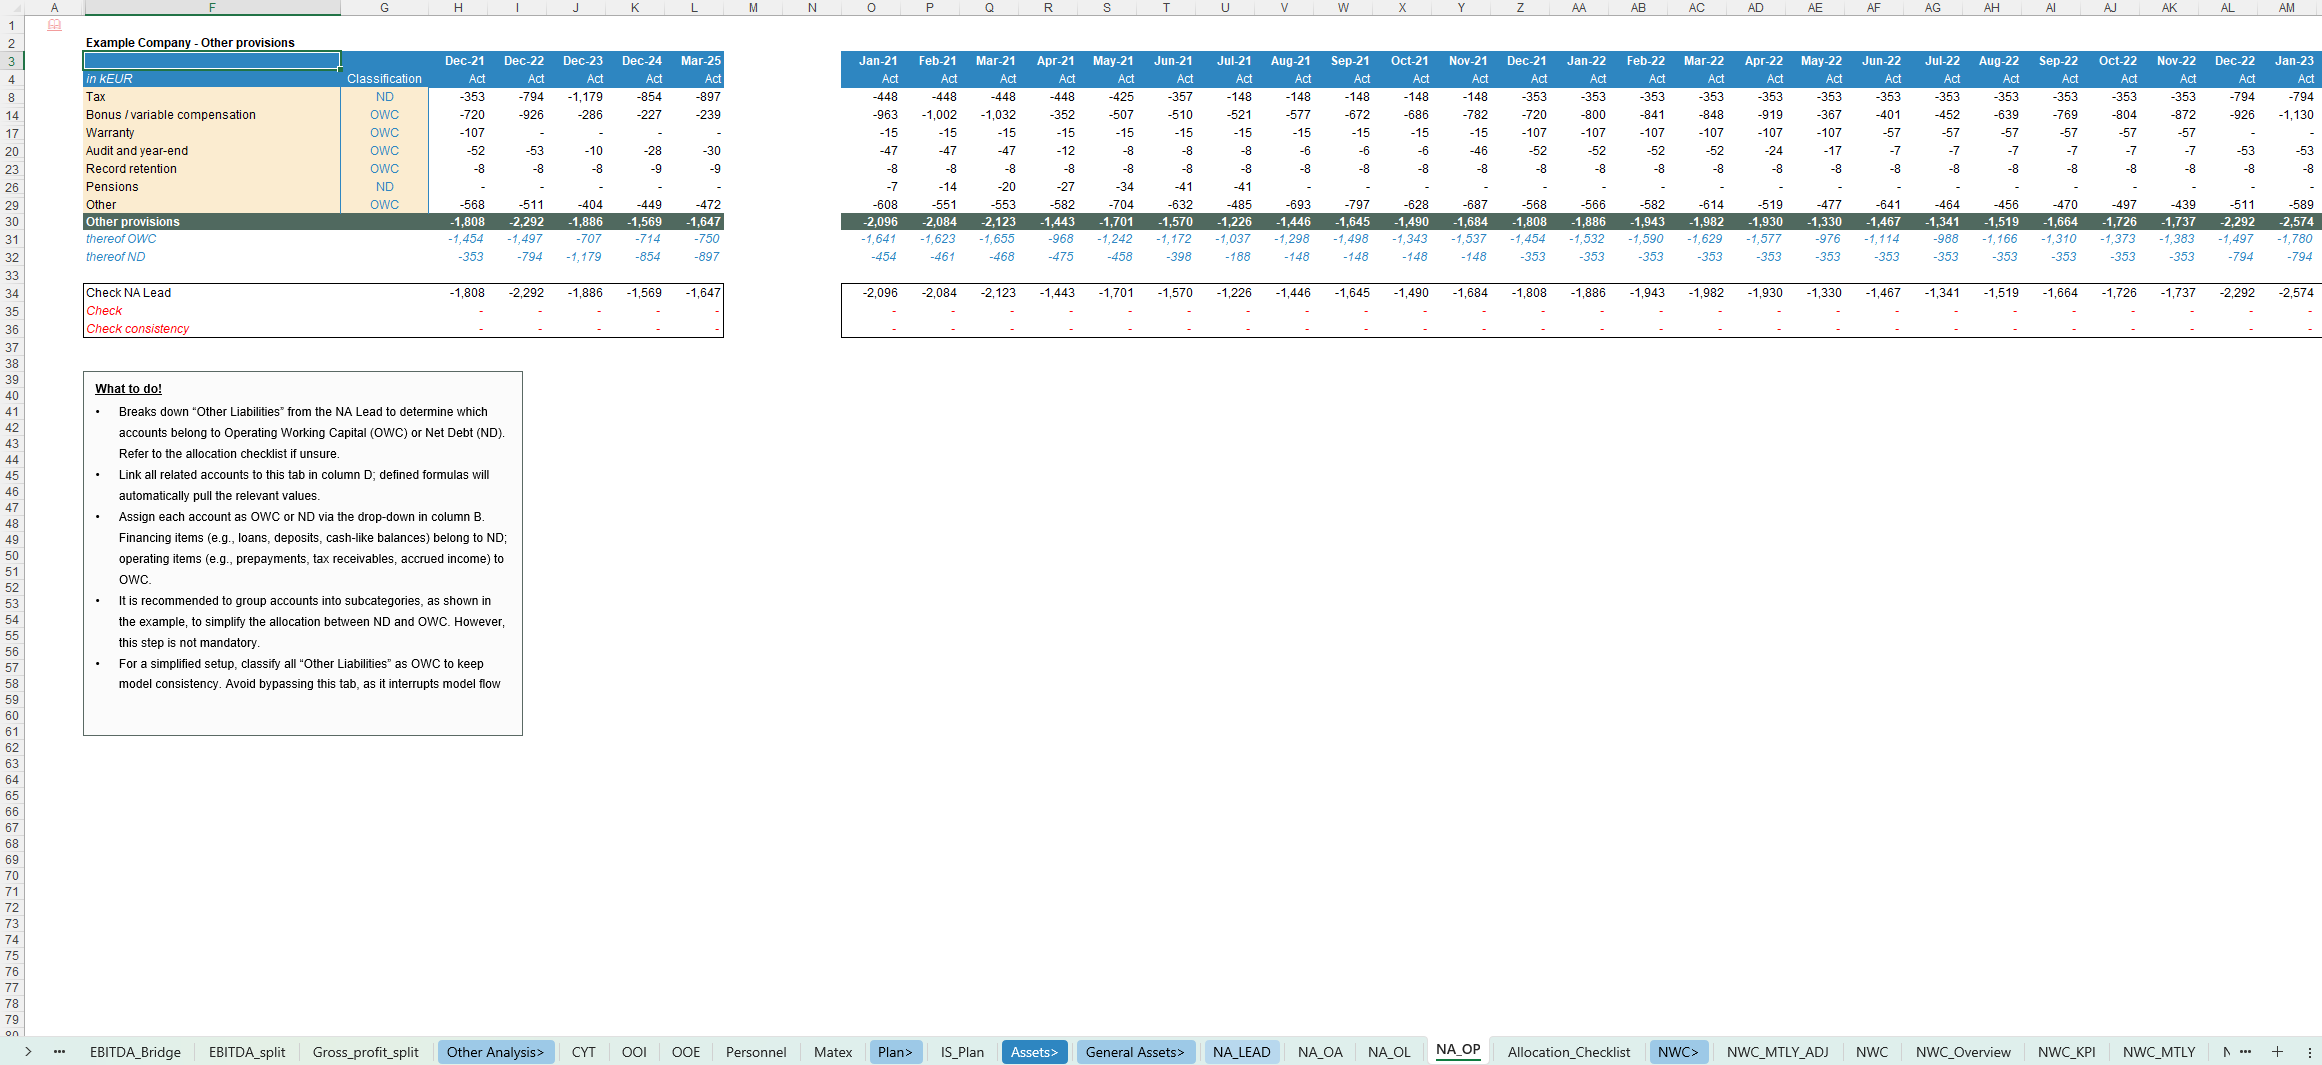
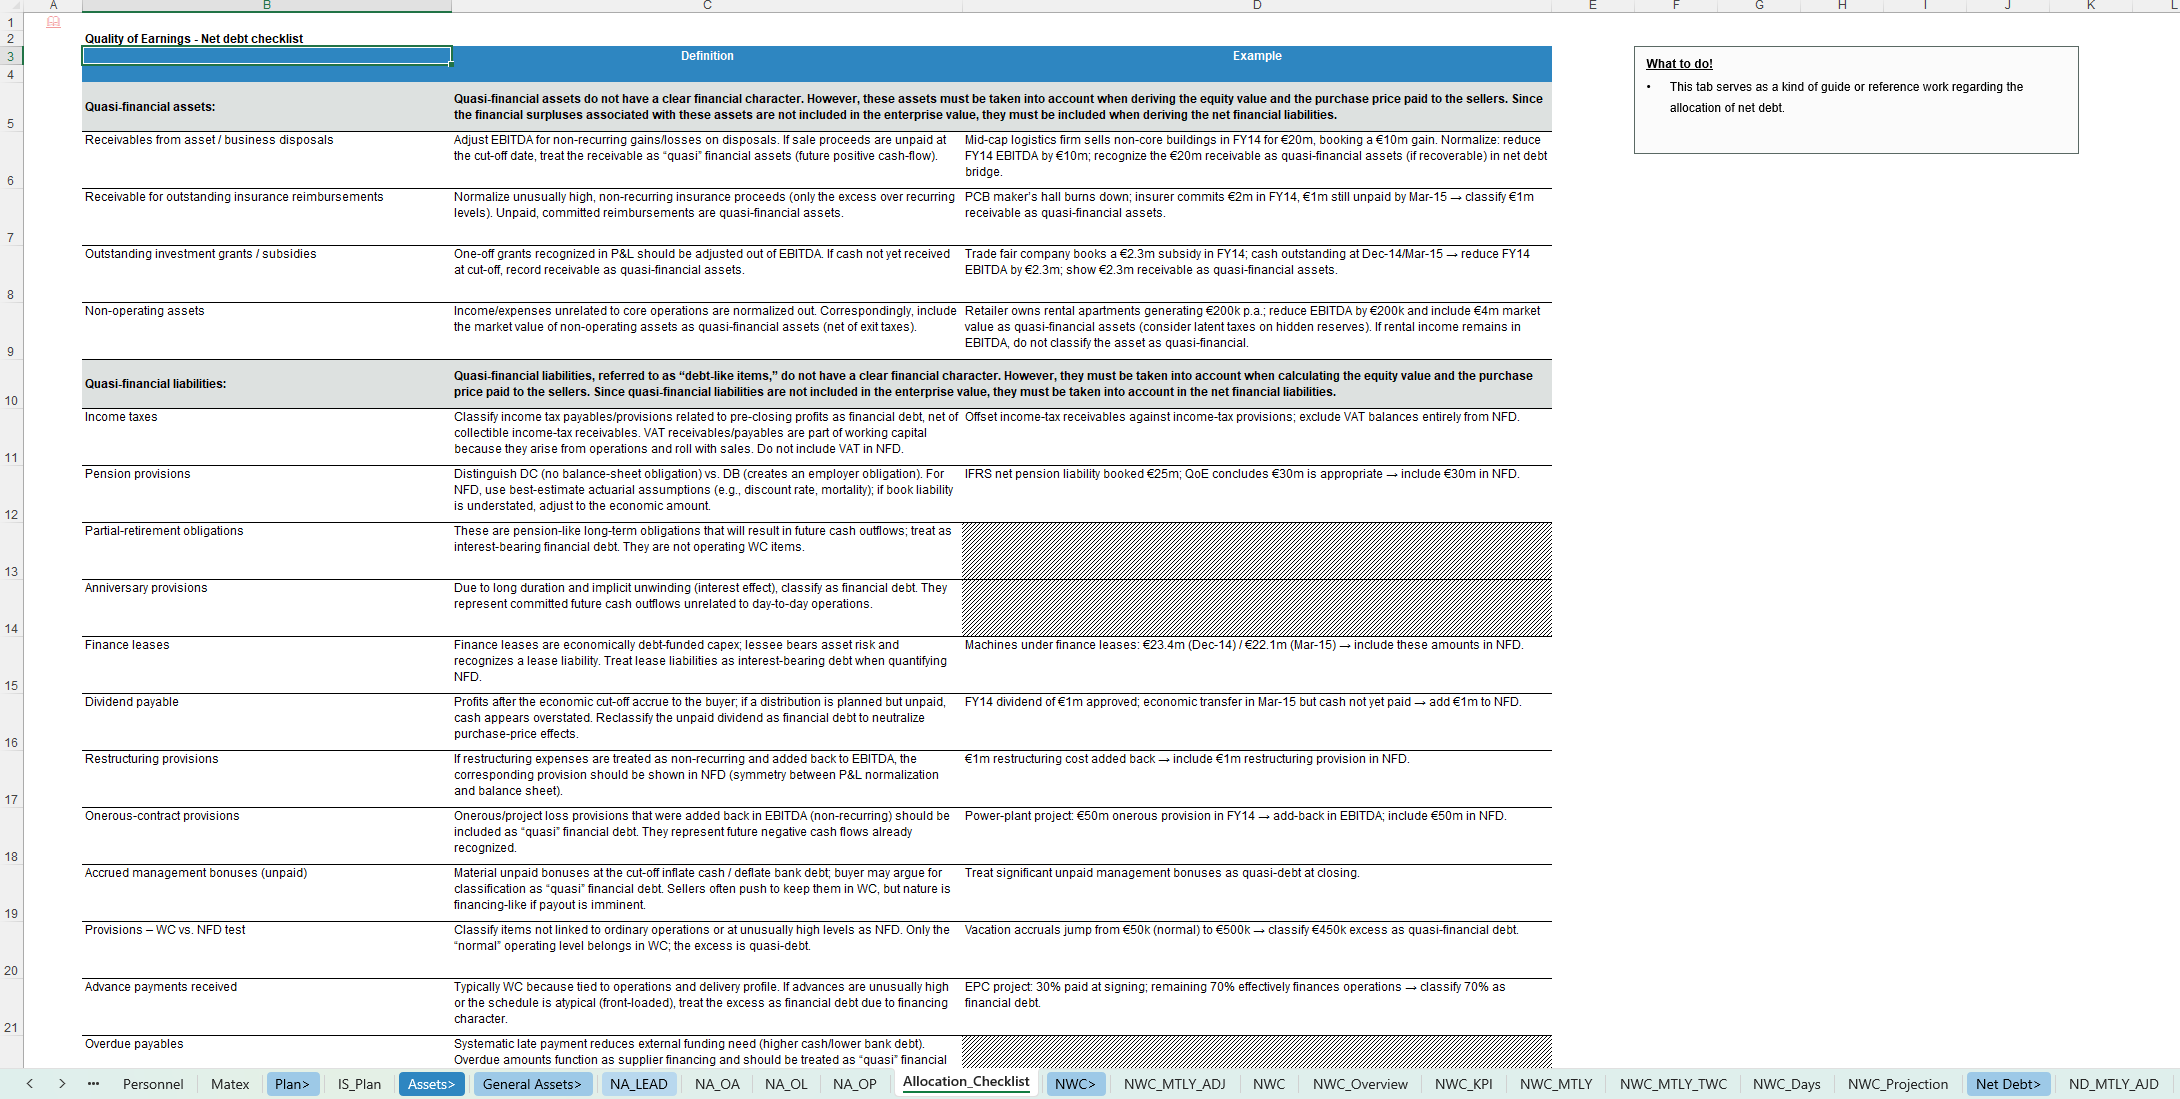
- Net Working Capital by component with clear OWC vs. Net Debt split
- DIO, DSO, DPO, CCC and NWC as % of sales / material expenses
- Trade receivables and payables aging schedules and seasonality
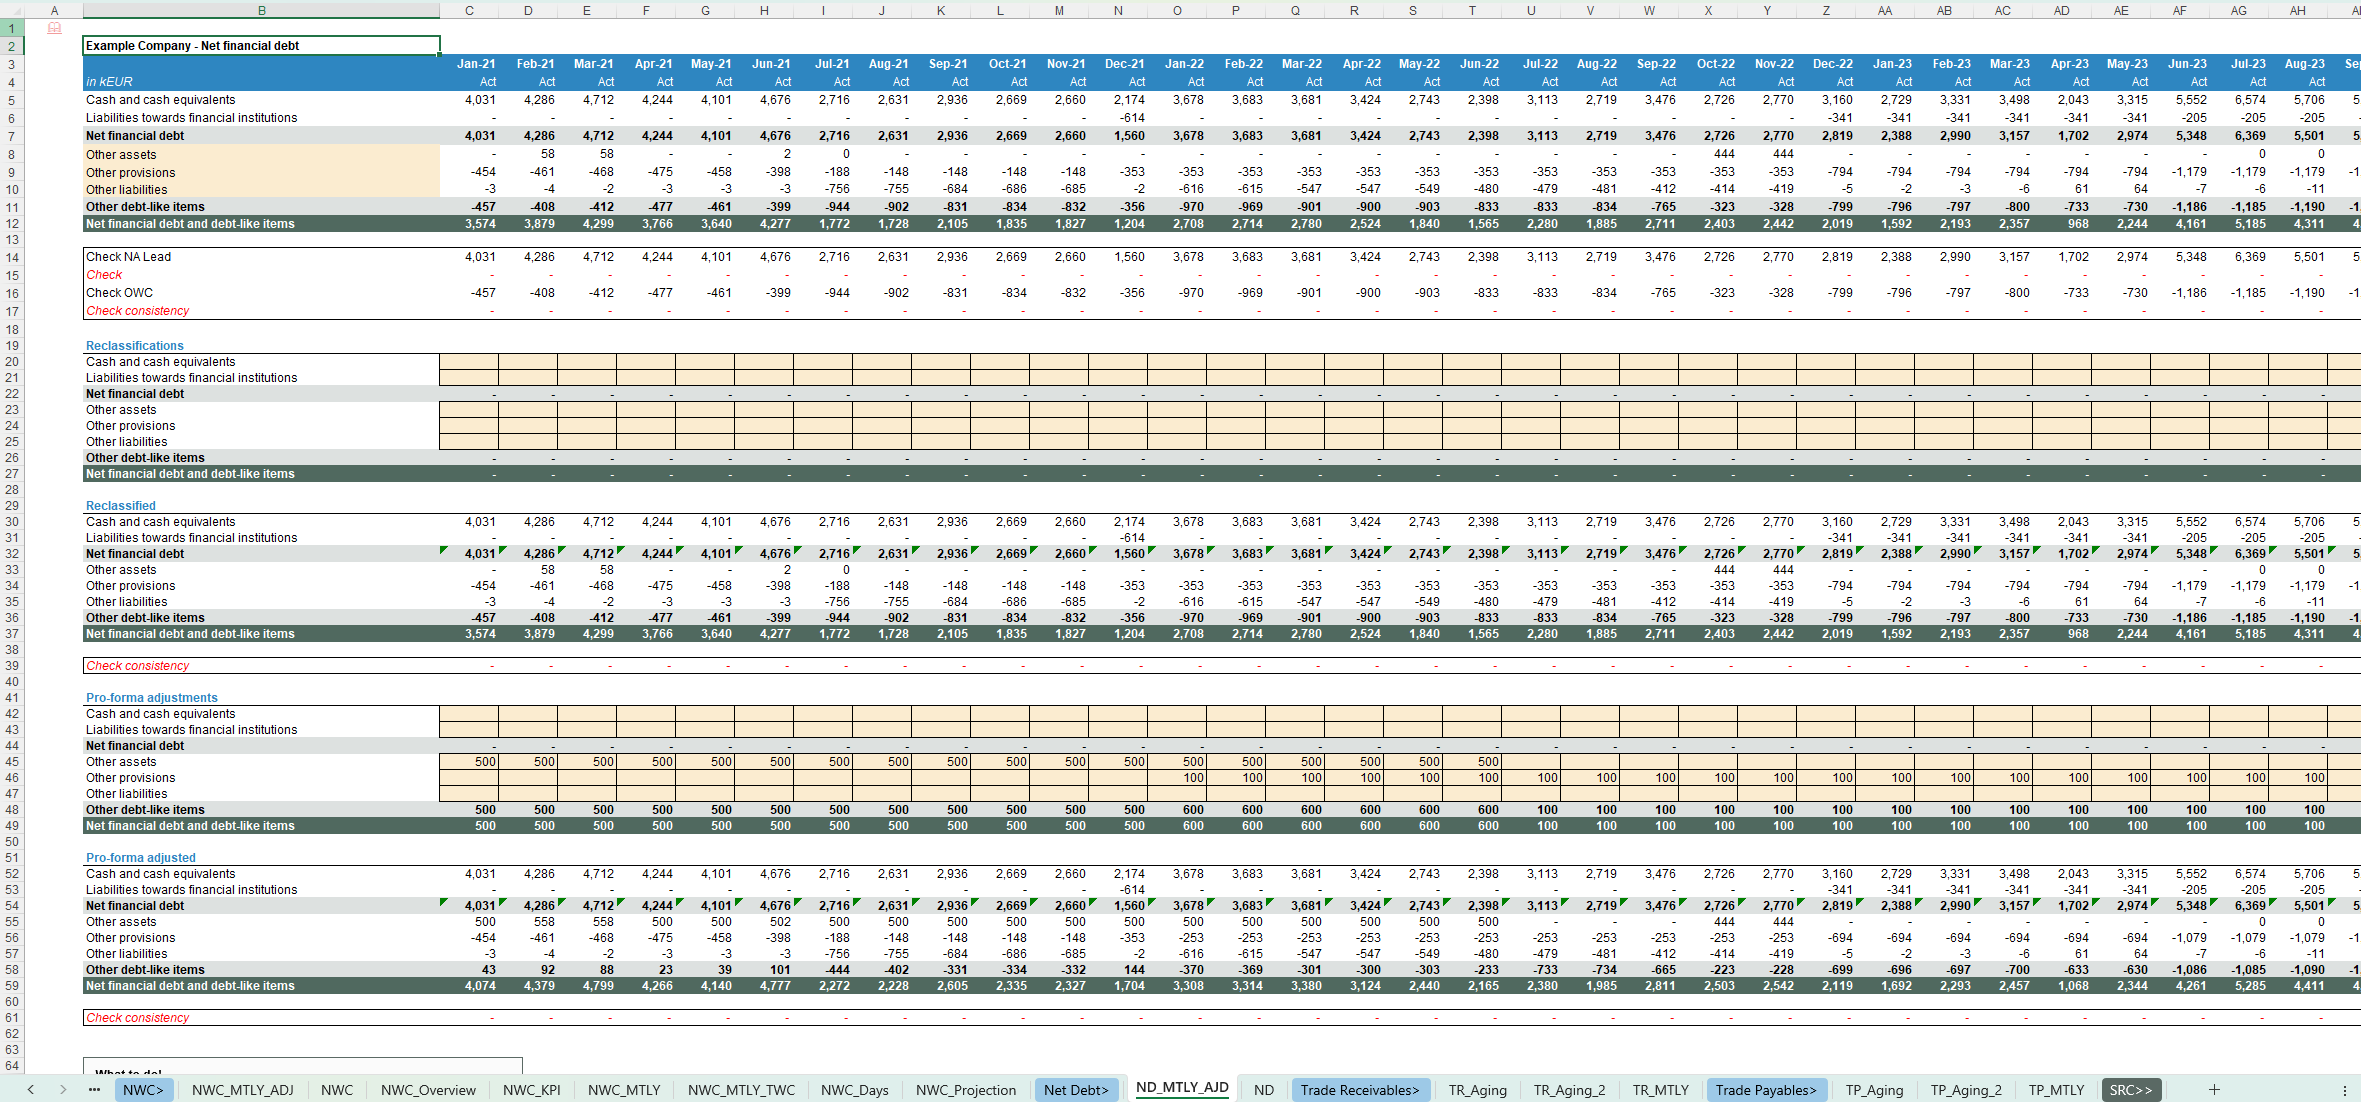
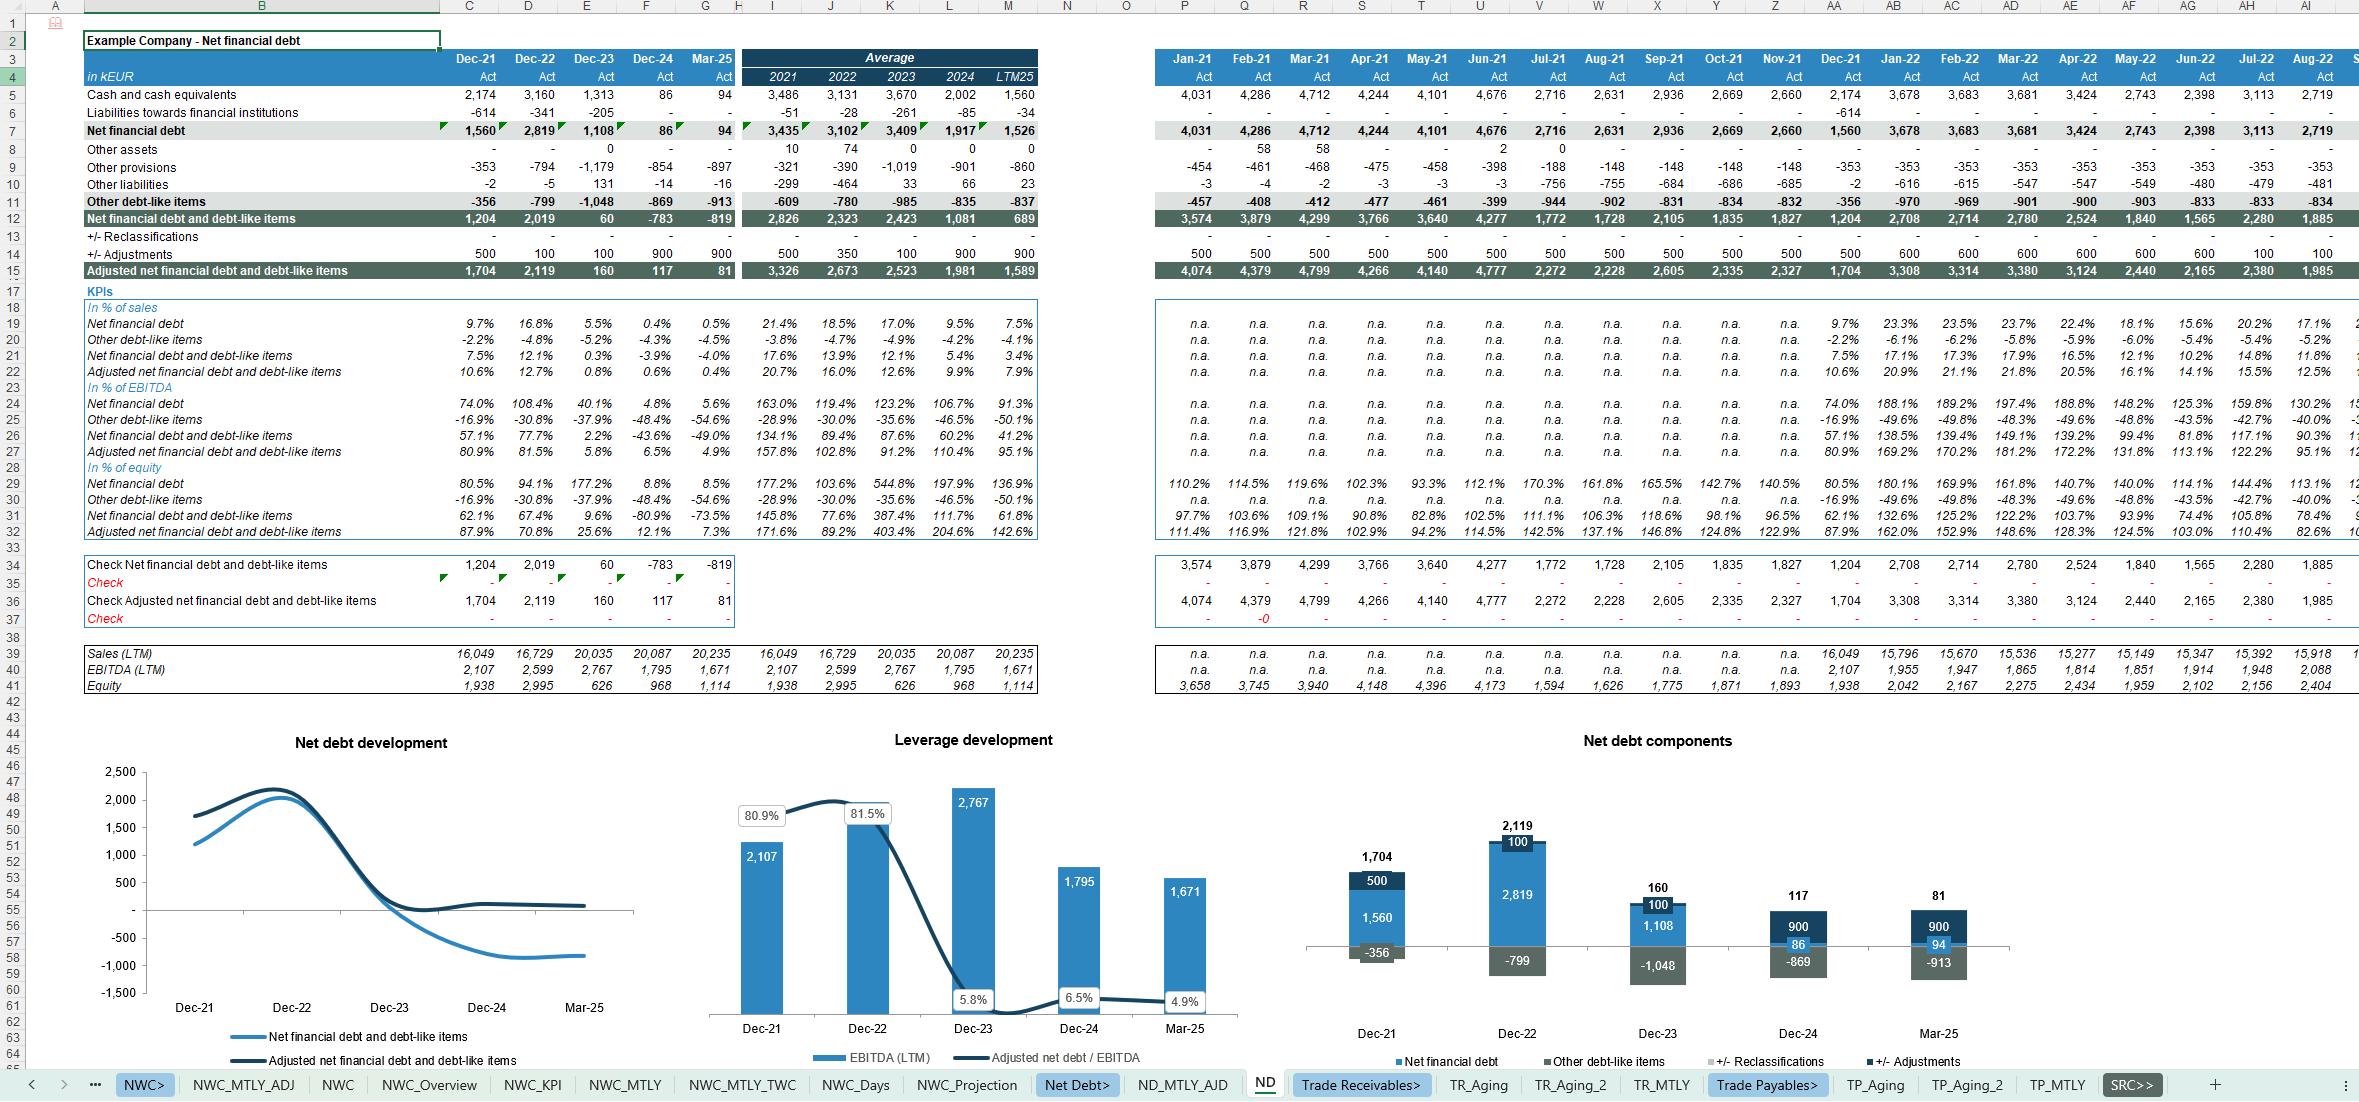
- Net Debt & debt-like items
- Net financial debt and other debt-like items (reported and pro-forma)
- Leverage KPIs (Net Debt, Adjusted Net Debt / EBITDA, Net Debt / equity)
- Net Debt composition and development charts
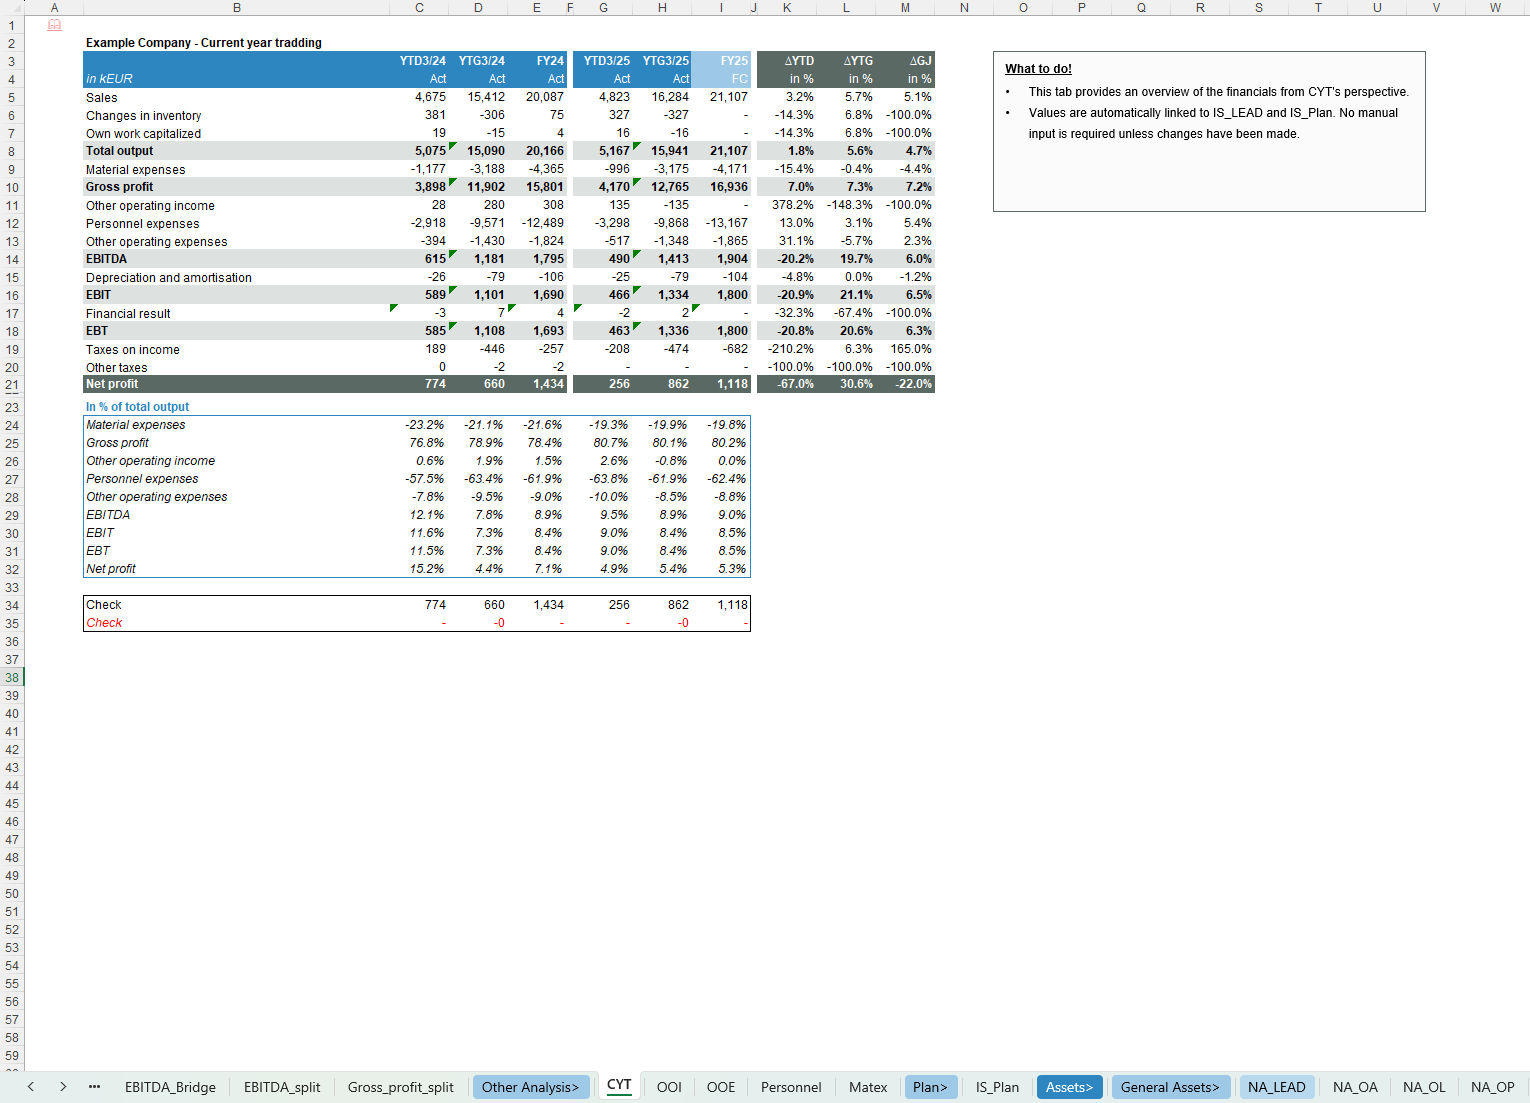
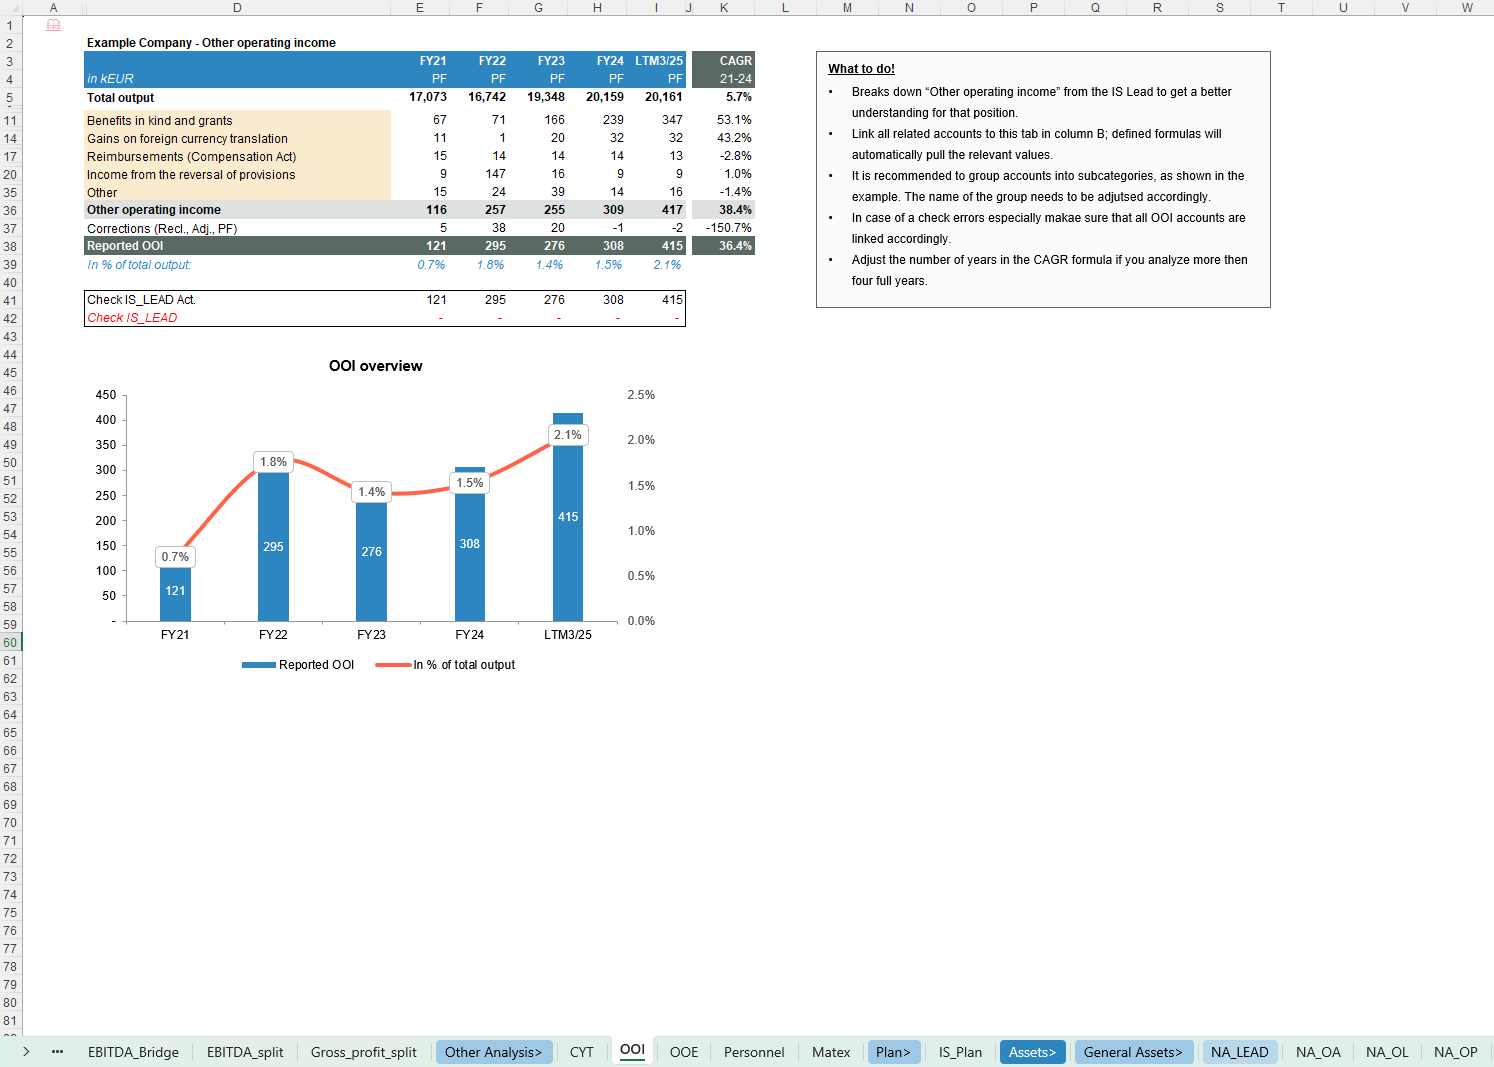
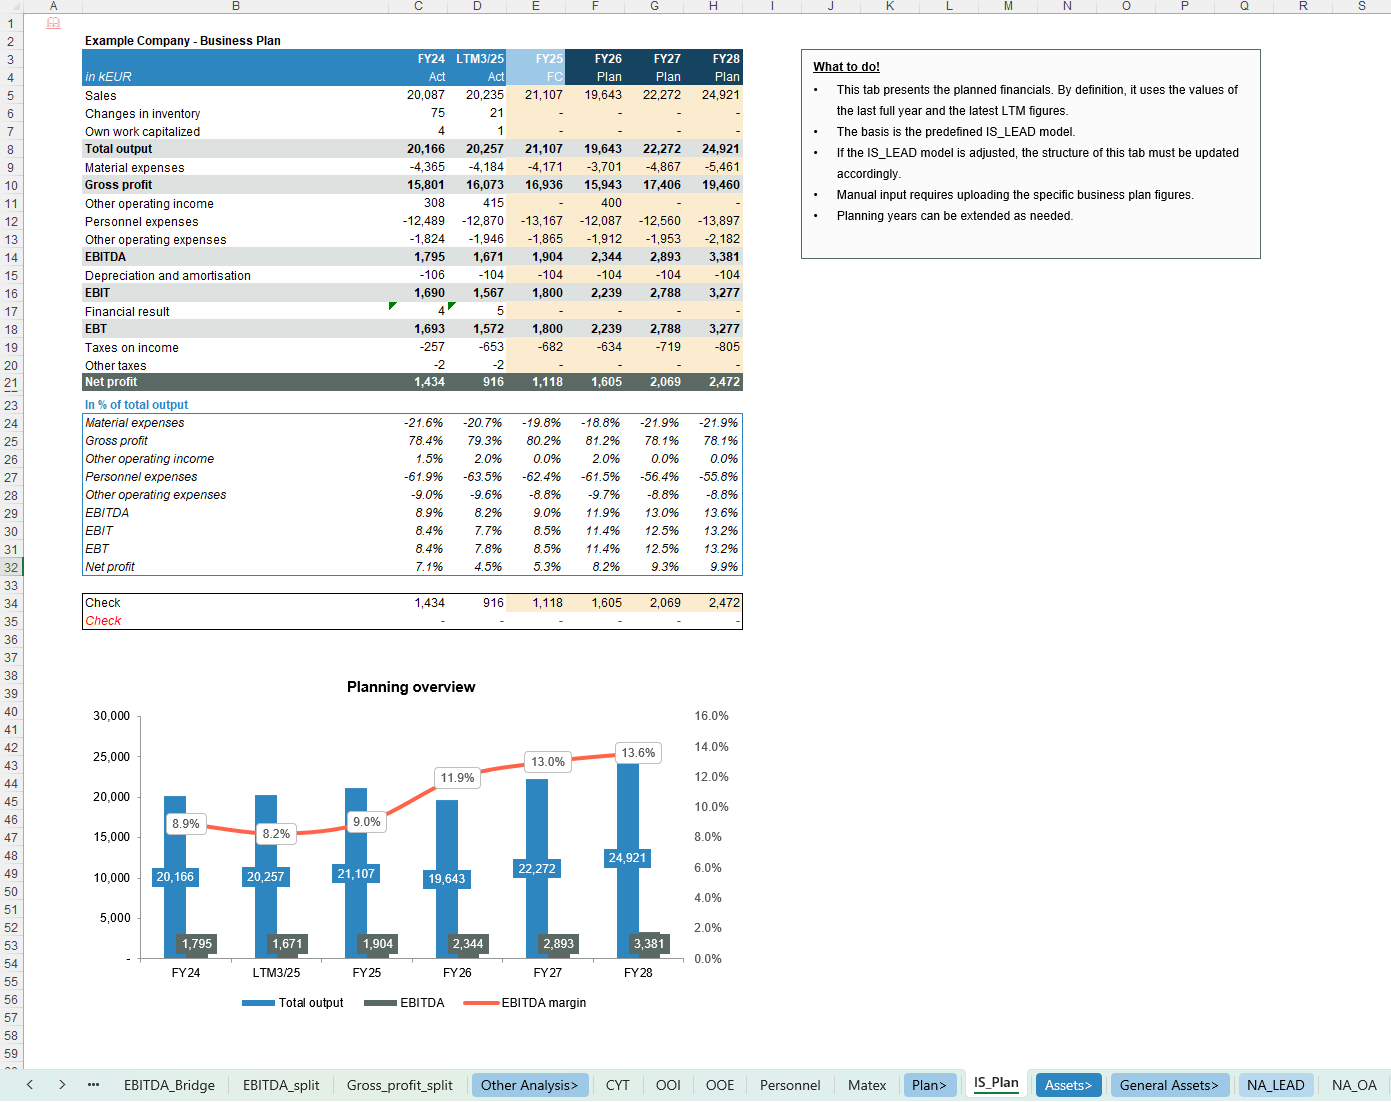
- Net Assets & CYT / expense analysis / plan
- Net Asset structure with consistent allocation to OWC, Net Debt and other categories
- Current Year Trading (YTD/YTG) views and YoY comparisons
- Detailed views on Other operating income (OOI), Other operating expenses (OOE), Personnel and Material expenses
- Business plan module linking historic / LTM to forward-looking plan years
Key Inputs & Assumptions
- Trial balance / financial statements, ideally monthly and at account level
- Sales detail with segment information (division, product, region, customer), where available
- Mapping rules for Net Assets, Working Capital vs. Net Debt classification and QoE categories
- Optional business plan figures (sales, costs, EBITDA, etc.) for the planning section
How to use
- Set the core parameters (periods, segments, currency, plan horizon) in the Assumptions sheet.
- Load historical trial balance and sales detail into the relevant source / lead tabs and reconcile totals.
- Classify accounts for QoE, Working Capital vs. Net Debt and Net Asset categories, and enter relevant adjustments (QoE, NWC, Net Debt, pro-forma items).
- Navigate through the Earnings/QoE, Sales & Profitability, Working Capital, Net Debt, Net Assets, CYT and Plan tabs to review the integrated set of analyses, bridges and KPIs for use in your reports and factbooks.
Customization & support
The workbook is highly customisable – you can easily adapt categories, segment structures, labels, KPIs and charts to your firm standards, sector specifics or lender / investor reporting requirements. For more complex customisations or individual needs (e.g. firm-branded versions, additional modules, integration with existing templates or client-specific setups), feel free to reach out and we can discuss a tailored solution.
Each download includes both a fully blank “Clean Template” for working directly with your own data and a pre-populated Example Template that illustrates the model’s logic and calculations using realistic sample data.
The screenshots provide a good first impression of the model, but they do not fully capture all functionalities and details—if you have any questions or would like to better understand specific features, feel free to reach out anytime.
This Best Practice includes
2 Excel Files (1 CLEAN version and 1 EXAMPLE version)
Further information
Provide an all-in-one FDD workbook for Transaction Services that automates core analyses and visualizations while relying on user refinement and judgement to unlock its full analytical value in DD factbooks.
