Originally published: 27/11/2025 14:26
Last version published: 15/12/2025 08:34
Publication number: ELQ-50607-4
View all versions & Certificate
Last version published: 15/12/2025 08:34
Publication number: ELQ-50607-4
View all versions & Certificate

Transaction Services – FDD Net Debt & Debt-Like Items Analysis Model - DEMO
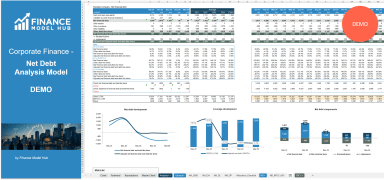
This FDD workbook for Transaction Services enables clear, detailed Net Debt analysis, highlighting key drivers and providing a comprehensive view for DD factboo
Independent financial analyst with a focus on valuation, transaction services, M&A analyses.Follow
net debtnet financial debtdebt-like itemsadjusted net debtleverage ratioscash and cash equivalentsdue dilligencefactbooktransaction services
Description
NOTE: This is the demo (protected) version of the model. You can get access to the UNLOCKED version of the model via: https://www.eloquens.com/tool/4M7Viv2d/finance/debt-schedule-financial-excel-models/corporate-finance-net-debt-analysis-model
Purpose of the tool
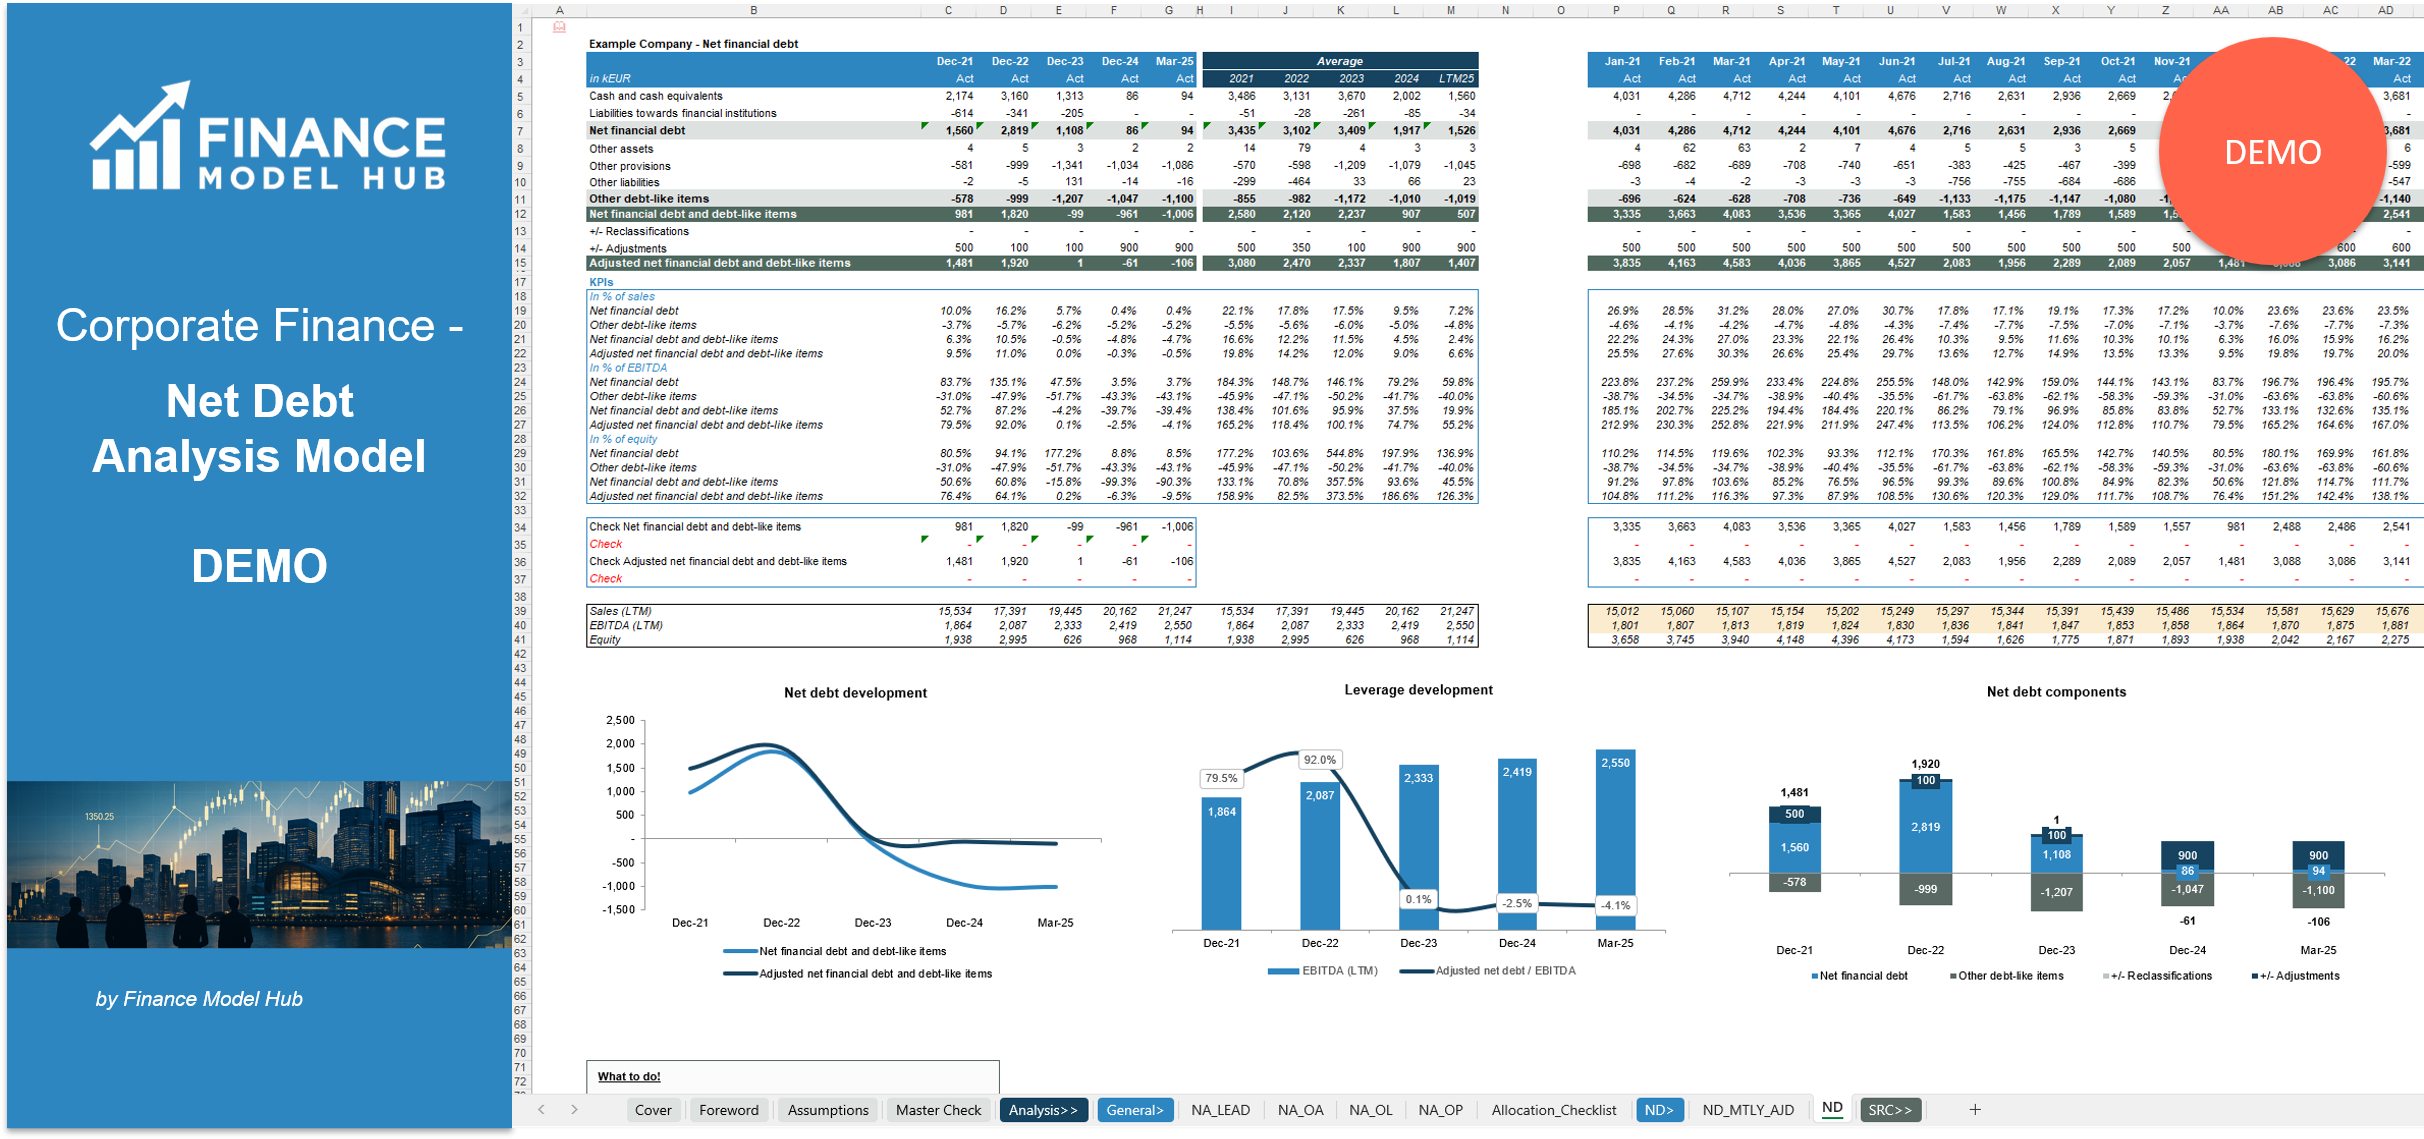
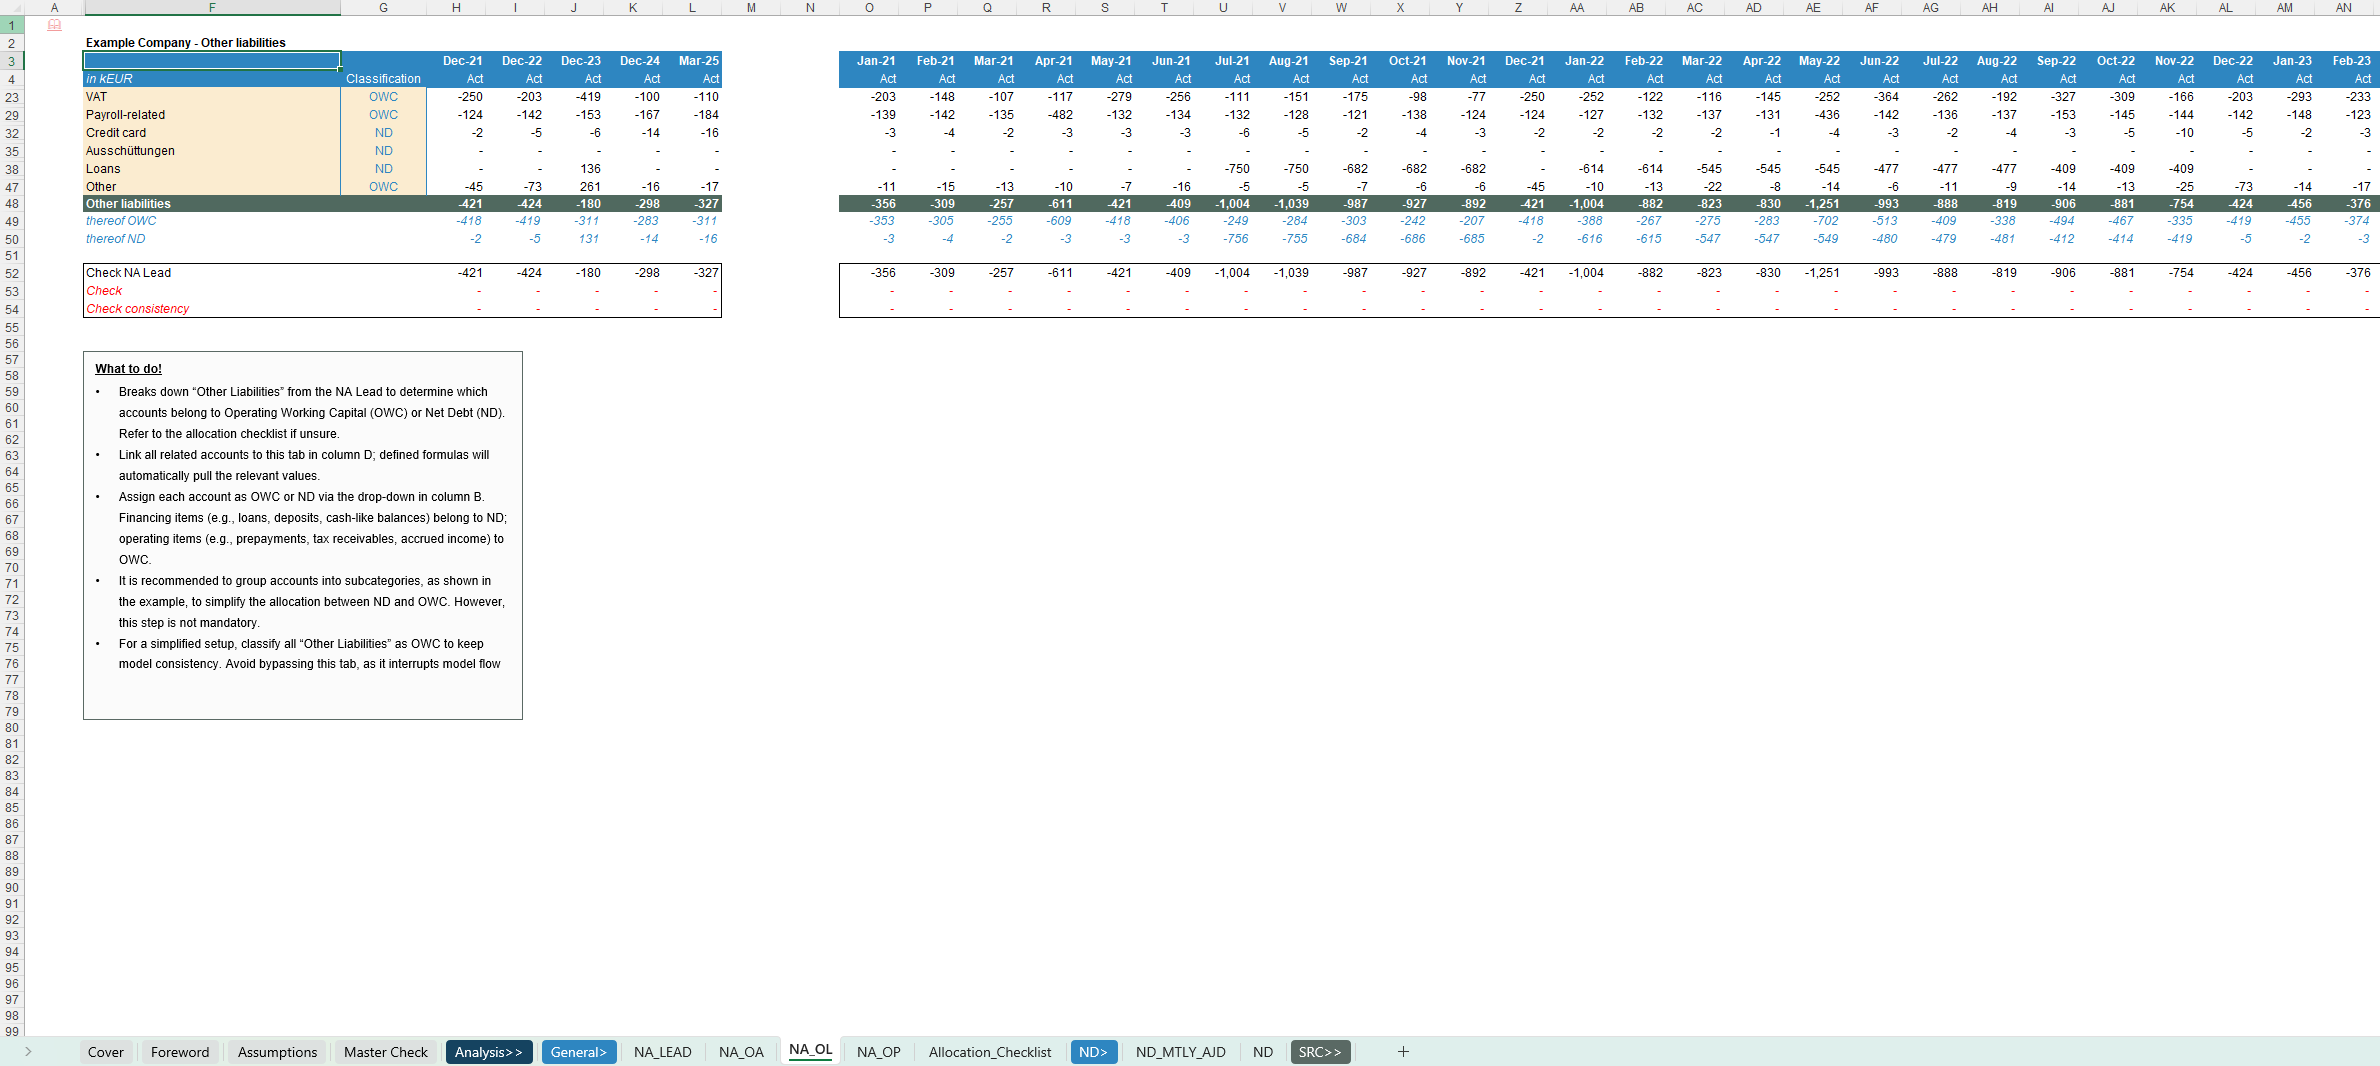
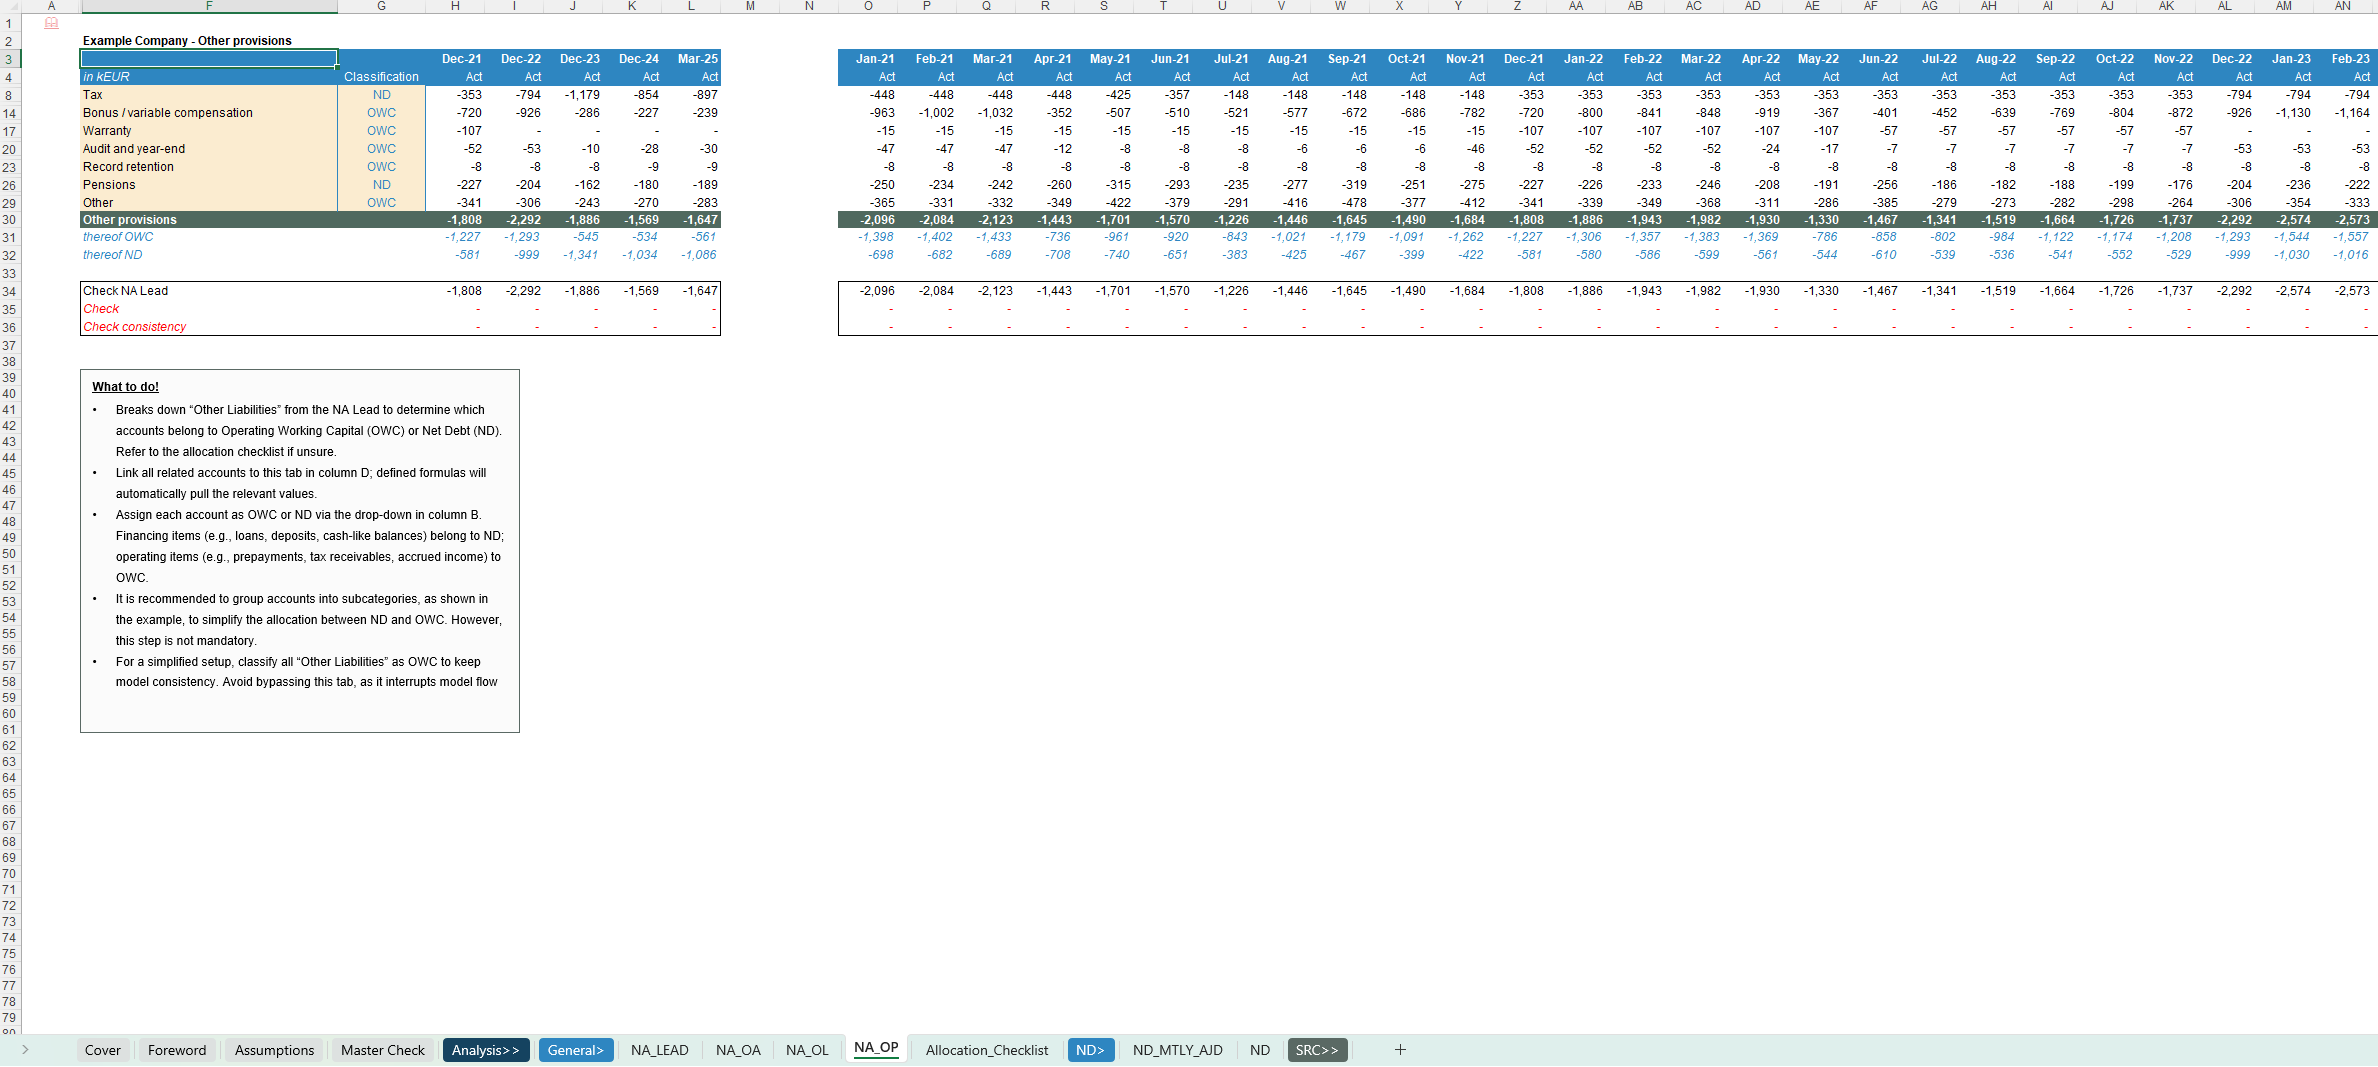
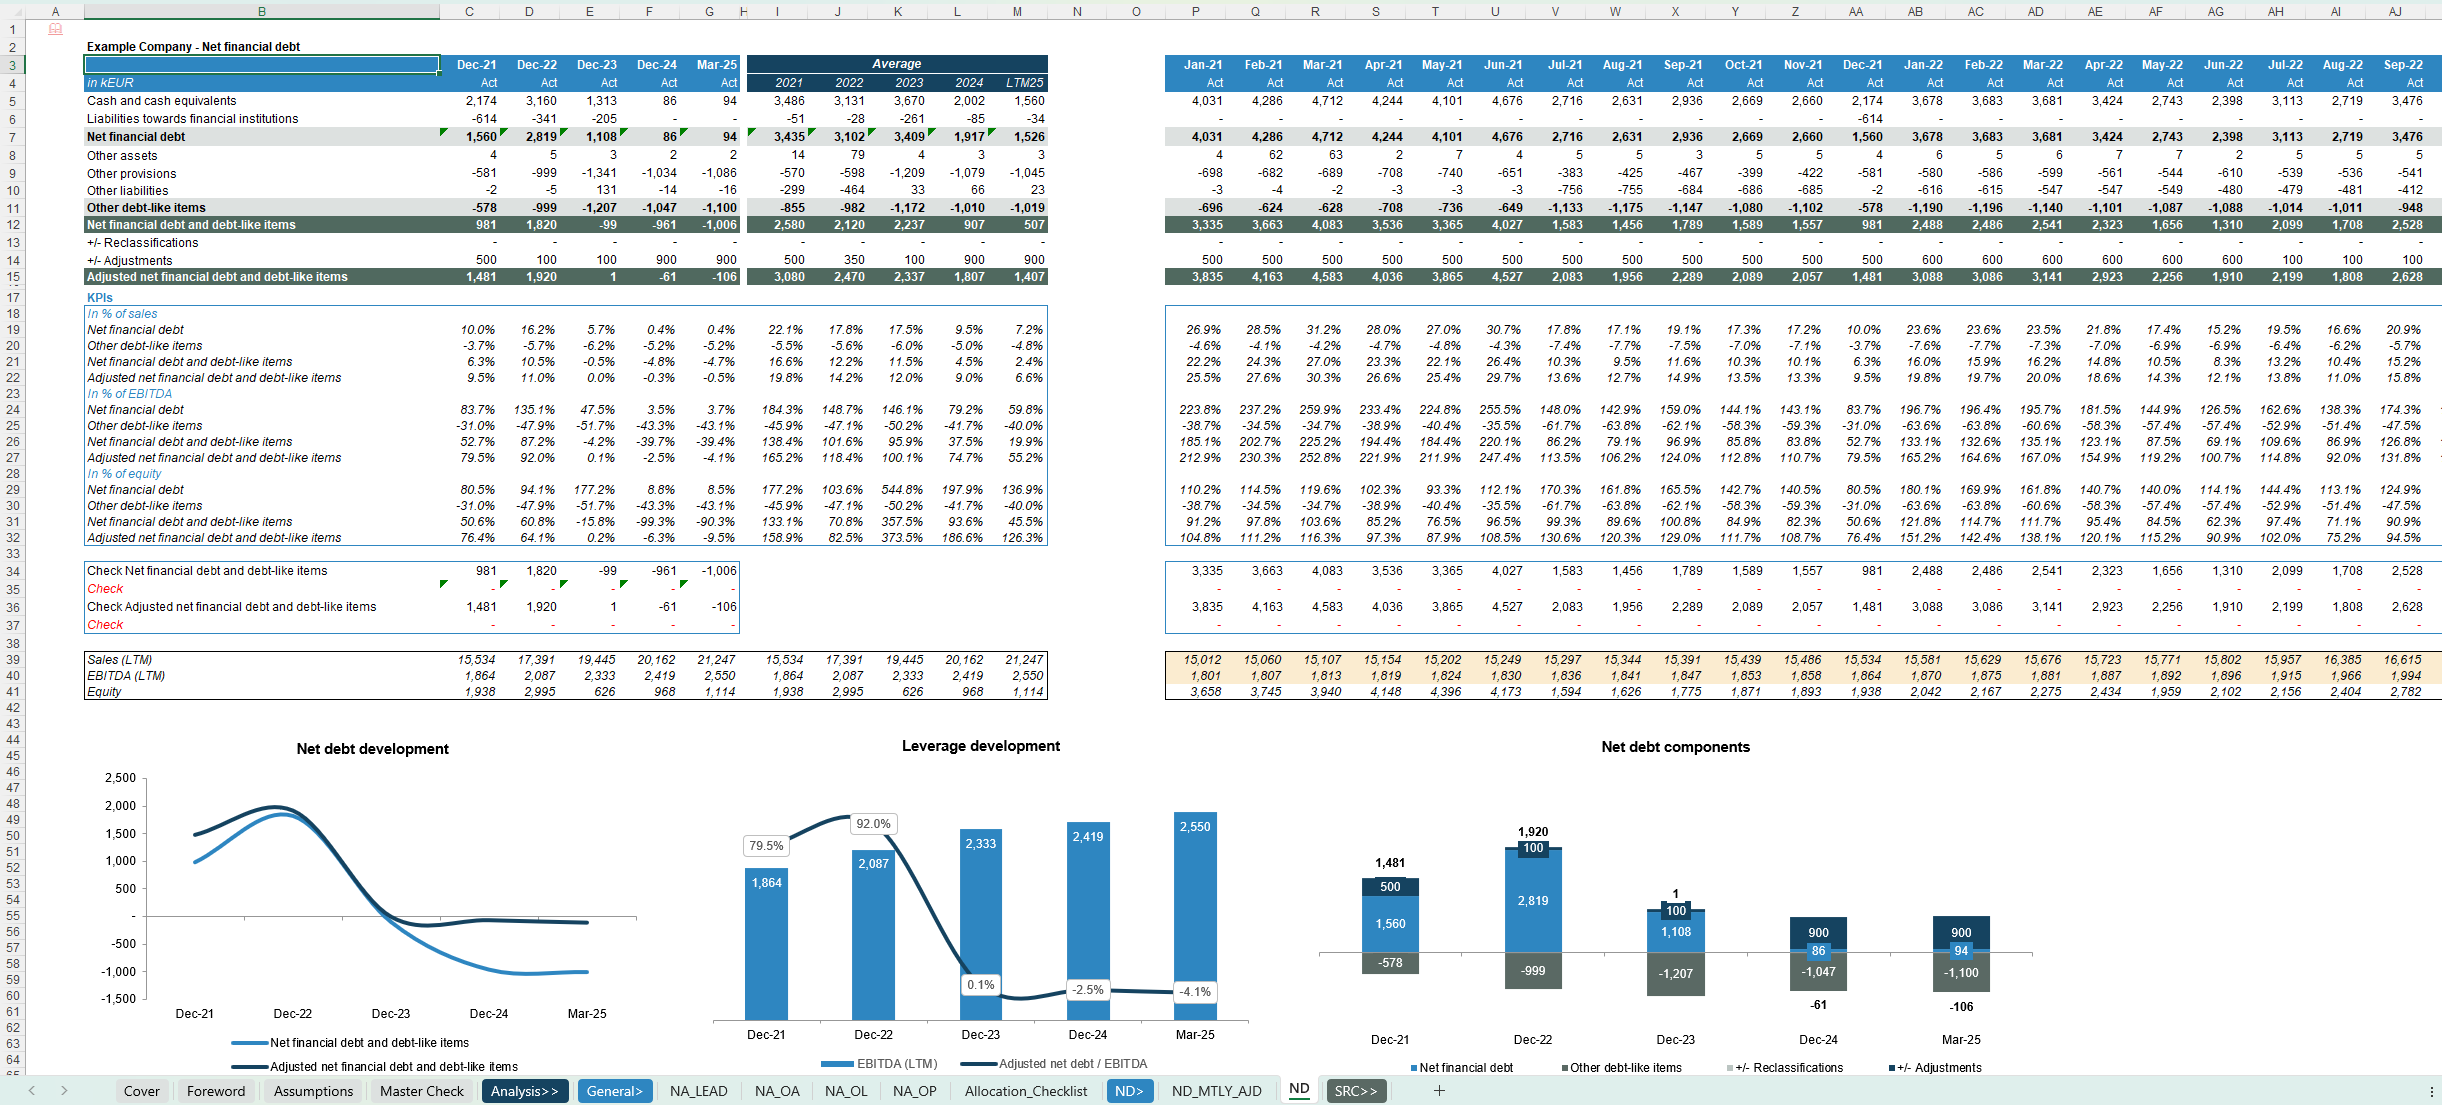
This Excel-based Net Debt Analysis Model provides a structured, transparent view of a company’s net financial debt and debt-like items over time. It reconciles balance sheet positions, separates Operating Working Capital from Net Debt, and aggregates all relevant cash, financial liabilities and other debt-like items into a clear, audit-friendly framework.
The model enables you to analyse reported and pro-forma adjusted Net Debt, understand the composition of gross debt and cash positions, and quantify leverage through key ratios such as Net Debt / EBITDA or Adjusted Net Debt / EBITDA. Dedicated mapping and adjustment areas help you reflect refinancing effects, carve-outs, shareholder loans or other transaction-specific items consistently and traceably.
The tool is particularly useful for Transaction Services, financing / refinancing projects, covenant analysis and factbook preparation, but can also be applied in internal reporting, lender communication and recurring leverage monitoring.
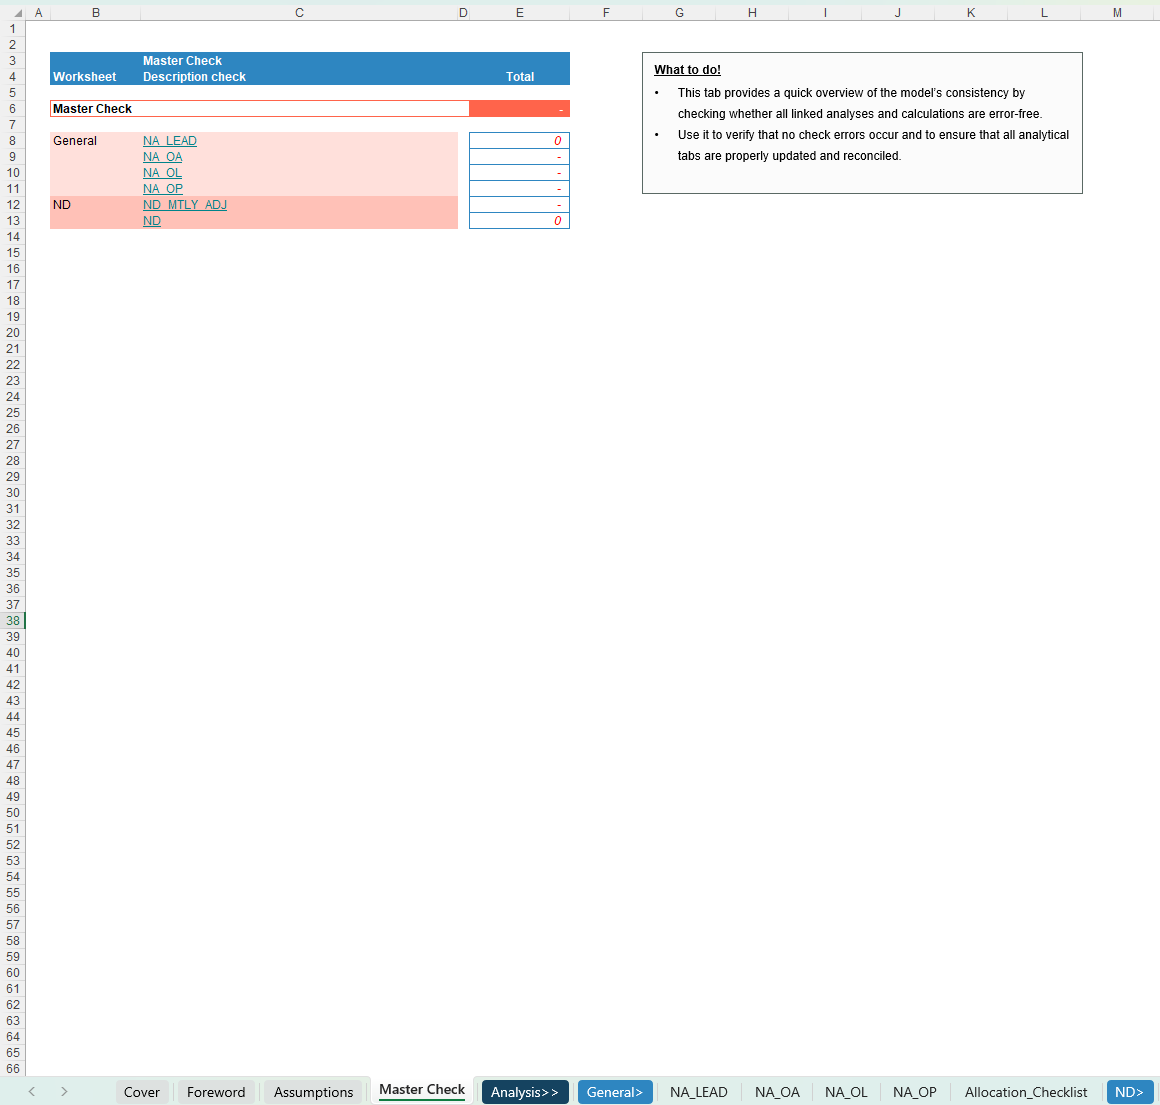
Each sheet includes a short “What to do / What to know” box with practical instructions, so you always know exactly what is expected on that tab and how it feeds into the overall model.
Key Outputs
Key Inputs & Assumptions
How to use
Customization & support
The model is highly customisable – you can easily adapt categories, labels, KPIs and charts to your specific chart of accounts, lender definitions of Net Debt or internal reporting standards. For more complex customisations or individual requirements (e.g. firm-specific versions, integration into broader workbooks or additional covenant modules), feel free to reach out and we can discuss a tailored solution.
Each download includes both a fully blank “Clean Template” for working directly with your own data and a pre-populated Example Template that illustrates the model’s logic and calculations using realistic sample data.
If you want to cover the full analysis scope – from Earnings/QoE and Working Capital to Net Debt plus Sales and customer analytics – you may also want to have a look at the “Transaction Services All-in-One Financial Analysis Workbook.”
The screenshots provide a good first impression of the model, but they do not fully capture all functionalities and details—if you have any questions or would like to better understand specific features, feel free to reach out anytime.
NOTE: This is the demo (protected) version of the model. You can get access to the UNLOCKED version of the model via: https://www.eloquens.com/tool/4M7Viv2d/finance/debt-schedule-financial-excel-models/corporate-finance-net-debt-analysis-model
Purpose of the tool
This Excel-based Net Debt Analysis Model provides a structured, transparent view of a company’s net financial debt and debt-like items over time. It reconciles balance sheet positions, separates Operating Working Capital from Net Debt, and aggregates all relevant cash, financial liabilities and other debt-like items into a clear, audit-friendly framework.
The model enables you to analyse reported and pro-forma adjusted Net Debt, understand the composition of gross debt and cash positions, and quantify leverage through key ratios such as Net Debt / EBITDA or Adjusted Net Debt / EBITDA. Dedicated mapping and adjustment areas help you reflect refinancing effects, carve-outs, shareholder loans or other transaction-specific items consistently and traceably.
The tool is particularly useful for Transaction Services, financing / refinancing projects, covenant analysis and factbook preparation, but can also be applied in internal reporting, lender communication and recurring leverage monitoring.
Each sheet includes a short “What to do / What to know” box with practical instructions, so you always know exactly what is expected on that tab and how it feeds into the overall model.
Key Outputs
- Net Debt overview with cash & cash equivalents, financial liabilities and other debt-like items
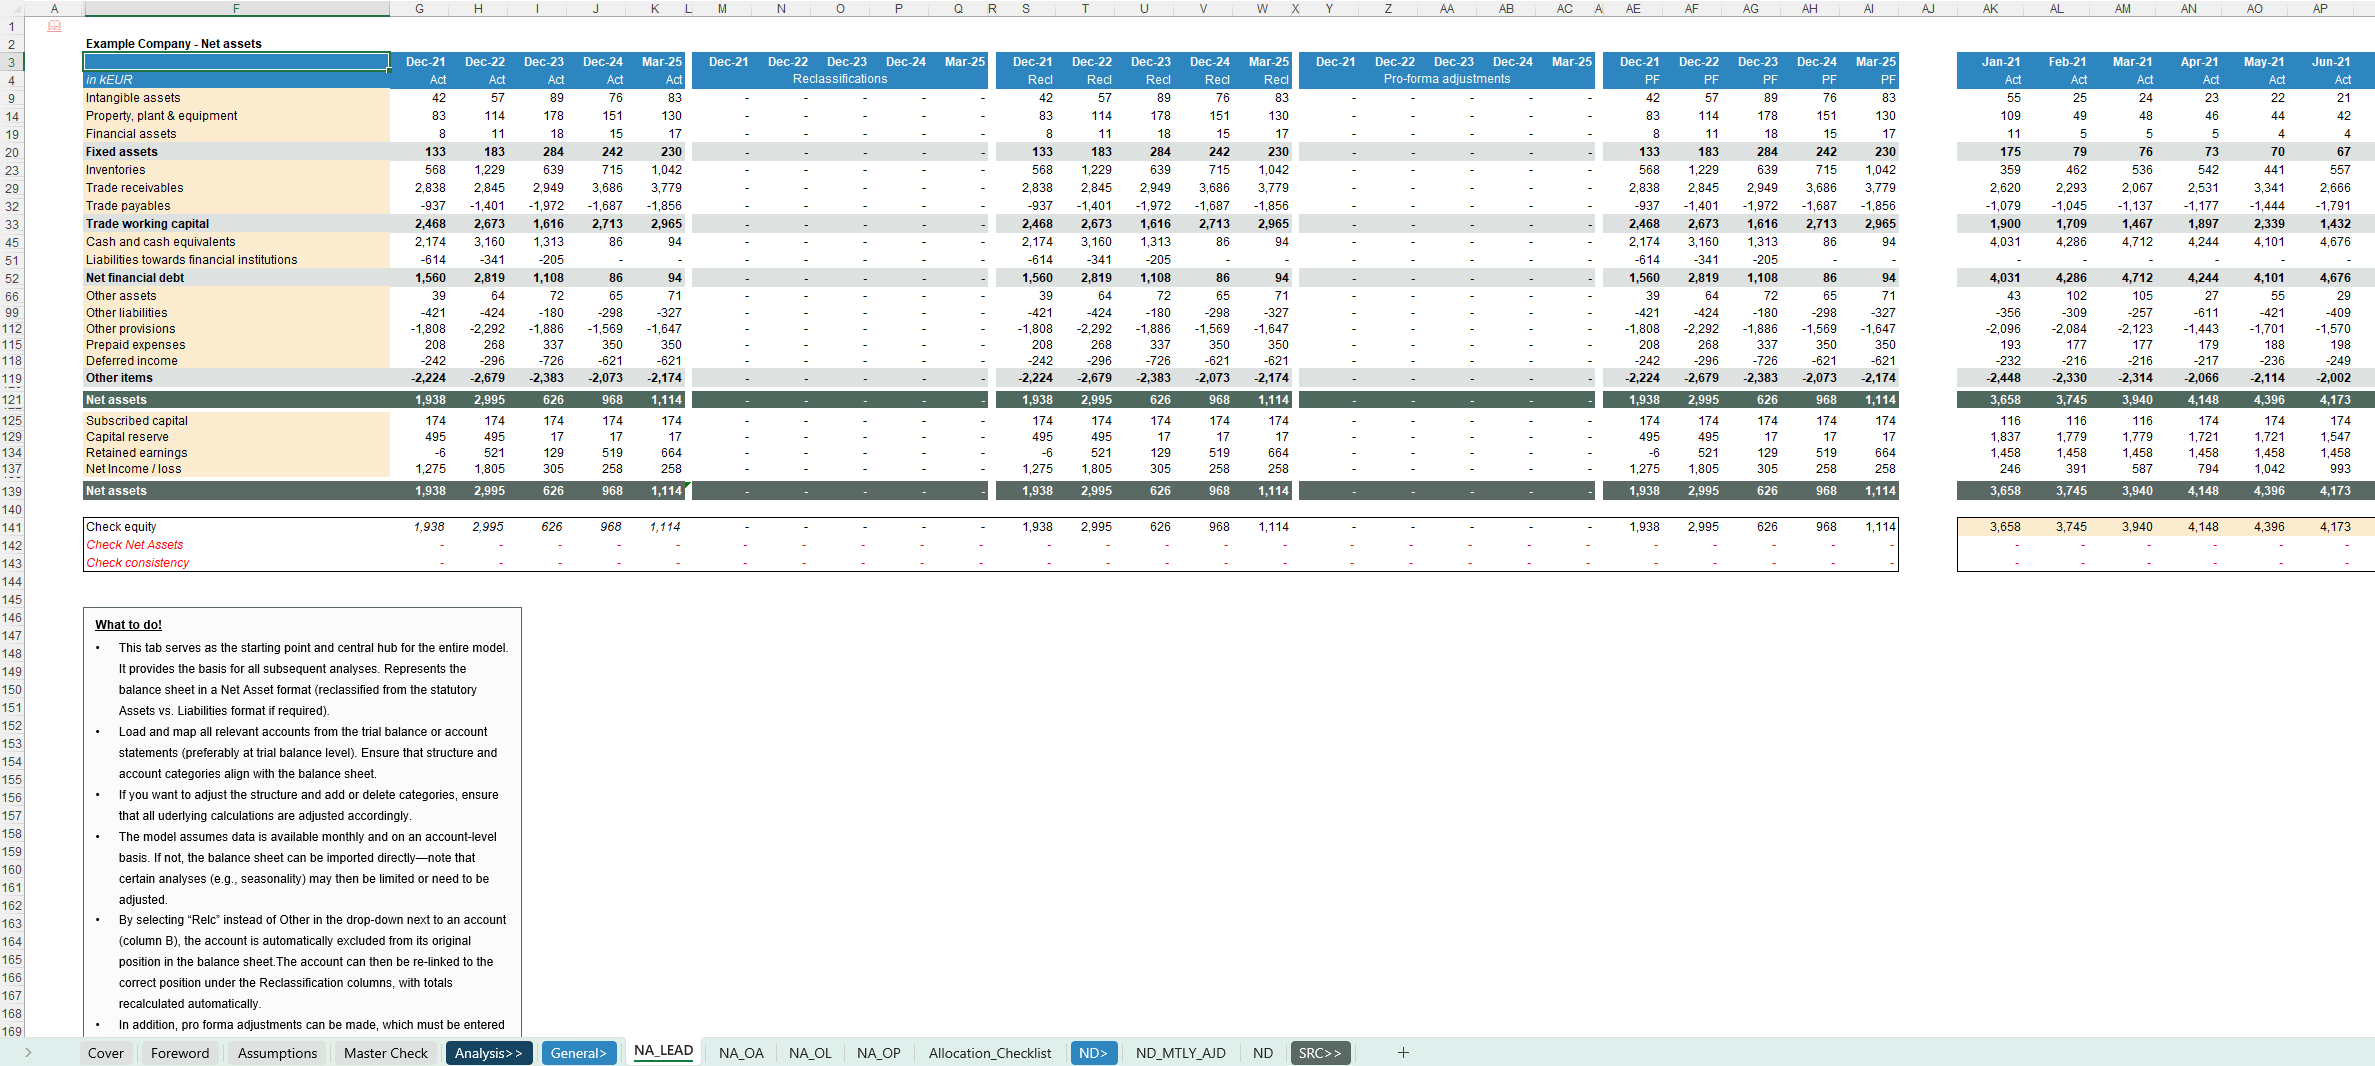
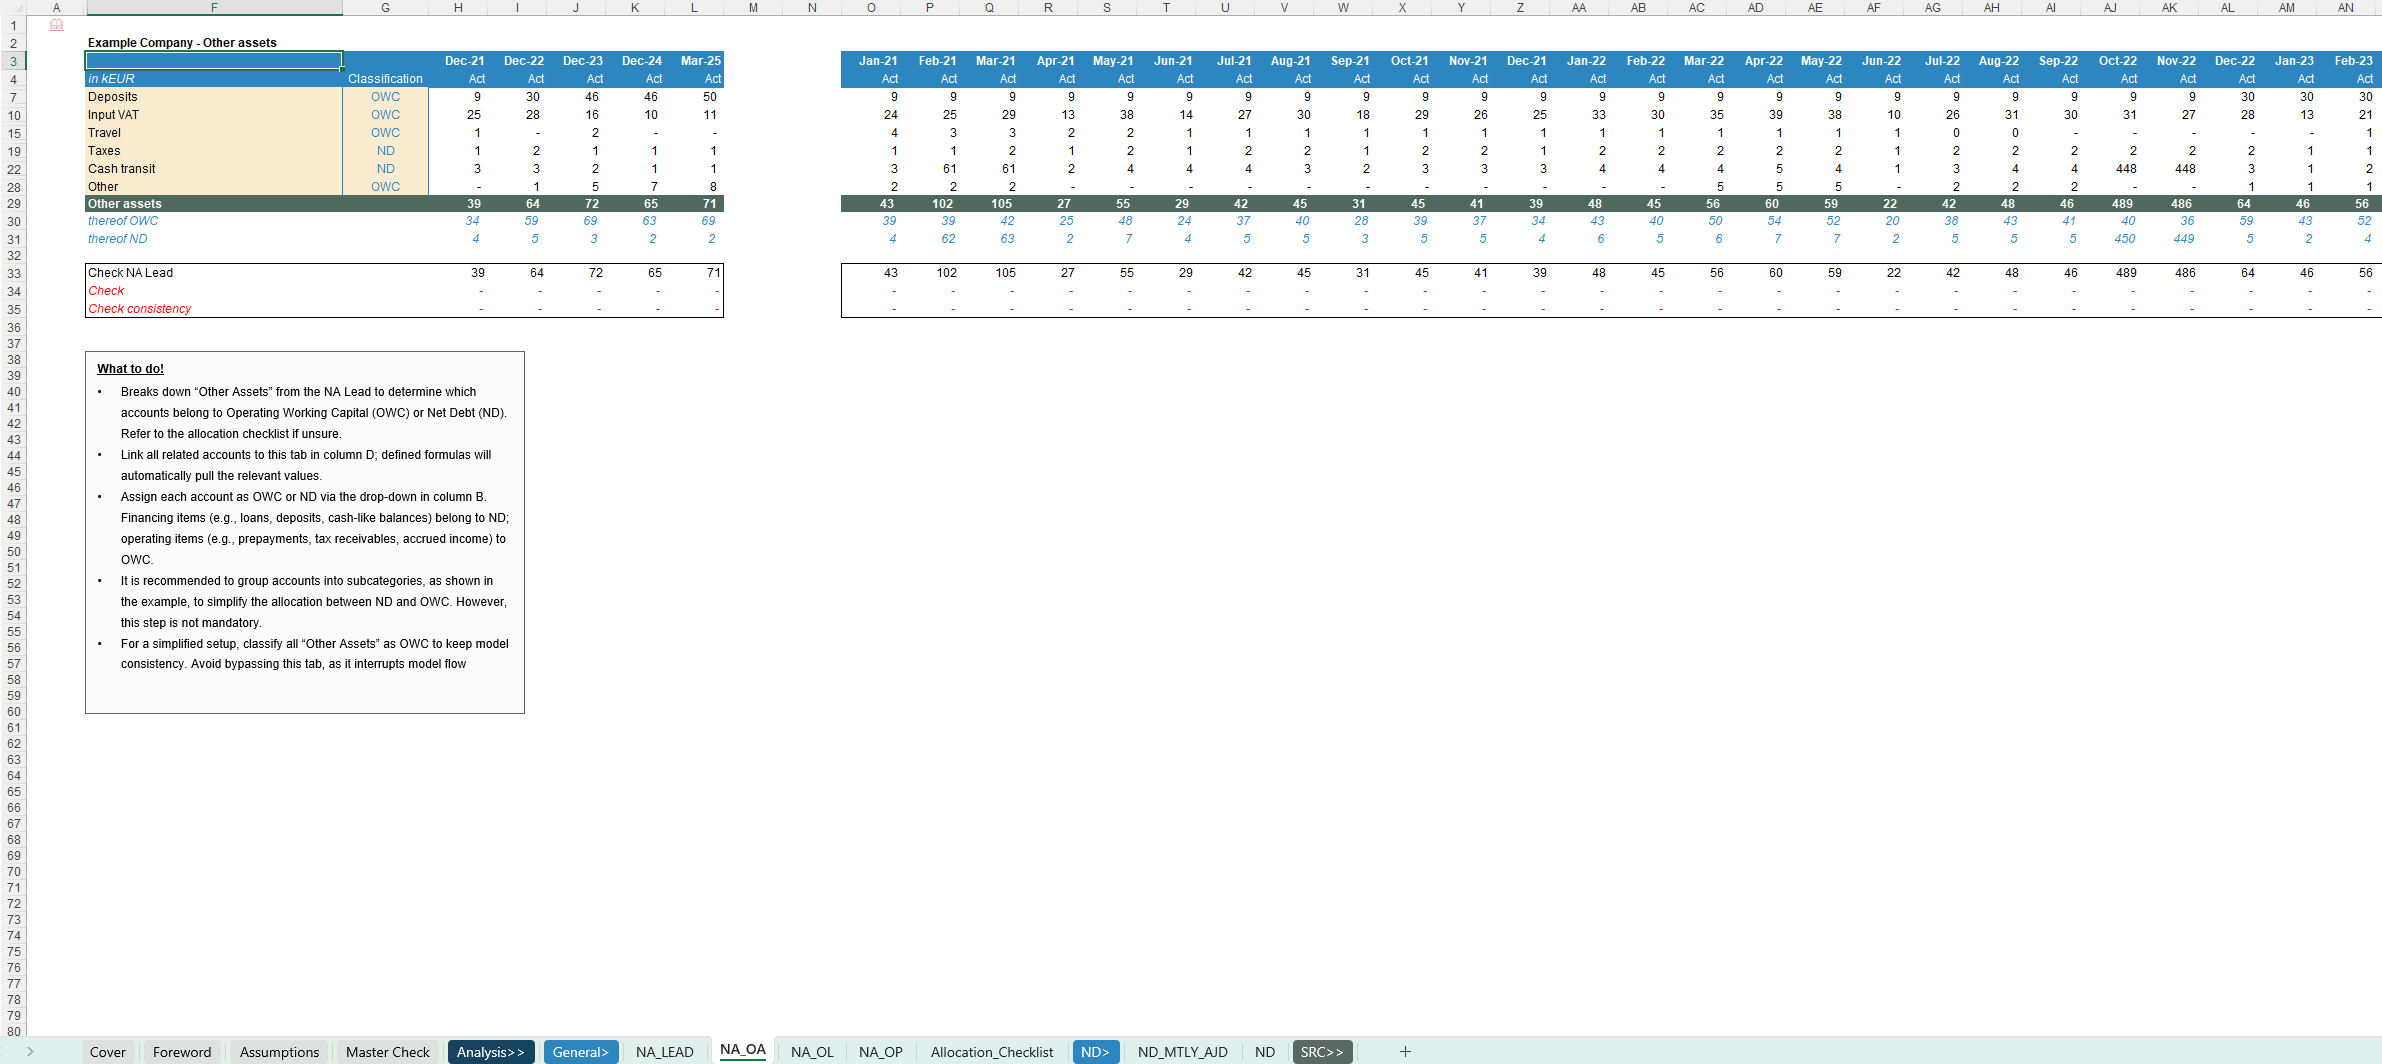
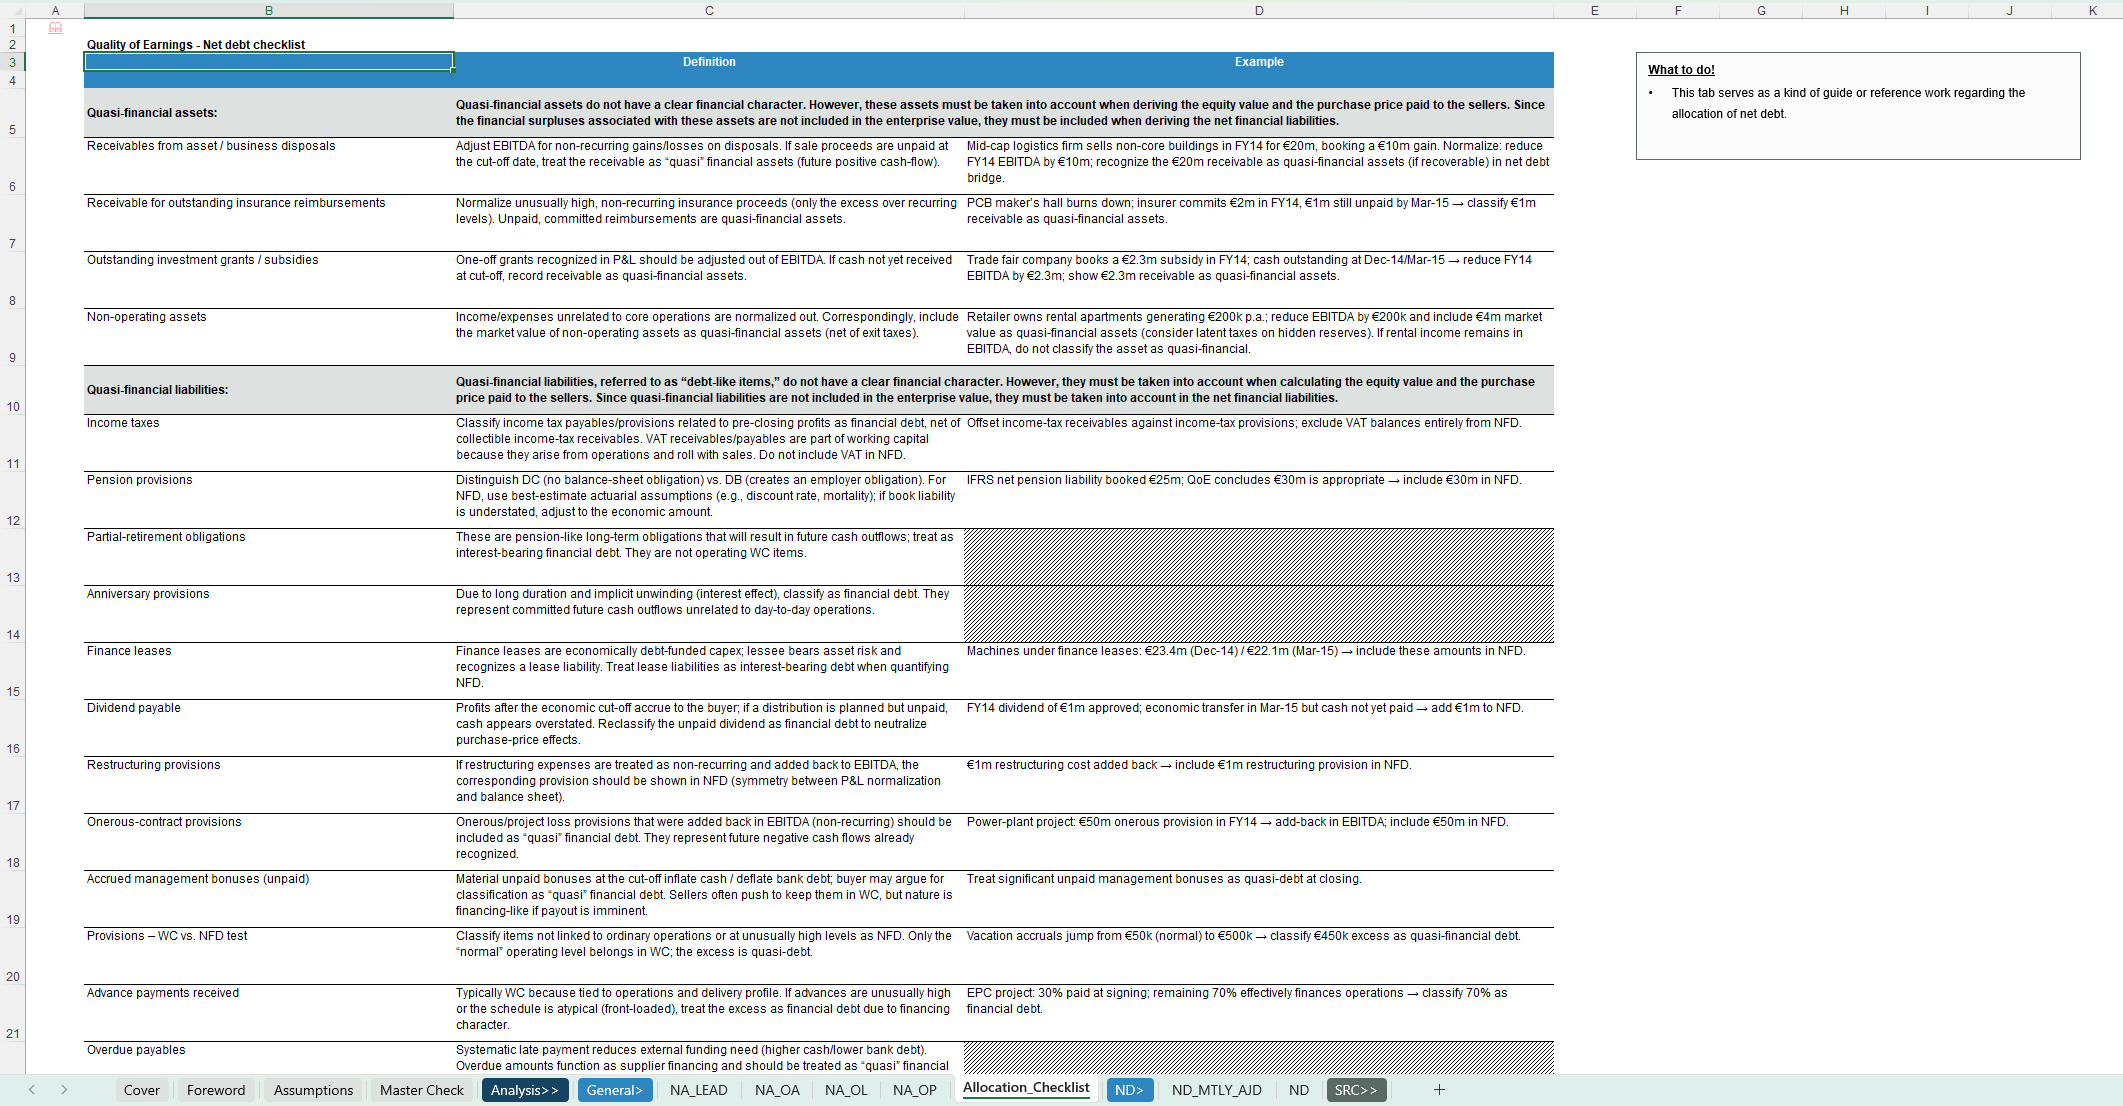
- Clear allocation of balance sheet items to Operating Working Capital vs. Net Debt / debt-like items
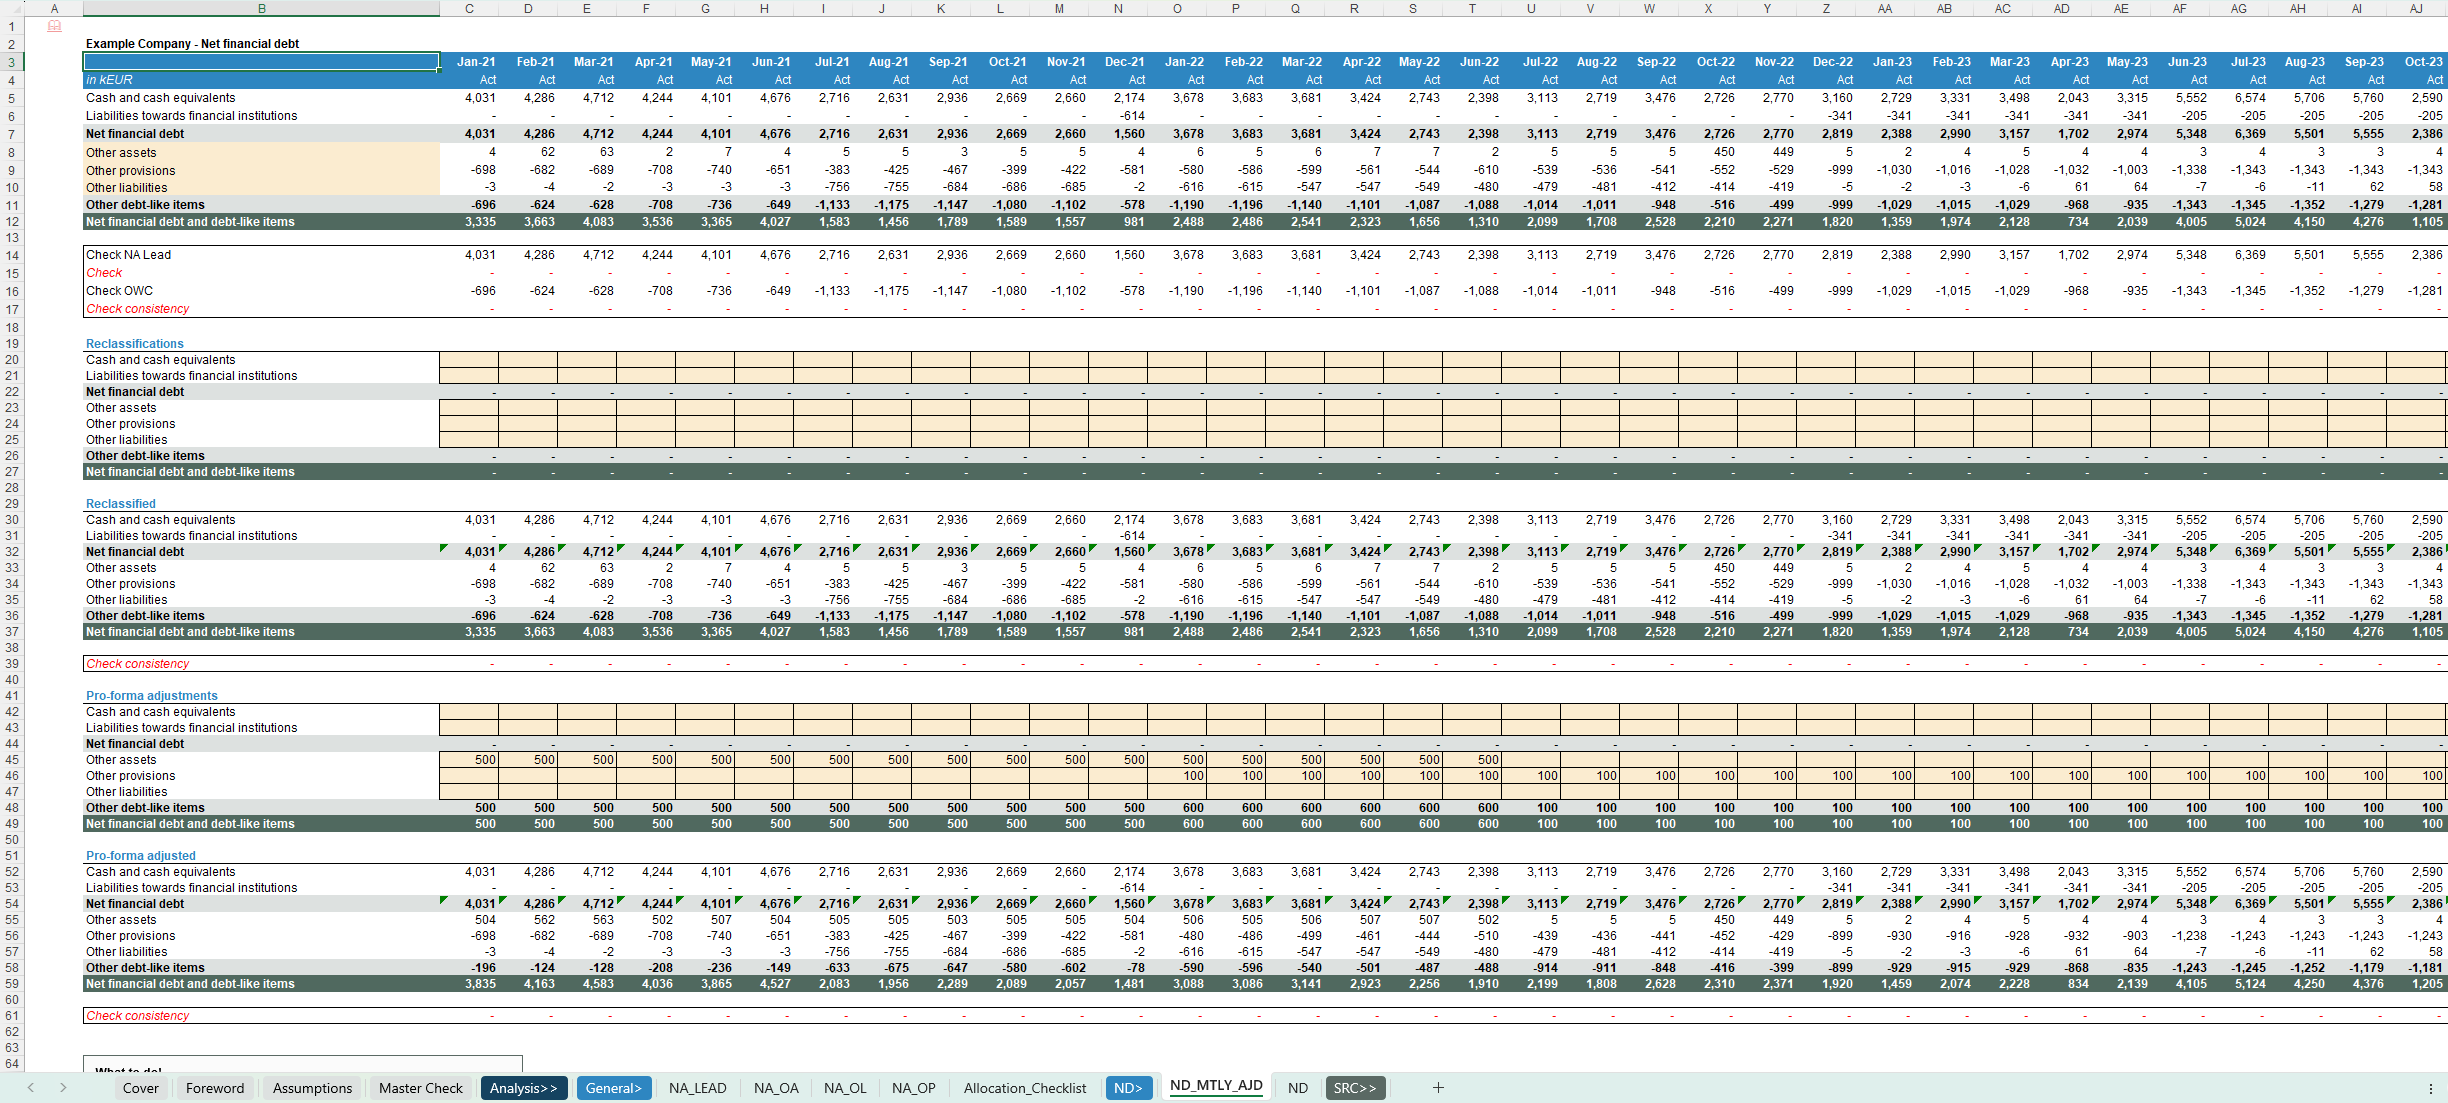
- Reported vs. pro-forma adjusted Net Debt, including specific transaction and structure-related adjustments
- Leverage KPIs such as Net Debt, Adjusted Net Debt, Net Debt / EBITDA, Adjusted Net Debt / EBITDA and Net Debt / equity
- Charts and tables showing Net Debt development, composition and leverage trends over time
Key Inputs & Assumptions
- Trial balance / balance sheet data, ideally at account level and by period
- Mapping of accounts to Net Debt categories and OWC vs. Net Debt via simple dropdowns or checklists
- Pro-forma and monthly adjustment entries for cash, financial liabilities and other debt-like items
- EBITDA, sales and equity figures for leverage and relative KPIs
How to use
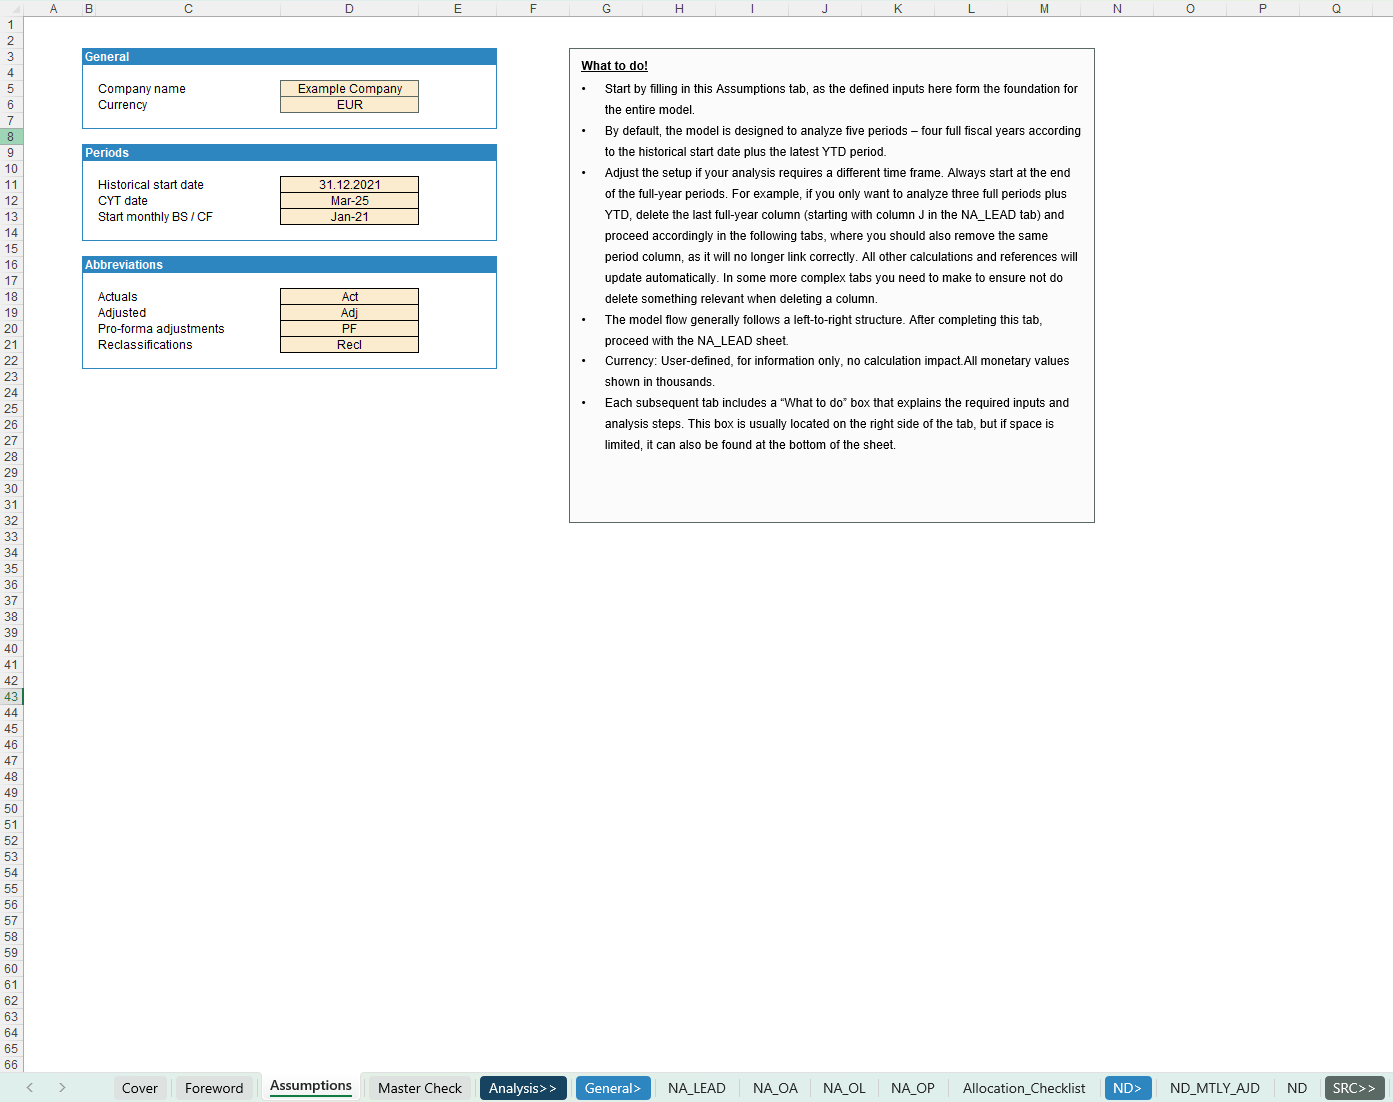
- Define core parameters (reporting periods, currency, basic options) in the Assumptions sheet.
- Load balance sheet / trial balance data into the lead and Net Asset mapping tabs and classify accounts as Operating Working Capital or Net Debt / debt-like.
- Enter any relevant pro-forma and monthly adjustments and review the Net Debt overview and KPI tabs to analyse level, structure and development of Net Debt and leverage.
Customization & support
The model is highly customisable – you can easily adapt categories, labels, KPIs and charts to your specific chart of accounts, lender definitions of Net Debt or internal reporting standards. For more complex customisations or individual requirements (e.g. firm-specific versions, integration into broader workbooks or additional covenant modules), feel free to reach out and we can discuss a tailored solution.
Each download includes both a fully blank “Clean Template” for working directly with your own data and a pre-populated Example Template that illustrates the model’s logic and calculations using realistic sample data.
If you want to cover the full analysis scope – from Earnings/QoE and Working Capital to Net Debt plus Sales and customer analytics – you may also want to have a look at the “Transaction Services All-in-One Financial Analysis Workbook.”
The screenshots provide a good first impression of the model, but they do not fully capture all functionalities and details—if you have any questions or would like to better understand specific features, feel free to reach out anytime.
This Best Practice includes
1 Excel File
Further information
Deliver an FDD workbook for Transaction Services enabling clear Net Debt analysis, key driver insights and a comprehensive view for DD factbooks.
