Publication number: ELQ-15954-1
View all versions & Certificate

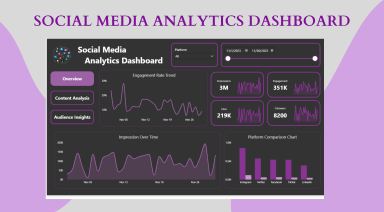
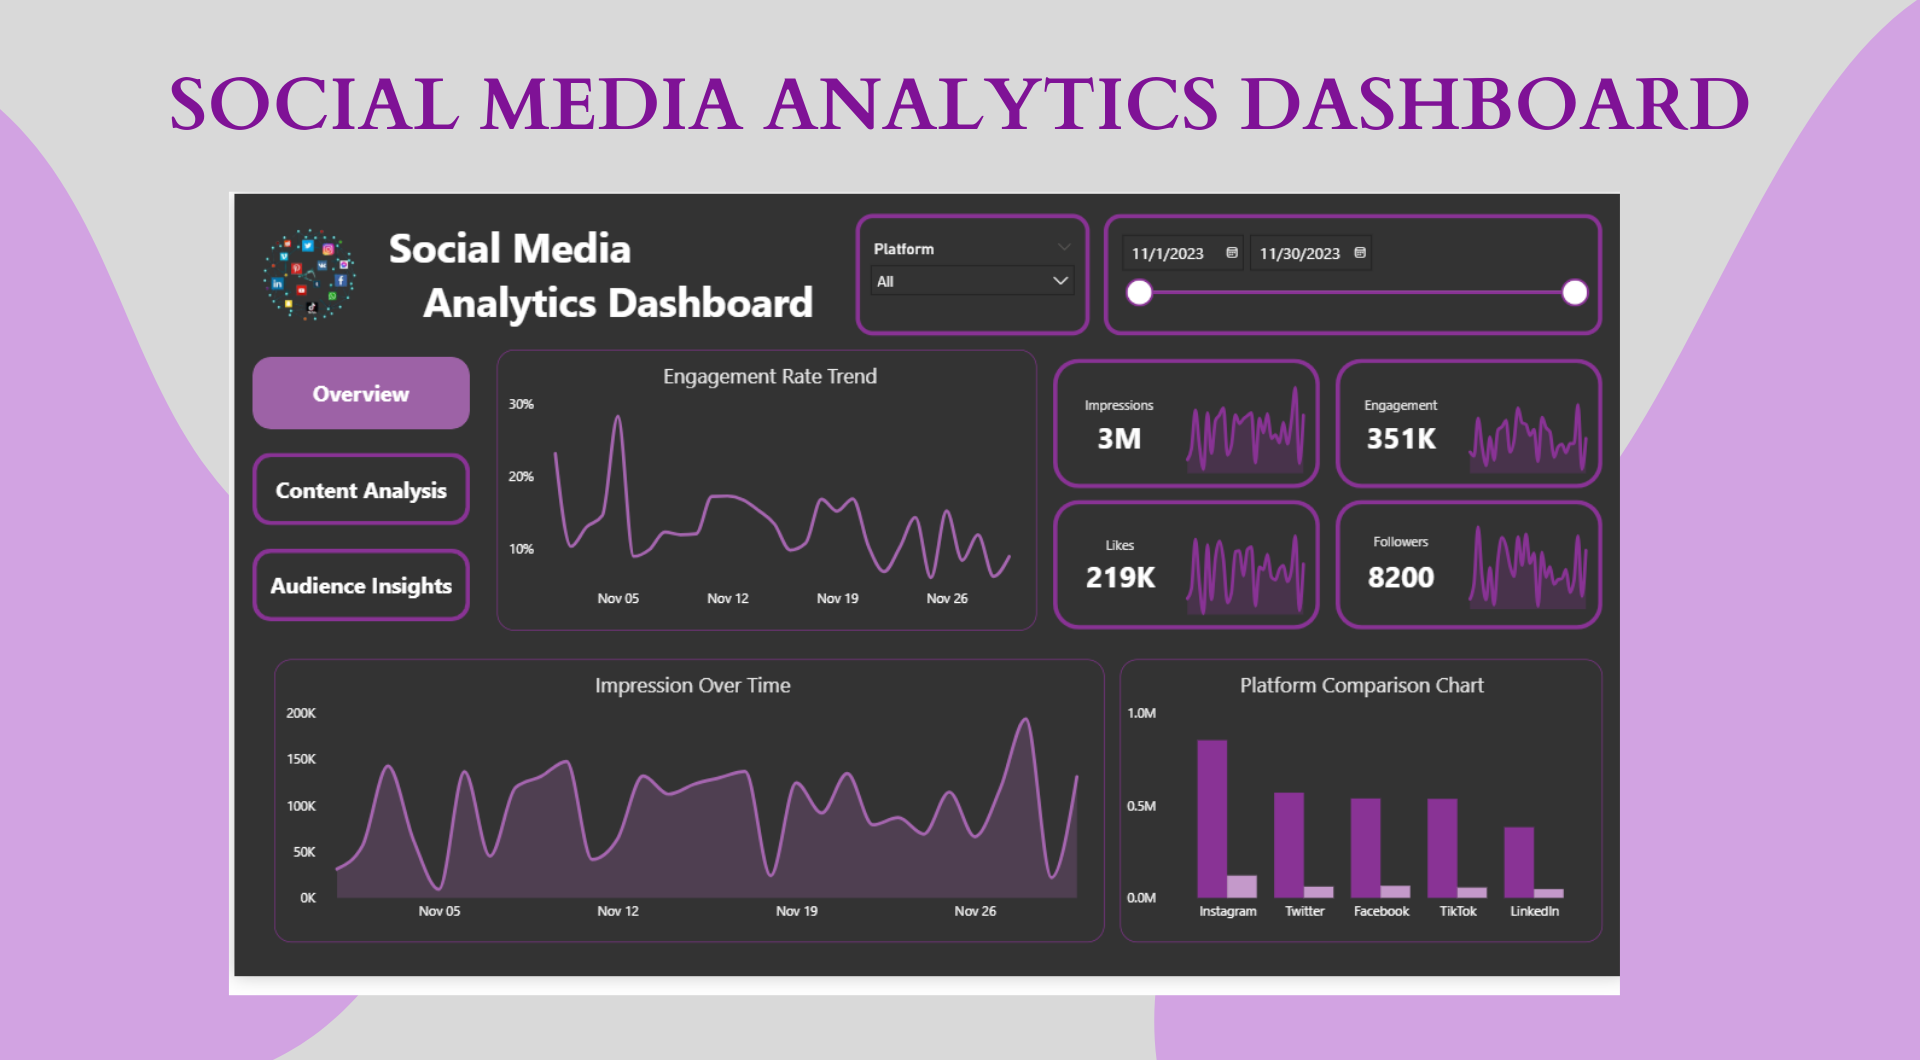
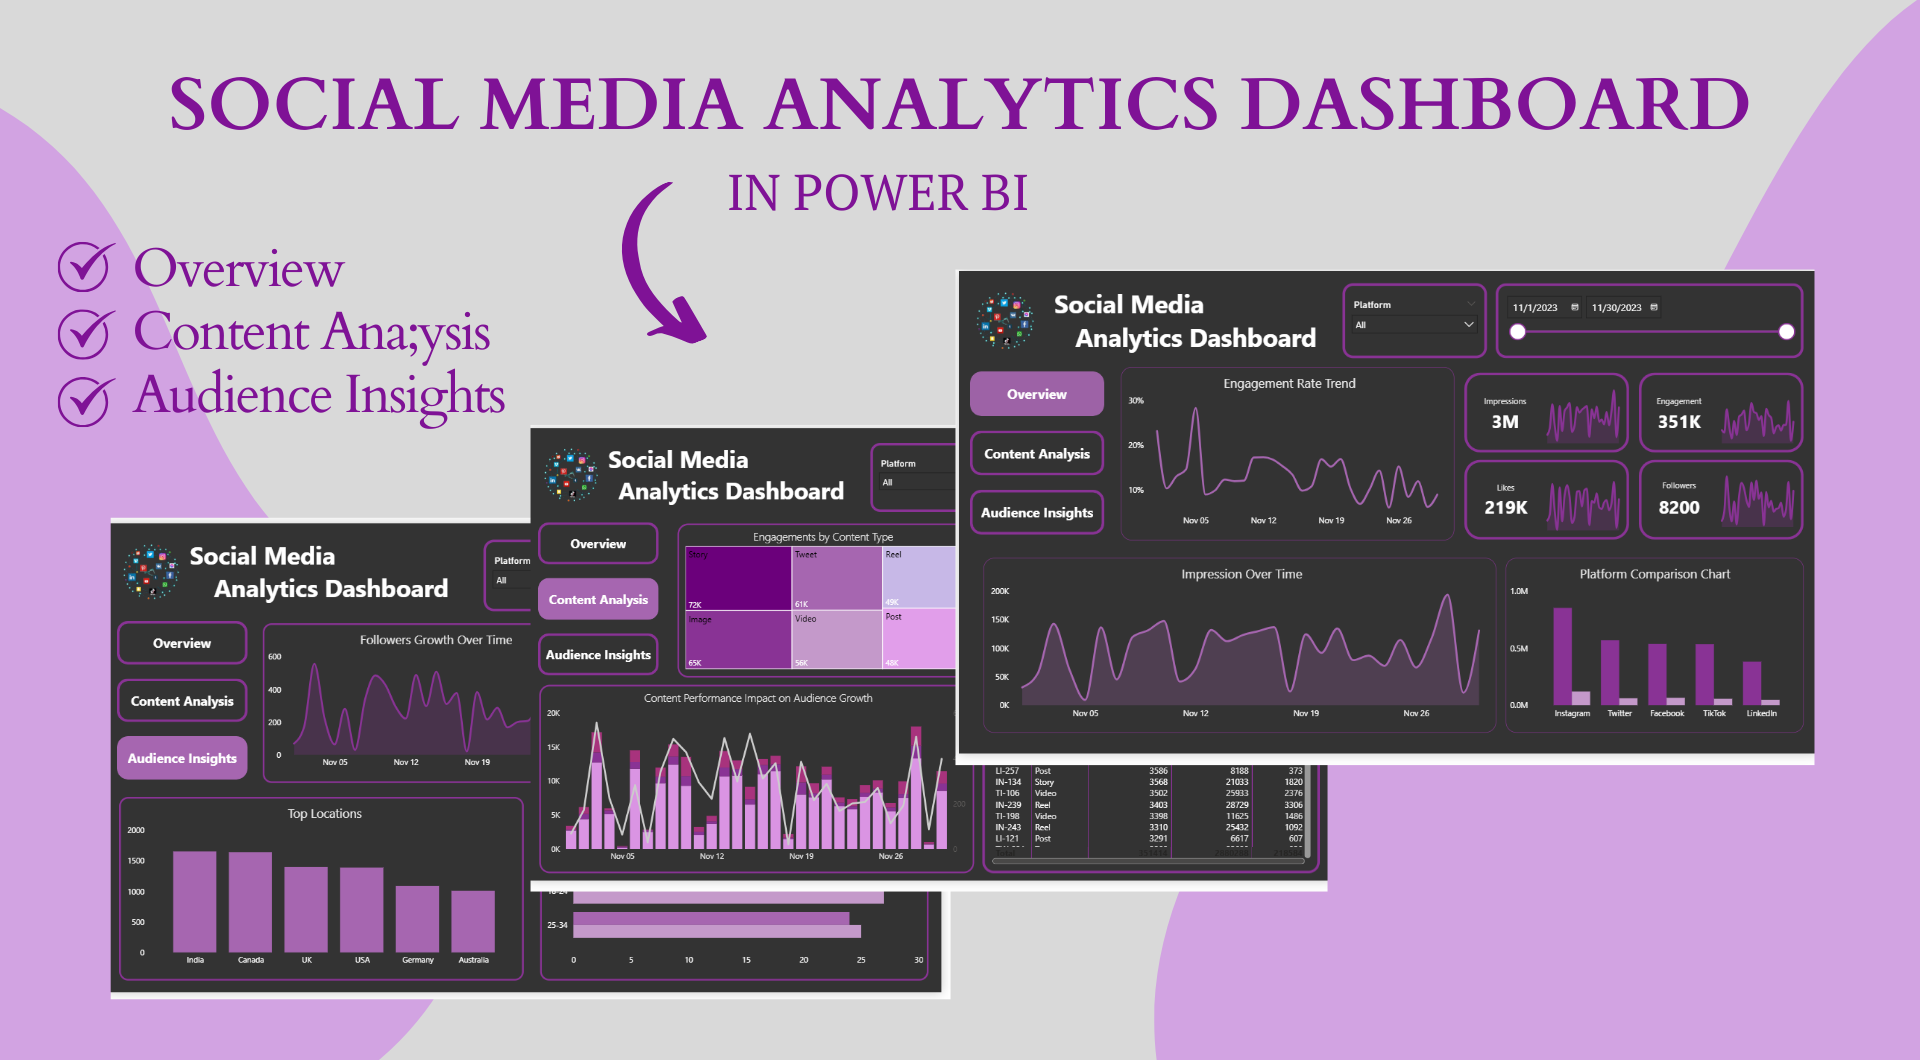
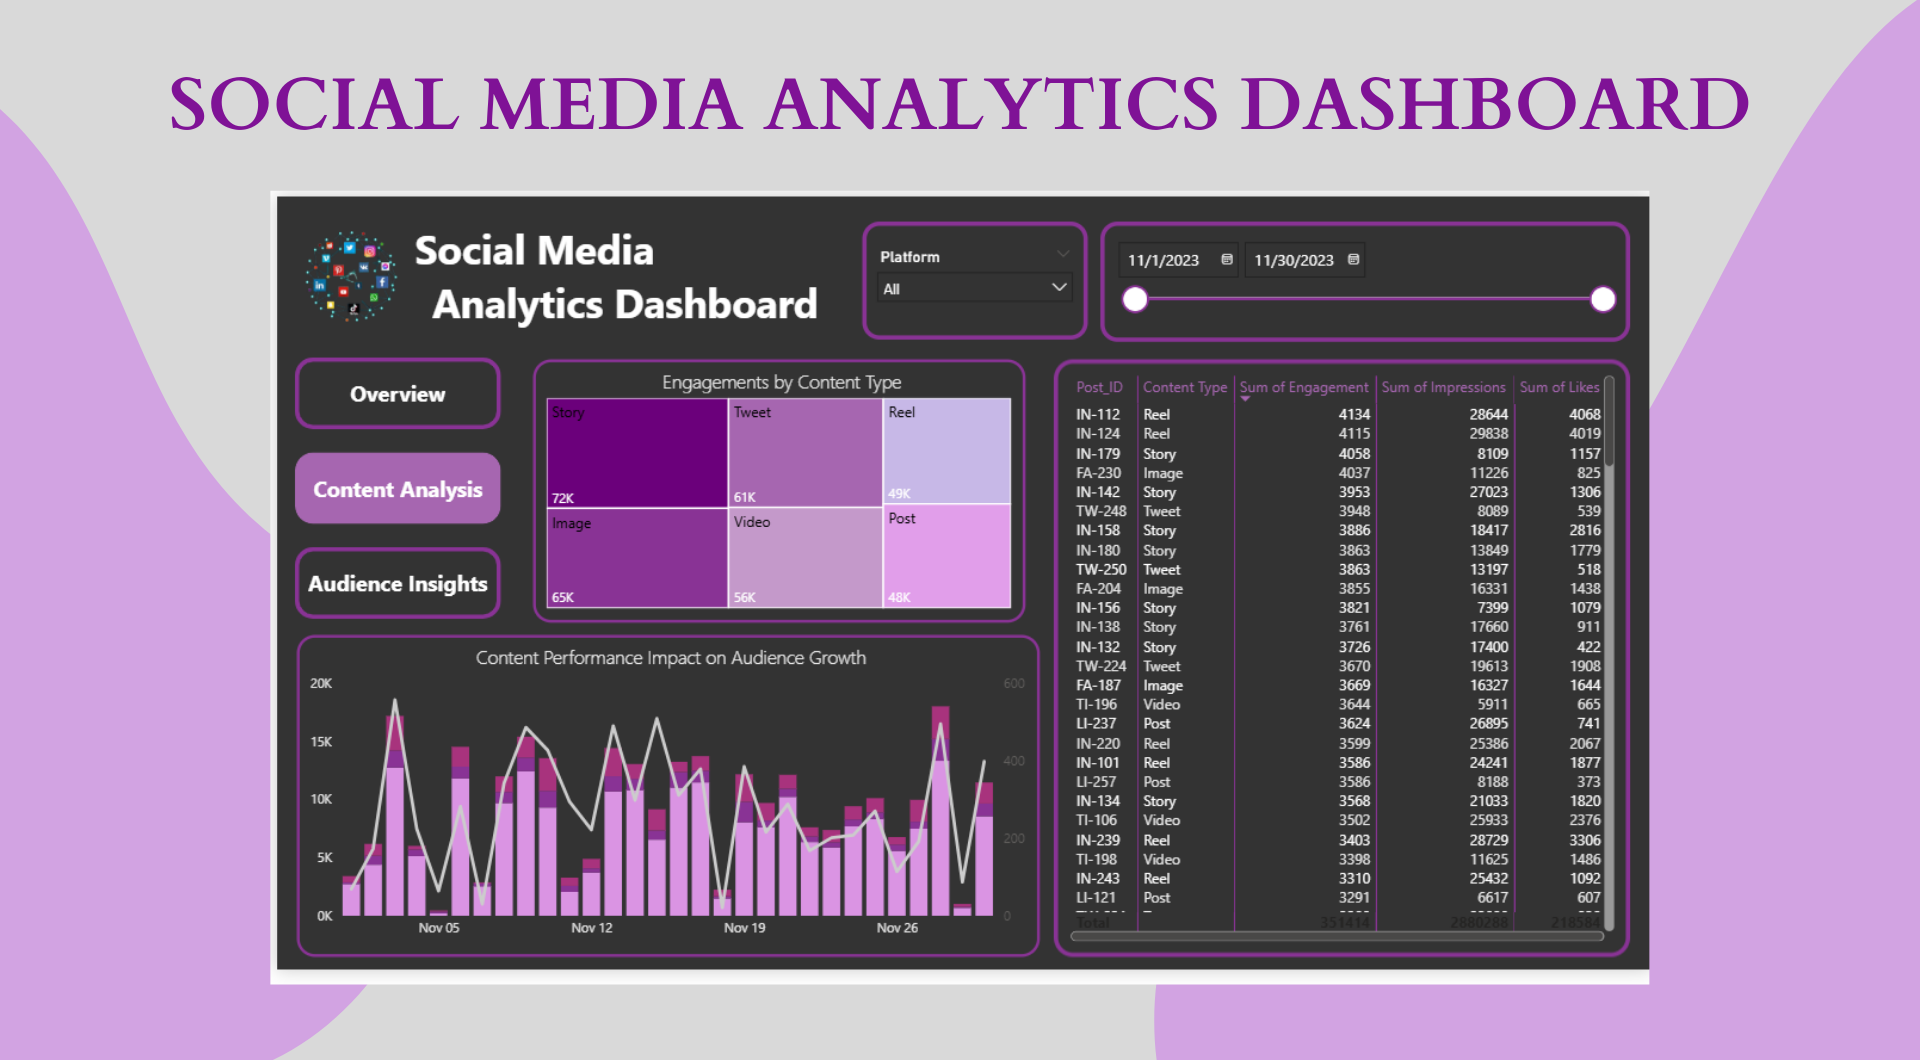
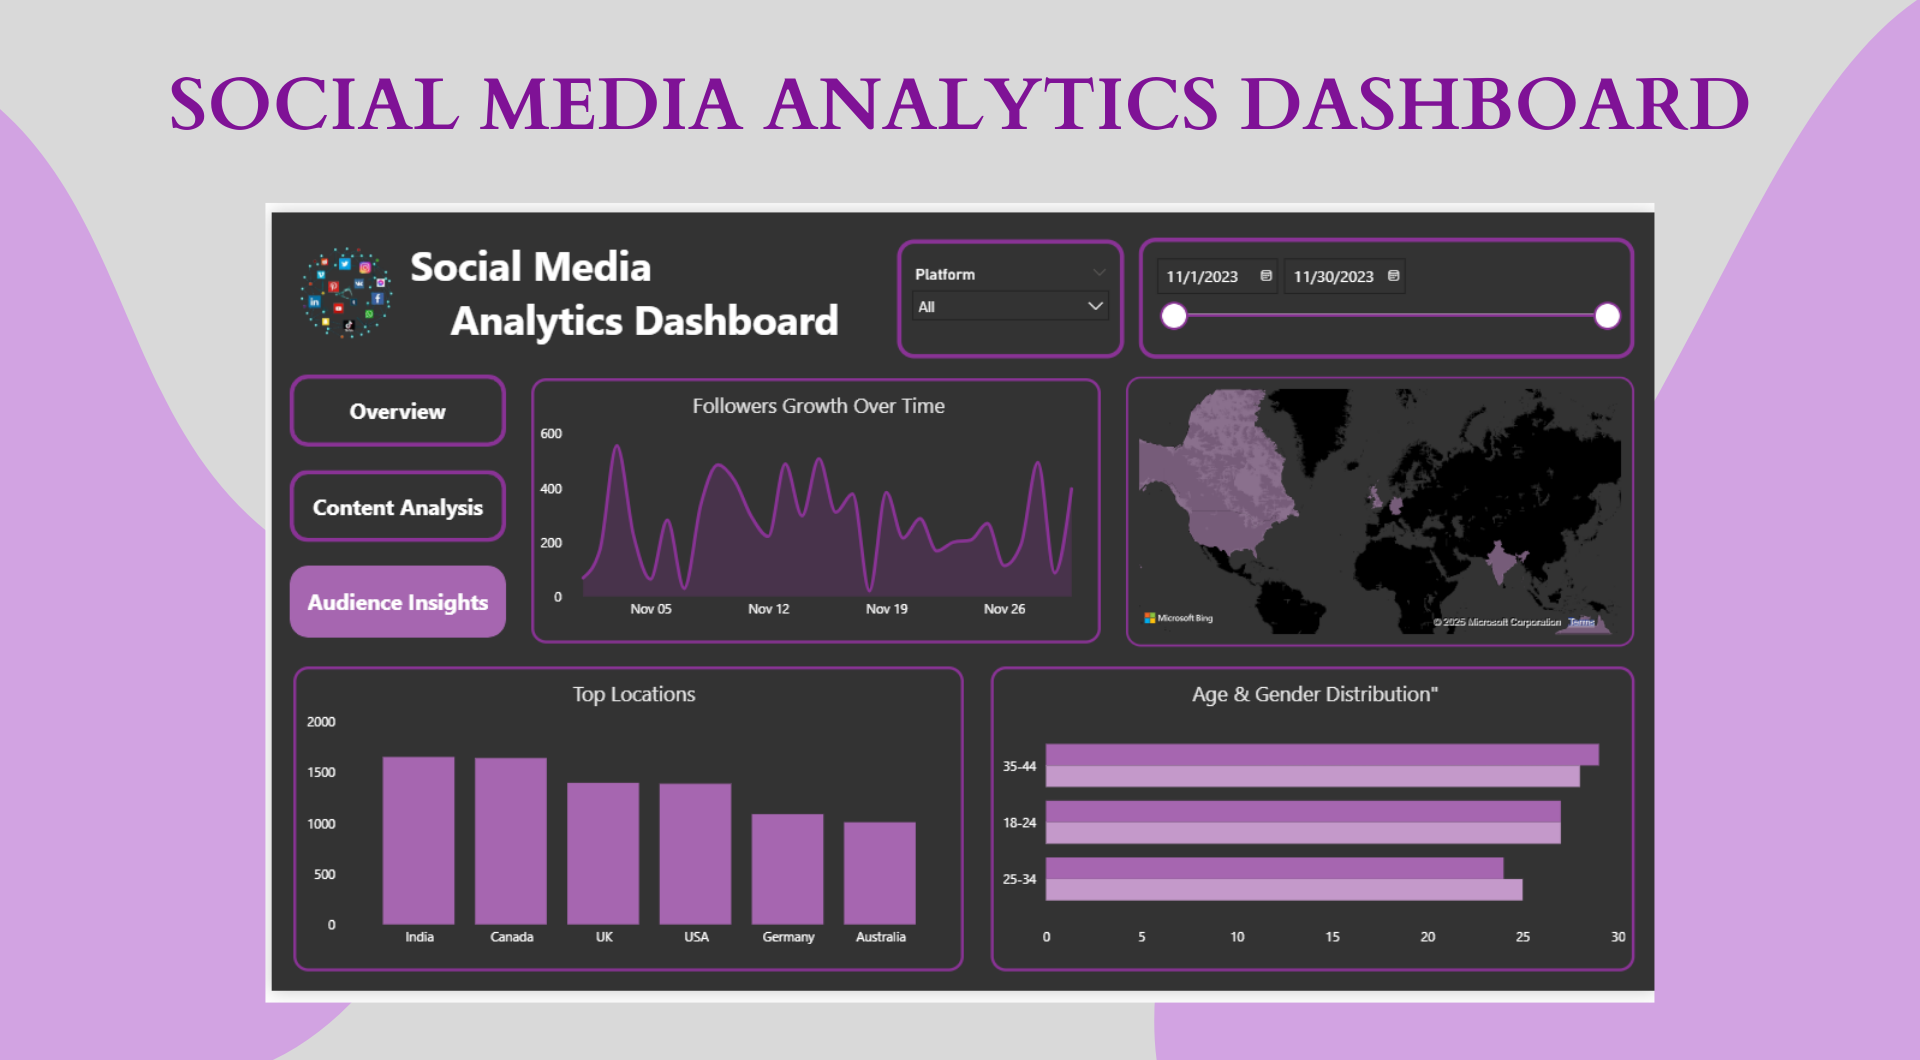
3-Page Dynamic Social Media Dashboard | Power BI | Ready-to-Use
A sleek, modern, and fully dynamic Power BI dashboard designed to track and visualize your social media performance across LinkedIn, TikTok, Facebook, and more.
 by Hadia Safdar
Data Analyst | Excel, Power BI, Python, SQL Expert | Turning Data into Decisions | Business AnalystFollow
Further information
Automate & Visualize: Transform raw social media export data into a dynamic, single-source-of-truth dashboard.
Identify Performance Drivers: Quickly pinpoint top-performing content, optimal posting times, and high-value audience segments.
Standardize Reporting: Create a consistent, client-ready reporting format that saves hours of manual work per month.
Make Data-Driven Decisions: Move from guessing to knowing what content and strategies actually work.
For individuals or teams regularly reporting on social media performance for Instagram, TikTok, Facebook, or Twitter (X).
For those who have access to basic social media metrics (Impressions, Engagements, Likes, Followers Gained) via native platform insights or tools like Meta Business Suite.
For users with foundational data skills who can paste data into a template but may not know how to build advanced visuals from scratch.
Ideal for creating consistent monthly/quarterly reports for clients, managers, or internal strategy reviews.
For advanced data scientists seeking to perform complex statistical modeling or regression analysis.
For organizations that require real-time (second-by-second) data monitoring, as this template is designed for periodic reporting (e.g., daily, weekly, monthly refresh).
If your primary data source is only an unsupported third-party social media tool whose data export structure is vastly different from standard platform insights.
For users who do not have access to Microsoft Power BI Desktop (free software), which is required to use the .pbix template file.
