
Publication number: ELQ-27320-1
View all versions & Certificate

Garments Sales Performance Dashboard in Excel | Interactive Retail Analytics Report
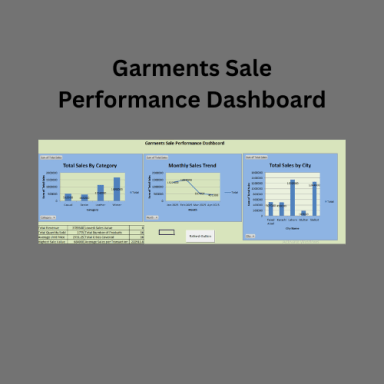
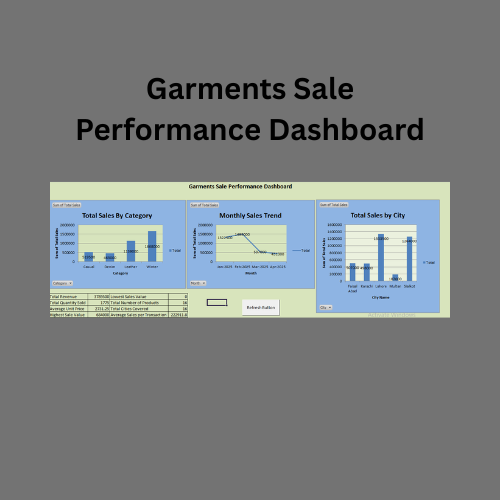
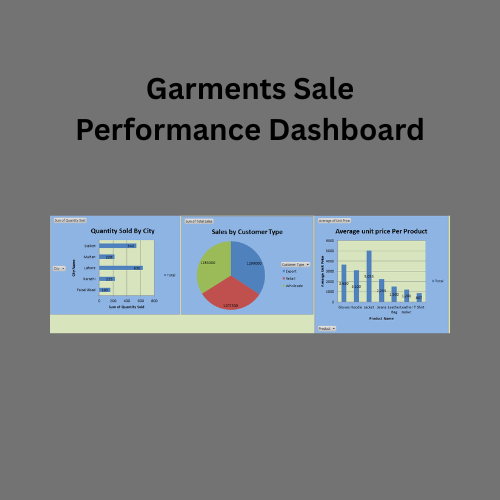
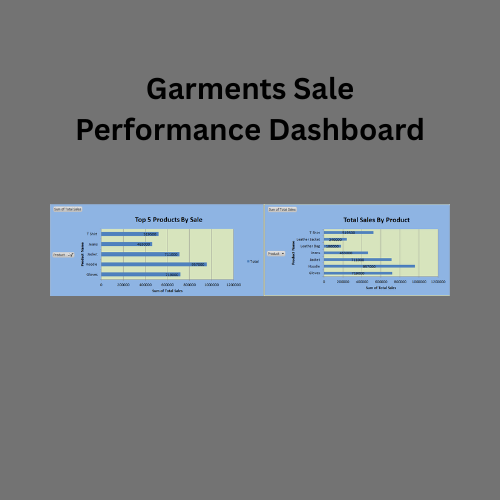
This Garments Sales Performance Dashboard in Excel provides a clear and interactive view of your retail business. It helps track key metrics such as revenue, pr
Further information
Here are clear and professional Objectives of this Downloadable Best Practice (Garments Sales Performance Dashboard):
To provide a centralized view of garments sales data for better monitoring and control.
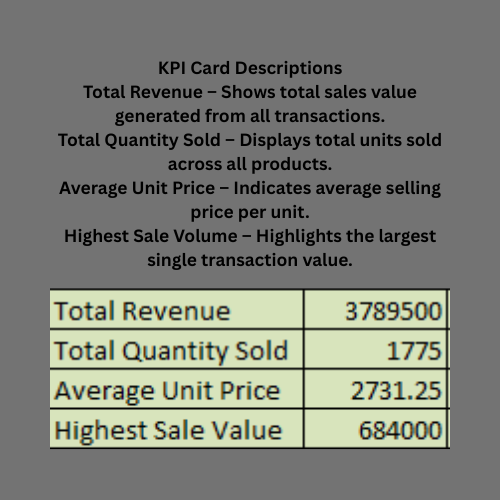
To track key performance indicators (KPIs) such as revenue, profit, and sales growth.
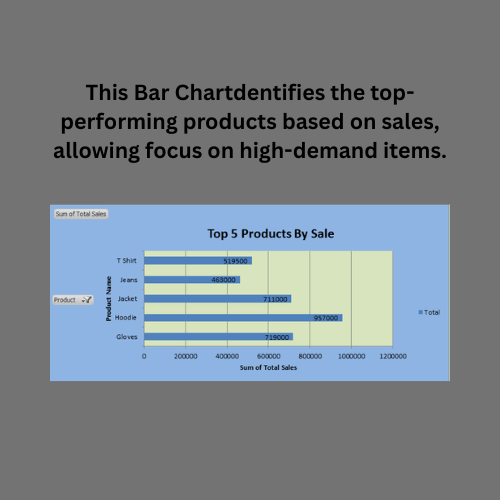
To identify top-performing products and high-demand categories.
To analyze sales trends over time for better forecasting and planning.
To evaluate branch or store performance and compare results effectively.
To improve decision-making through interactive and visual data insights.
To monitor profit margins and optimize pricing strategies.
To enhance reporting efficiency and reduce manual data analysis efforts.
To support business growth by identifying opportunities and weaknesses.
To enable data-driven strategies for improving overall sales performance.
If you want next, I can also create:
✔ Conditions where it applies best
✔ Conditions where it does NOT apply
✔ Full professional Eloquens listing package
Here are the Conditions for Which This Downloadable Best Practice Applies Best:
When managing a garments or retail business with regular sales transactions.
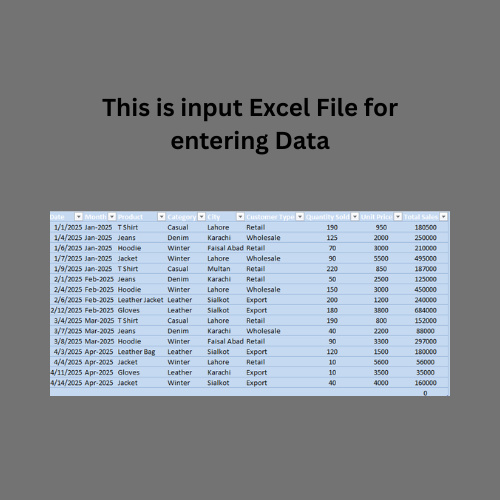
When sales data is available in a structured format (Excel, CSV, or database).
When there is a need to track KPIs such as revenue, profit, and sales performance.
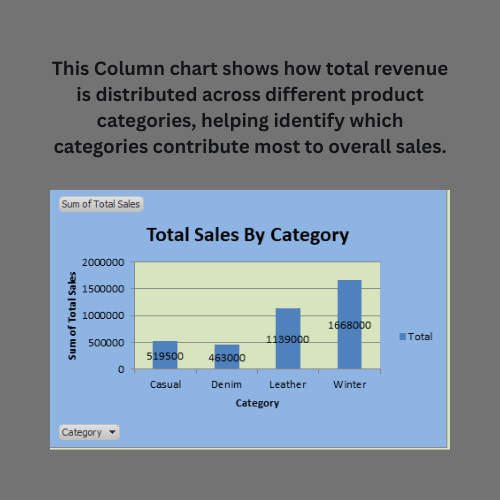
When businesses want to monitor product-wise or category-wise performance.
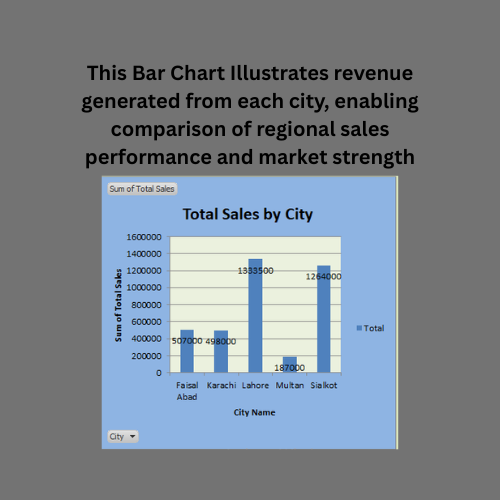
When comparing performance across multiple branches or locations.
When decision-makers require quick insights through visual dashboards.
When aiming to improve reporting efficiency and reduce manual calculations.
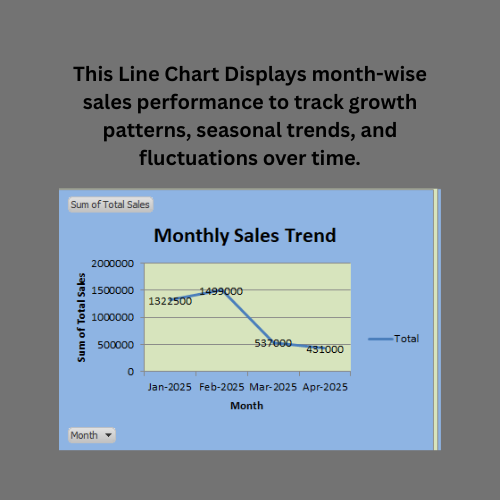
When analyzing sales trends over time for forecasting and planning.
When identifying top-selling products and customer demand patterns.
When small to medium-sized businesses need a cost-effective analytics solution in Excel.
Here are the Conditions Where This Downloadable Best Practice Does NOT Apply Ideally:
When data is unstructured, incomplete, or not regularly updated.
For businesses outside the garments or retail sales domain.
When real-time or live data integration is required (Excel has limitations).
For very large enterprises handling massive datasets beyond Excel’s capacity.
When advanced predictive analytics or AI-based forecasting is needed.
If users have no basic knowledge of Excel or dashboard interaction.
When business processes require fully automated ERP or cloud-based systems.
For organizations needing multi-user collaboration with strict access controls.
When highly customized or industry-specific metrics are required beyond the dashboard scope.
If decision-making depends on external data sources not integrated into the file.
