
Publication number: ELQ-67499-1
View all versions & Certificate

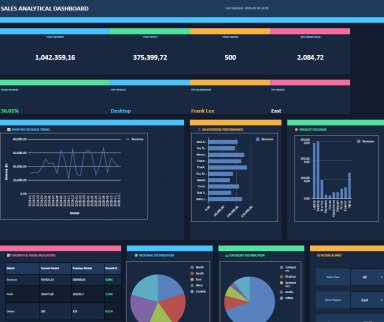
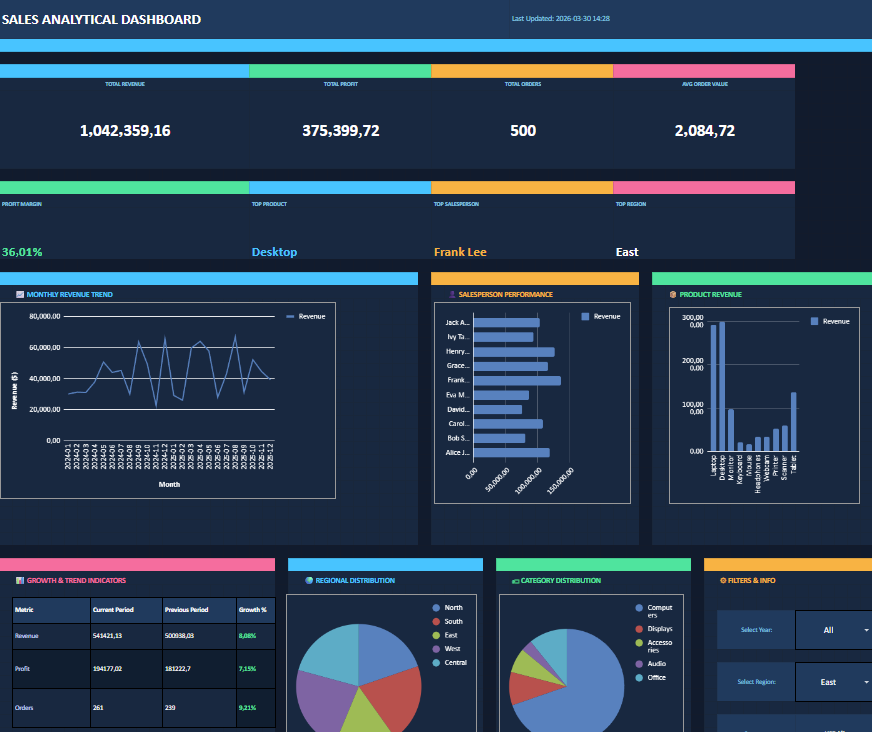
Sales Analytical Dashboard: Excel Template with KPI Tracking & Scenario Analysis
A ready-to-use Excel sales dashboard with interactive charts, data cleaning pipeline, KPI summaries, revenue forecasting, and scenario analysis — plus a PDF
Further information
• Centralize and visualize sales performance data in a single, interactive Excel dashboard
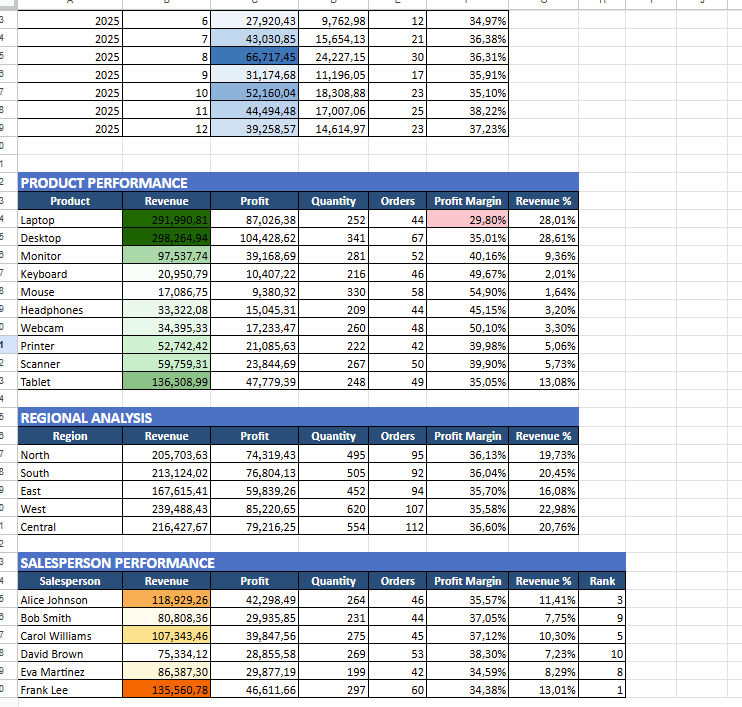
• Track key metrics including revenue, profit, margins, and average order value across multiple dimensions
• Identify top-performing and underperforming products, regions, and salespeople at a glance
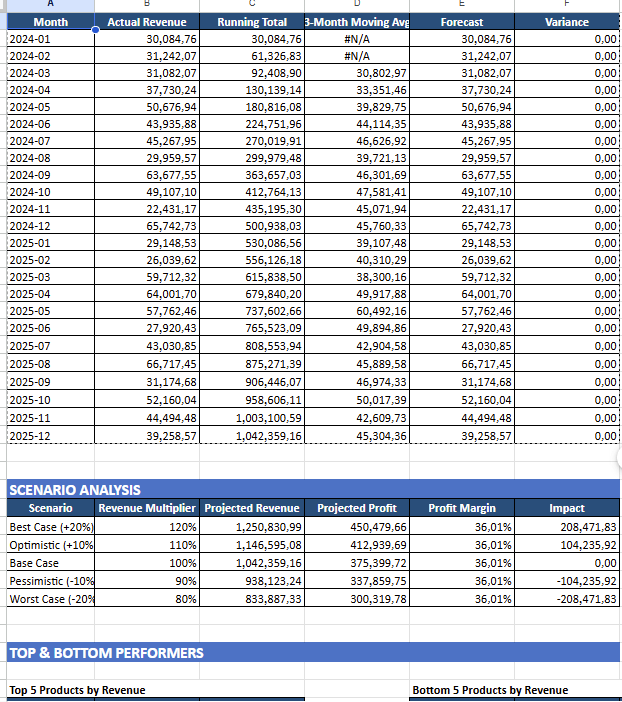
• Forecast future revenue using moving averages and trend analysis
• Model best-case and worst-case revenue scenarios for strategic planning and budgeting
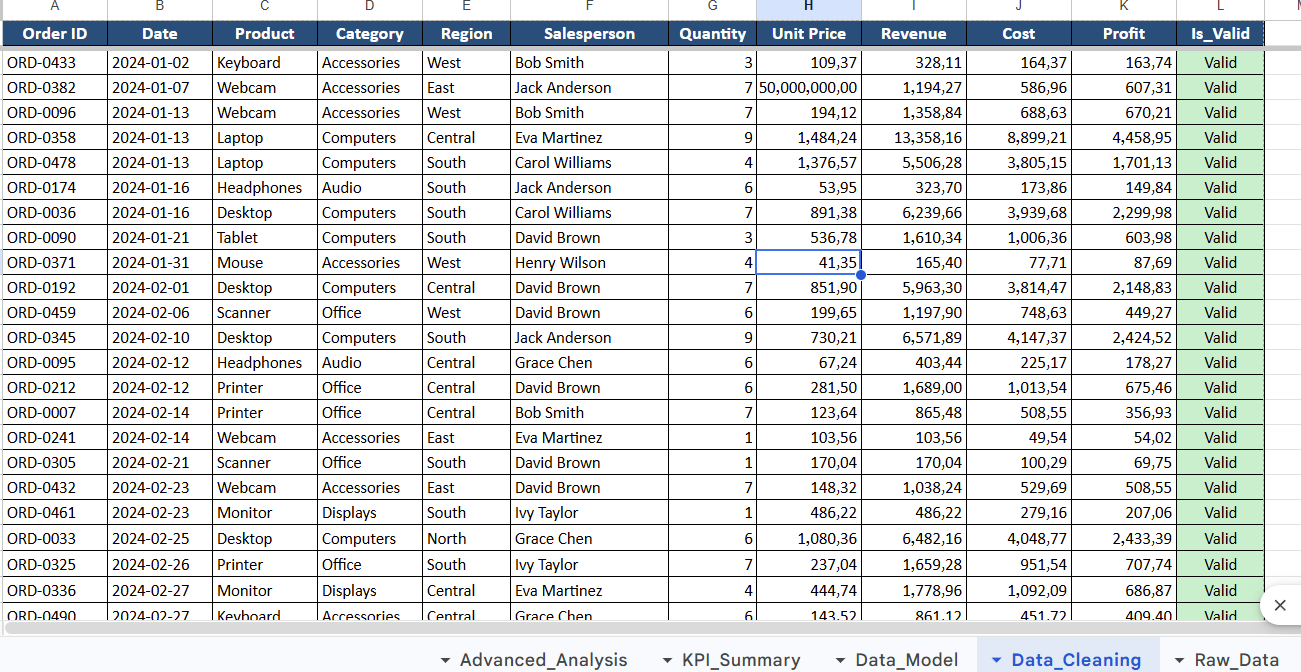
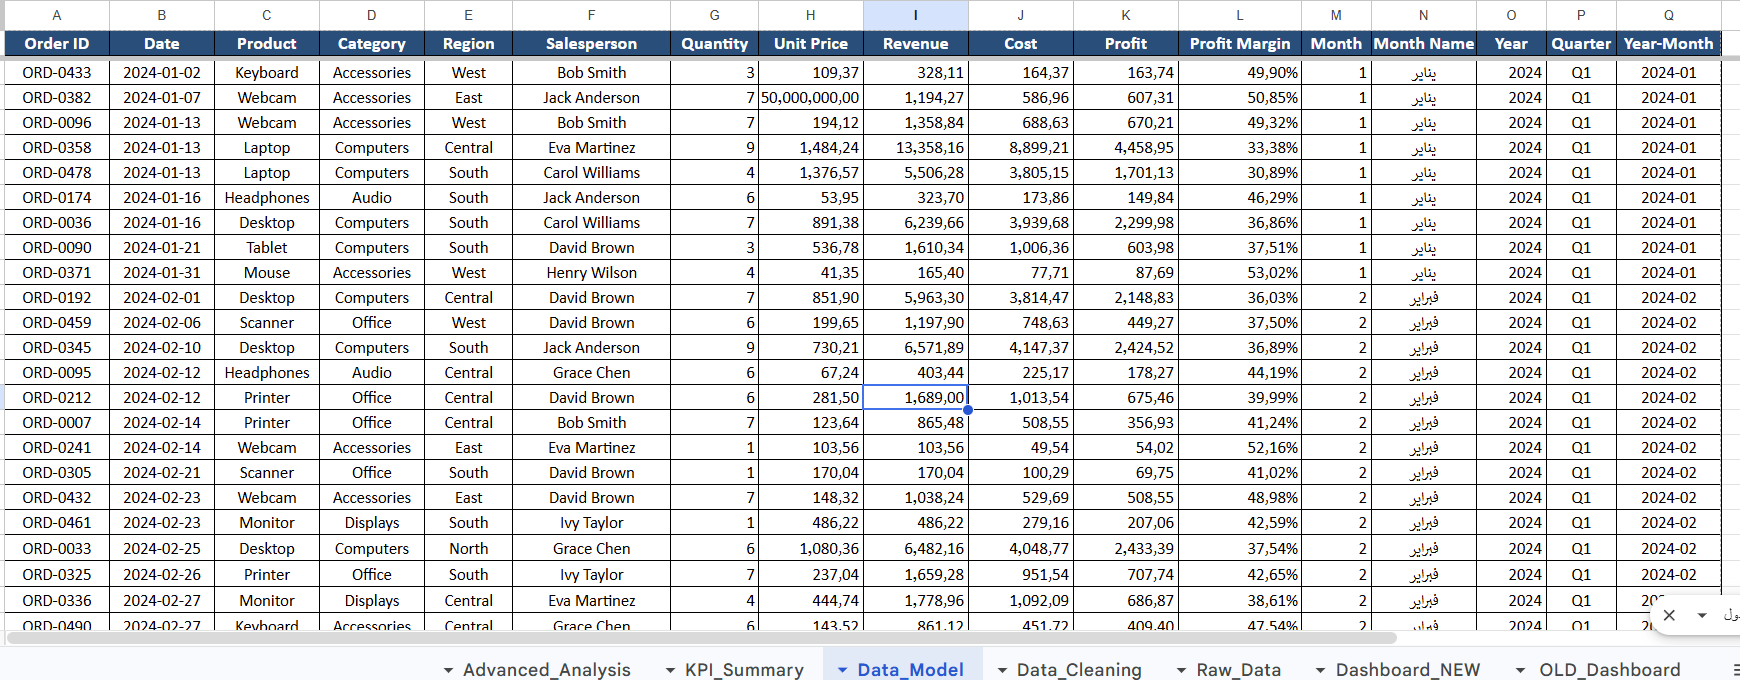
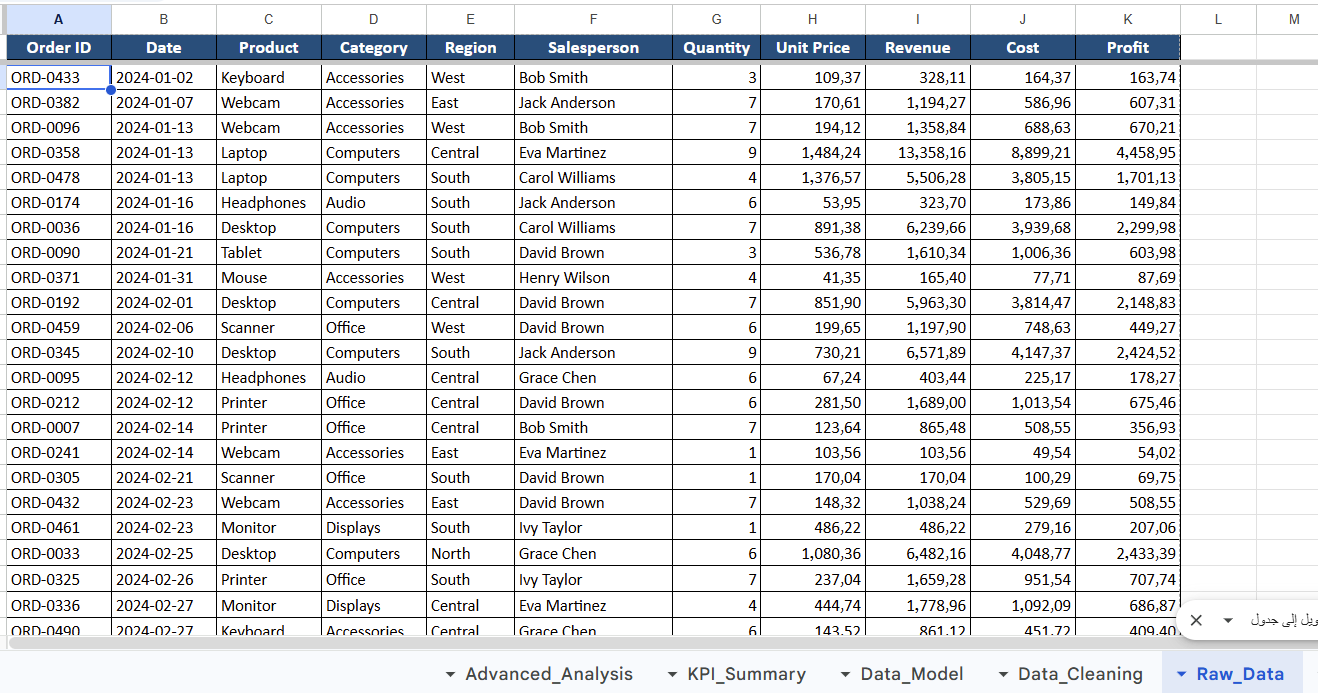
• Automate the data-to-insight pipeline: from raw data entry through cleaning, modeling, and visualization
• Provide a professional, presentation-ready dashboard suitable for executive reporting
• Small to mid-size businesses tracking sales across multiple products, regions, and sales representatives
• Sales managers and team leads who need weekly or monthly performance reviews with visual reporting
• Finance teams requiring profit margin analysis, scenario modeling, and revenue forecasting
• Consultants who need a ready-made analytical framework to deploy quickly for client engagements
• Organizations using Microsoft Excel as their primary data analysis tool (Excel 2016 or later)
• Teams with up to 10,000 transactional records who prefer spreadsheet-based solutions over BI platforms
• Professionals preparing board-level or executive-level sales performance presentations
• Enterprise organizations with 100,000+ rows of data requiring dedicated BI tools (Power BI, Tableau, Looker)
• Real-time dashboard requirements where data must refresh automatically from live databases or APIs
• Businesses needing multi-currency conversion, tax calculation, or ERP integration within the dashboard
• Teams that exclusively use Google Sheets — some advanced Excel formatting may not render correctly
• Highly regulated industries requiring audit trails, role-based access control, or SOX compliance in reporting
• Organizations needing collaborative, multi-user simultaneous editing on the same dashboard
