
Originally published: 18/08/2020 07:08
Publication number: ELQ-20244-1
View all versions & Certificate
Publication number: ELQ-20244-1
View all versions & Certificate

Kiosks Financial Model
This Kiosks Financial Model is specially designed for Kiosks Business, who are seeking investment and want projections.
Description
Our Financial Model is designed to help you make informed principal business and financial decisions bases on accurate reporting. Kiosk Financial Model contains all relevant statements.
This model is designed with the intention of opening multiple kiosks. The logic allows you to build out your initial investment based on a variety of factors that include multiple kiosks, up to 3 expansion periods, and franchise fees if applicable.
Summary of Key Features & Benefits
The workbook contains editable real-world revenue and expenses figures and comprises the following features:
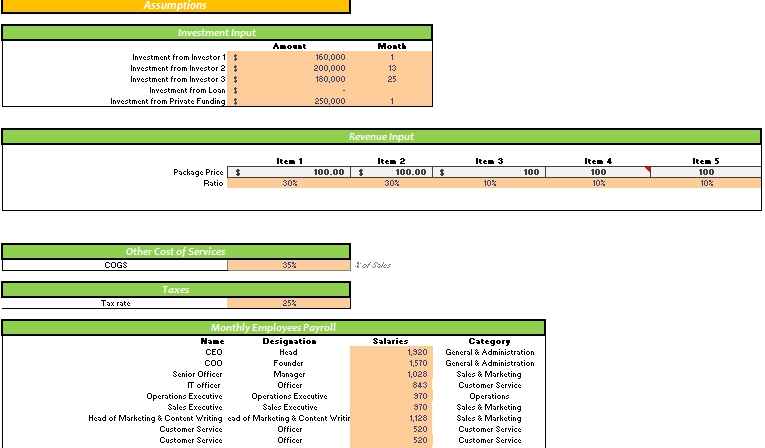
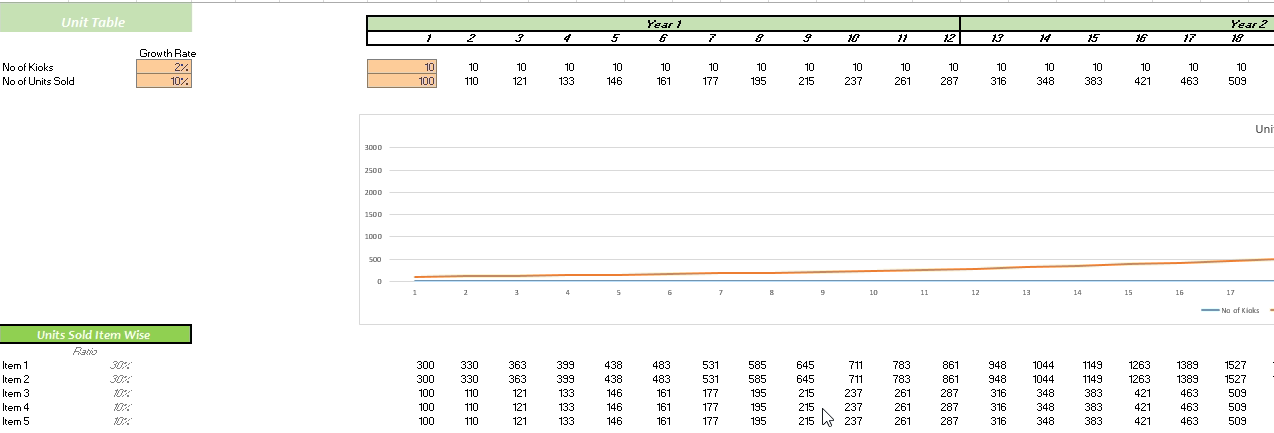
Input Sheet
The whole idea of building the Input sheet is to create a dynamic set of projections about the business. It contains all relevant inputs like costs of service, investments, personnel expenditure, general and administrative expenses, and revenue assumption.
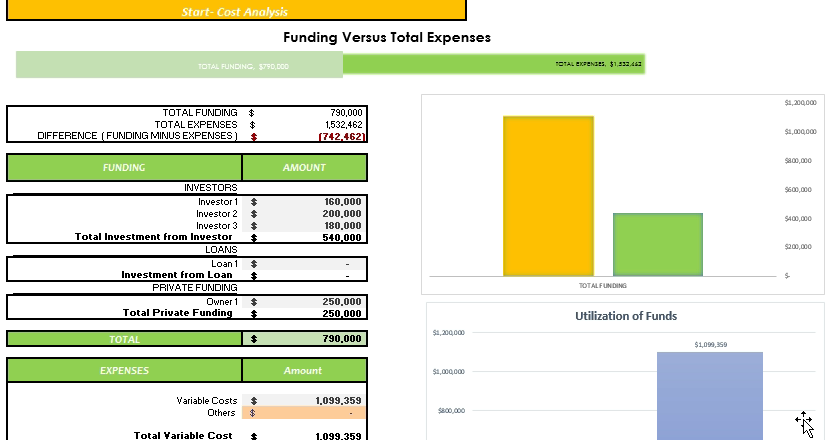
Start-Up Summary
This sheet provides an analysis of all the investment requirements of a new start-up and helps the business to present a snapshot of the company to prospective investors and help to raise capital.
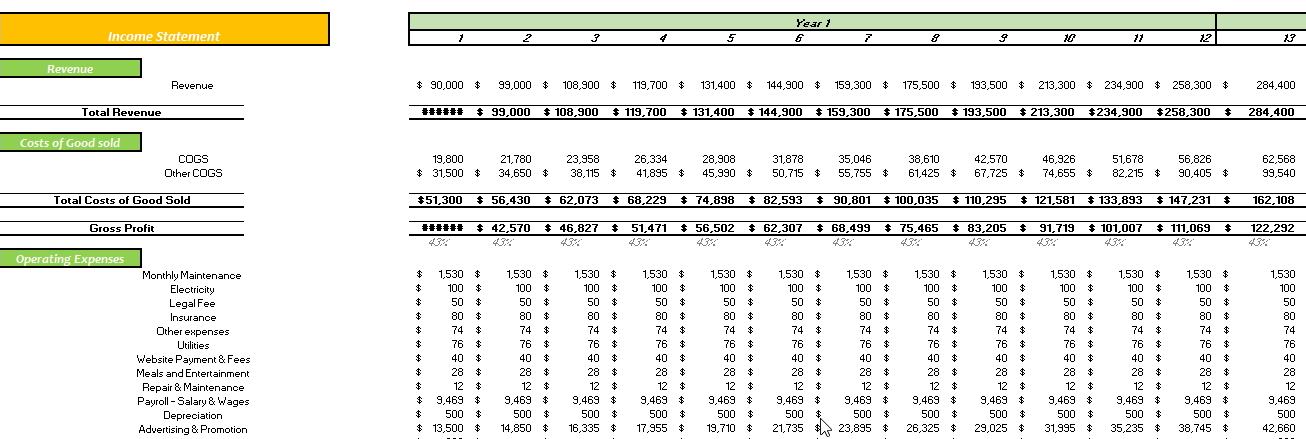
Monthly Income Statement
The Monthly Income Statement sheet for Kiosk Financial Model is perfect for those who require regular reporting and details. Additionally, Income Statement contains all revenue streamlines with gross earnings, net earnings linked with revenue analysis to ensure accurate reporting.
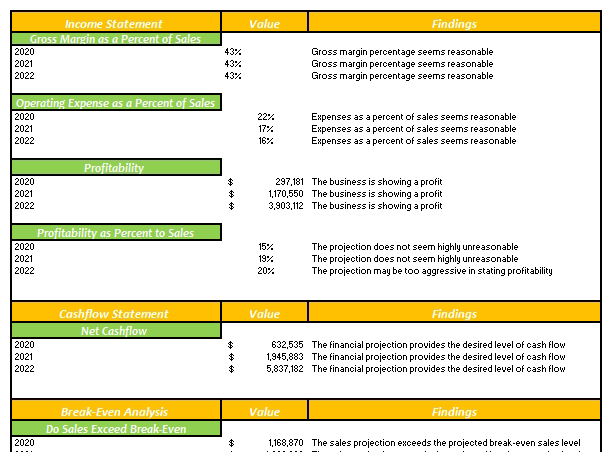
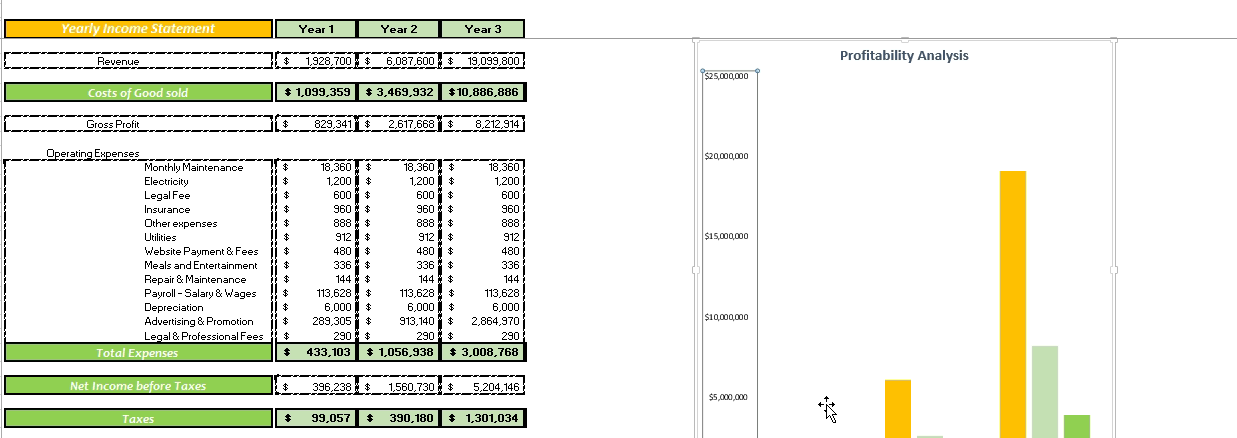
Yearly Income Statement
We understand the goal of every Kiosk Financial Model business is to make a profit for that there must be a mechanism that helps the business owners to determine whether they are making profits or otherwise.
Furthermore, the Yearly Income Statement gives you complete insights into revenue and general & administrative expenses. The Yearly Income Statement also contains several graphs, assumptions, ratios, margins, net profit, earning, cost of services, and profit after tax.
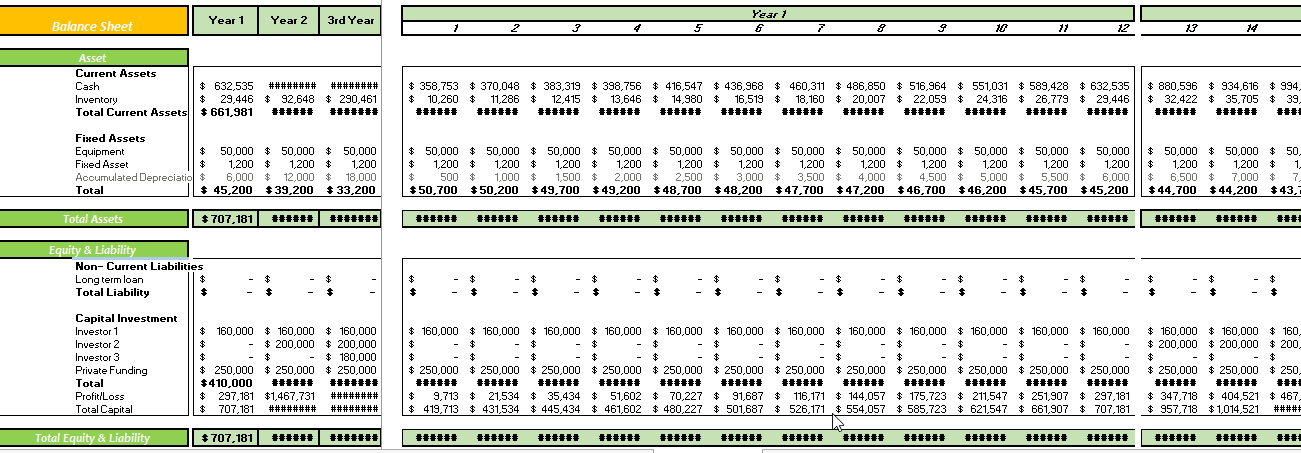
Balance Sheet
Monthly and Yearly Balance Sheet included that is linked with Cash Flow Statement, Income Statement, and other relevant inputs.
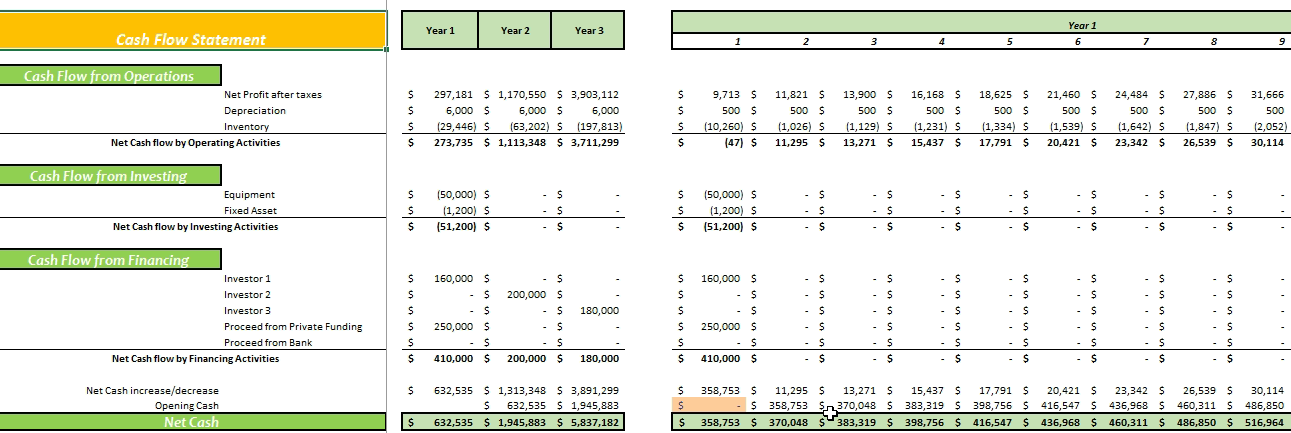
Cash Flow Statement
We prepared receivable and payable days to help users accurately predict cash activities, including free cash flow to the firm. For customers’ ease, these receivable and payable days are set as Input so that the customer can change anytime he wants.
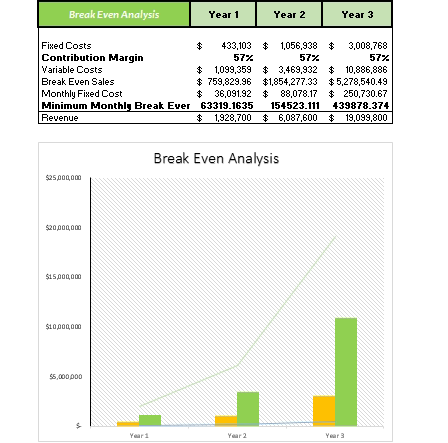
Break-Even Analysis
The break-even analysis will help you to know at a glance the profits generated at the various levels of sales. The safety margin refers to the extent to which the business can afford a decline before it starts incurring losses.
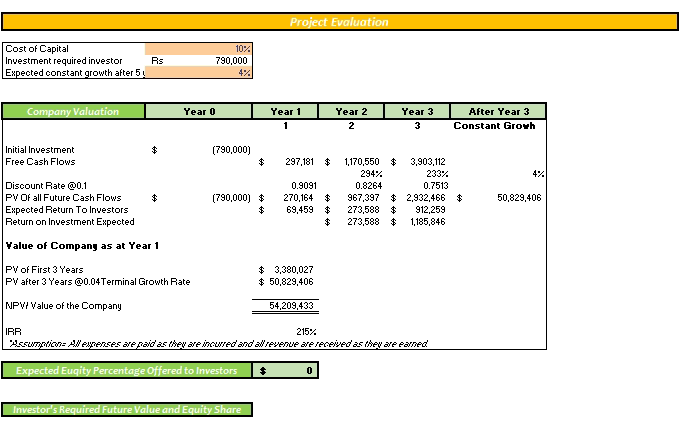
Project Evaluation
All businesses always caries risk; therefore, we included the evaluation sheet. So, it will help you to know at a glance the NPV in excel, IRR, and return on invested capital (ROIC).
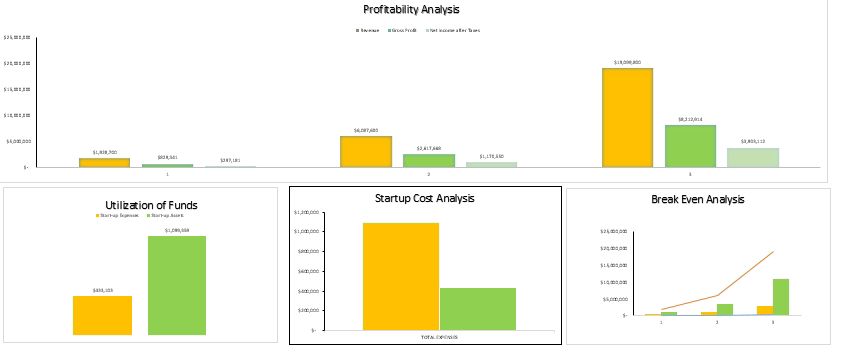
Dashboards
Users and readers respond and process visual graphs better than data. We have used dynamic charting in sheets that are linked to tables. Furthermore, charts visually track profitability, revenue, cash flow, and several other financial metrics.
Our Financial Model is designed to help you make informed principal business and financial decisions bases on accurate reporting. Kiosk Financial Model contains all relevant statements.
This model is designed with the intention of opening multiple kiosks. The logic allows you to build out your initial investment based on a variety of factors that include multiple kiosks, up to 3 expansion periods, and franchise fees if applicable.
Summary of Key Features & Benefits
The workbook contains editable real-world revenue and expenses figures and comprises the following features:
Input Sheet
The whole idea of building the Input sheet is to create a dynamic set of projections about the business. It contains all relevant inputs like costs of service, investments, personnel expenditure, general and administrative expenses, and revenue assumption.
Start-Up Summary
This sheet provides an analysis of all the investment requirements of a new start-up and helps the business to present a snapshot of the company to prospective investors and help to raise capital.
Monthly Income Statement
The Monthly Income Statement sheet for Kiosk Financial Model is perfect for those who require regular reporting and details. Additionally, Income Statement contains all revenue streamlines with gross earnings, net earnings linked with revenue analysis to ensure accurate reporting.
Yearly Income Statement
We understand the goal of every Kiosk Financial Model business is to make a profit for that there must be a mechanism that helps the business owners to determine whether they are making profits or otherwise.
Furthermore, the Yearly Income Statement gives you complete insights into revenue and general & administrative expenses. The Yearly Income Statement also contains several graphs, assumptions, ratios, margins, net profit, earning, cost of services, and profit after tax.
Balance Sheet
Monthly and Yearly Balance Sheet included that is linked with Cash Flow Statement, Income Statement, and other relevant inputs.
Cash Flow Statement
We prepared receivable and payable days to help users accurately predict cash activities, including free cash flow to the firm. For customers’ ease, these receivable and payable days are set as Input so that the customer can change anytime he wants.
Break-Even Analysis
The break-even analysis will help you to know at a glance the profits generated at the various levels of sales. The safety margin refers to the extent to which the business can afford a decline before it starts incurring losses.
Project Evaluation
All businesses always caries risk; therefore, we included the evaluation sheet. So, it will help you to know at a glance the NPV in excel, IRR, and return on invested capital (ROIC).
Dashboards
Users and readers respond and process visual graphs better than data. We have used dynamic charting in sheets that are linked to tables. Furthermore, charts visually track profitability, revenue, cash flow, and several other financial metrics.
This Best Practice includes
1 Excel Model
