Originally published: 22/04/2020 16:43
Publication number: ELQ-35973-1
View all versions & Certificate
Publication number: ELQ-35973-1
View all versions & Certificate

Rolling 13 Weeks Cash Flow Excel Template
The template consists of a model which assists in forecasting their cash flows on a weekly basis.
cash flowcash flow forecastforecast modelrolling cash flow forecast13 week cash flowactual versus forecastexcelexcel modelrolling forecast
Description
Rolling 13 Weeks Cash Flow template consists of a model which assists the users in forecasting their cash flows on a weekly basis and in monitoring their actual cash flows on a weekly basis. Additionally variance analysis is performed between actual versus forecasts, as well as between current week forecast and previous week forecasts.
The model generates current and previous forecasts outputs, actual versus previous forecast on a week on week basis, and current versus previous forecasts on a weekly basis as well as on a 12 week basis.
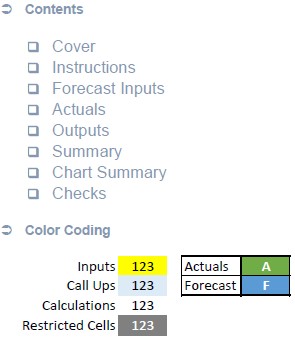
So a quick overview of the model, in the contents tab you can see the structure of the model and by clicking on any of the headlines to be redirected to the relevant worksheet.
Additionally there is a description of the color coding of the model in the same tab. Inputs / Assumptions are always depicted with a yellow fill and black letters, call up (that is direct links from other cells) are filled in light blue with blue letters while calculations are depicted with white fill and black characters.
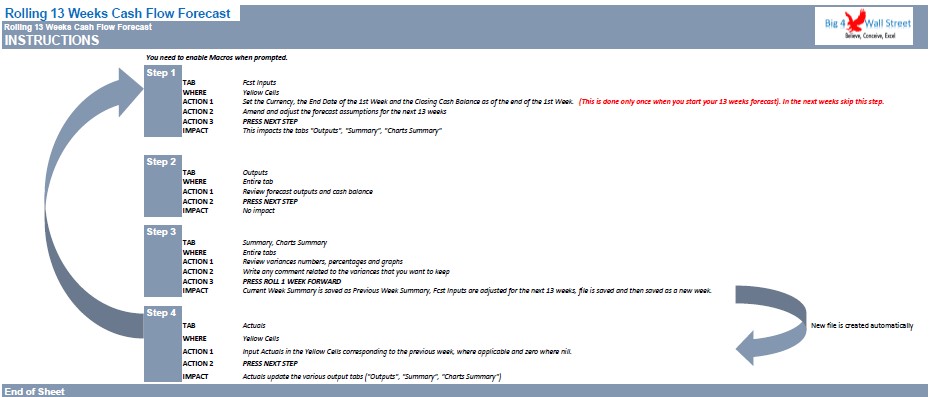
Before moving to the model assumptions, take some time to go through the instructions tab, where a detailed walk through of the model is presented. Of course this video will also go step by step through 2 weekly cycles of the rolling forecast cash flow.
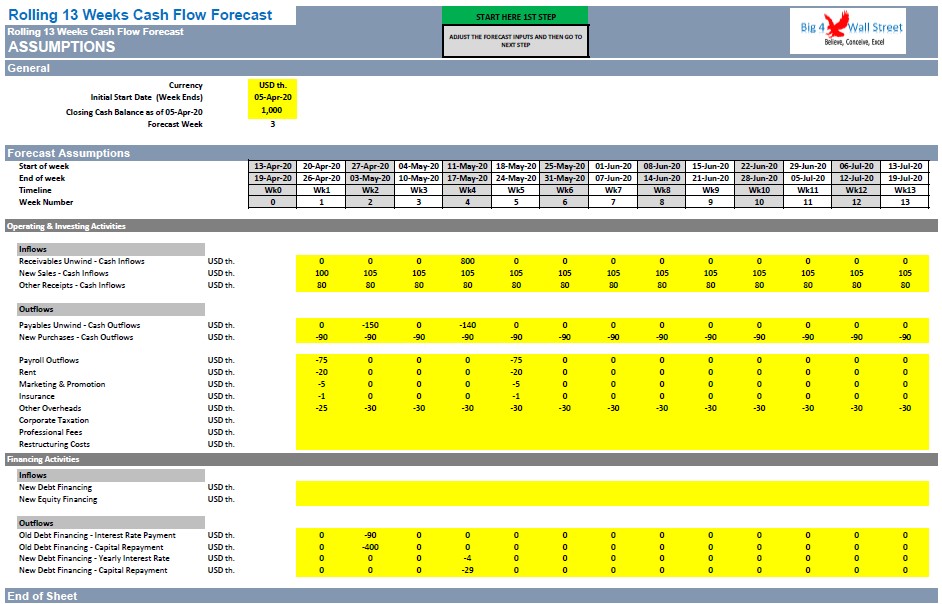
In the "Fcst Inputs" tab, there are two set of assumptions. The first set is filled only once at the beginning of the forecast process: these yellow cells are located in the range B7 to B9 where the user needs to fill the currency, the date where week zero ends, and the cash at the end of week zero.
The second set (the forecast cash flow inputs for the next 13 weeks) which needs to be filled are yellow cells from lines 22 to 50. Inflows should be entered with a positive sign, while outflows with a negative sign.
Once you are done with these two sets, press the button "NEXT STEP". You will need to enable macros when prompted for these to work.
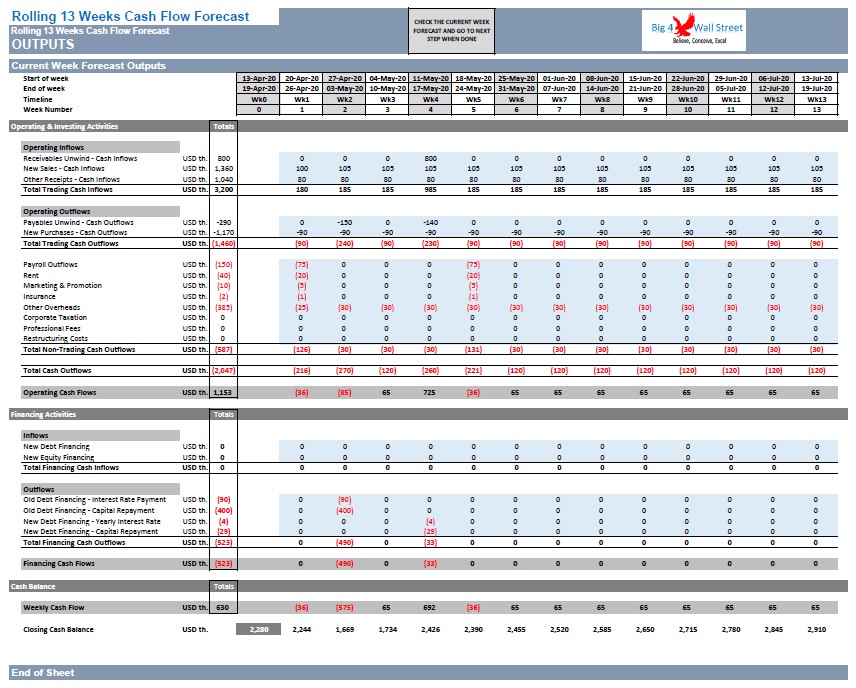
The user will be redirected to the "Outputs" tab, where he just needs to scroll down and check the outputs of the forecast and make sure these are as intended for the next 13 weeks. Once you are ready press the button "NEXT STEP".
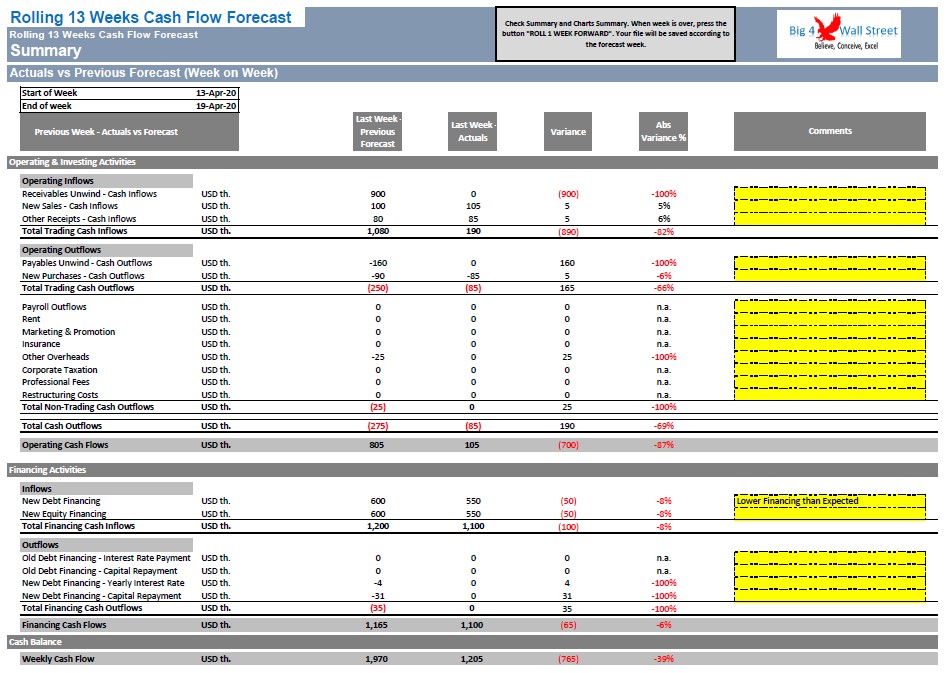
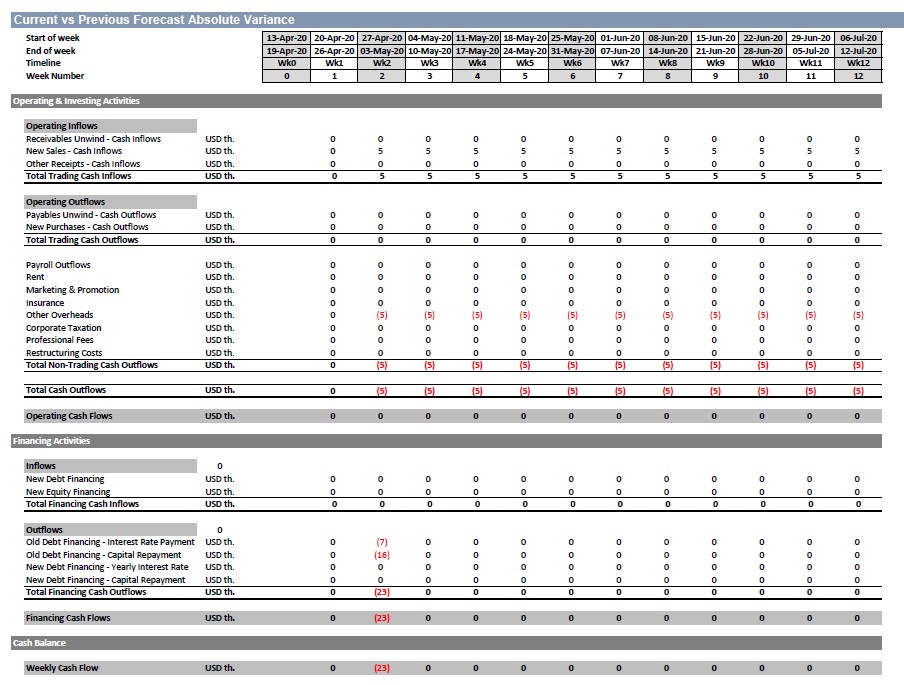
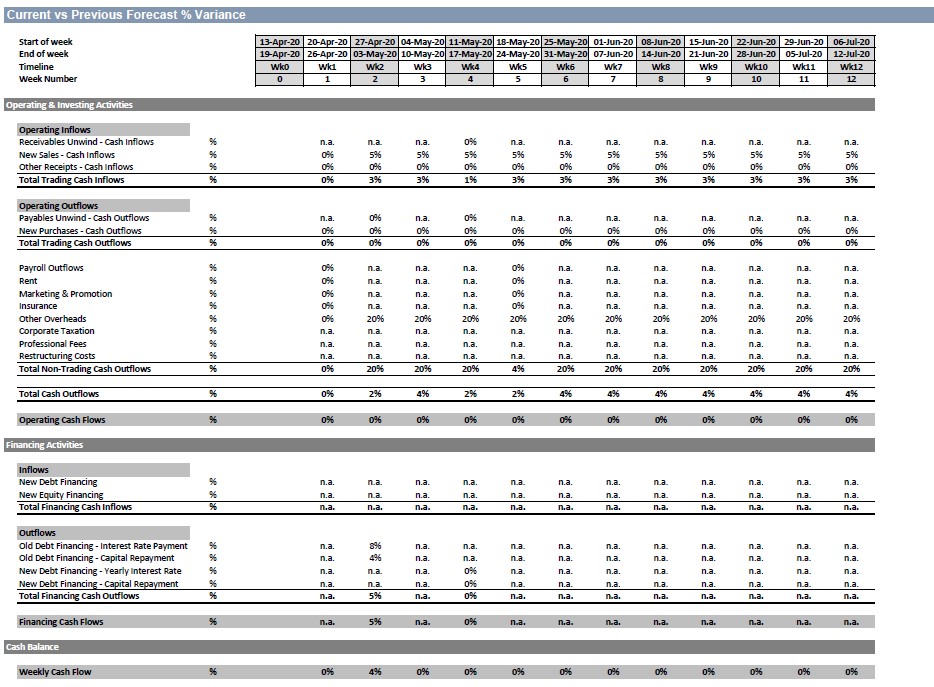
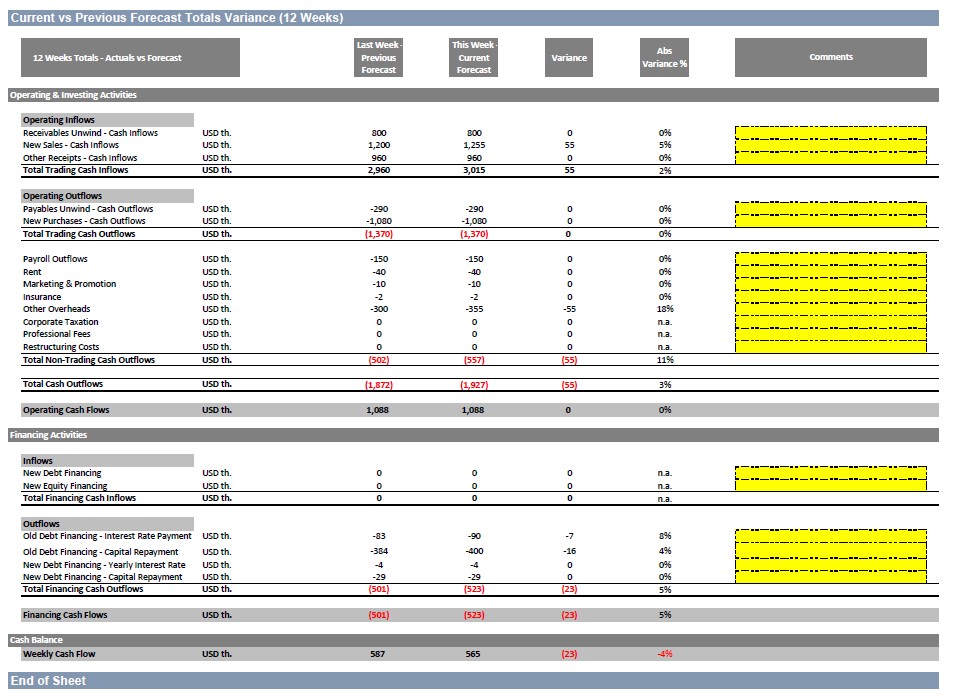
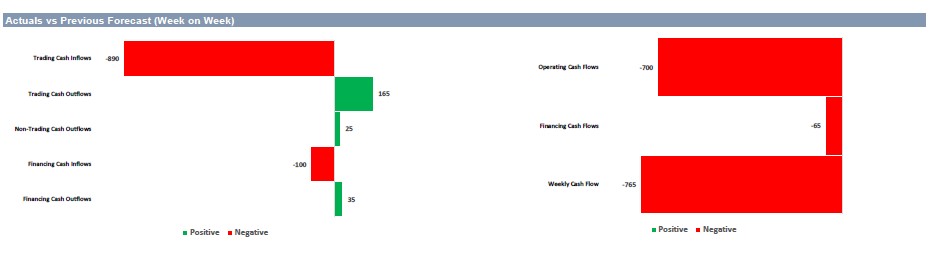
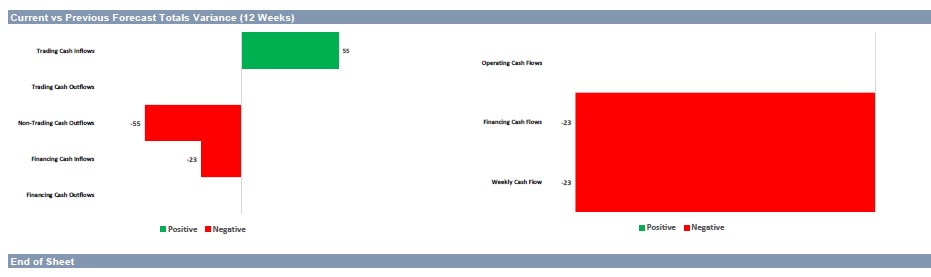
In the "Summary" tab, you can see the actual versus previous forecast, as well as a weekly and 12 week current versus previous forecast in both absolute variance and in percentage variance. Of course when you are doing your first forecast you won't see any variance to compare with.
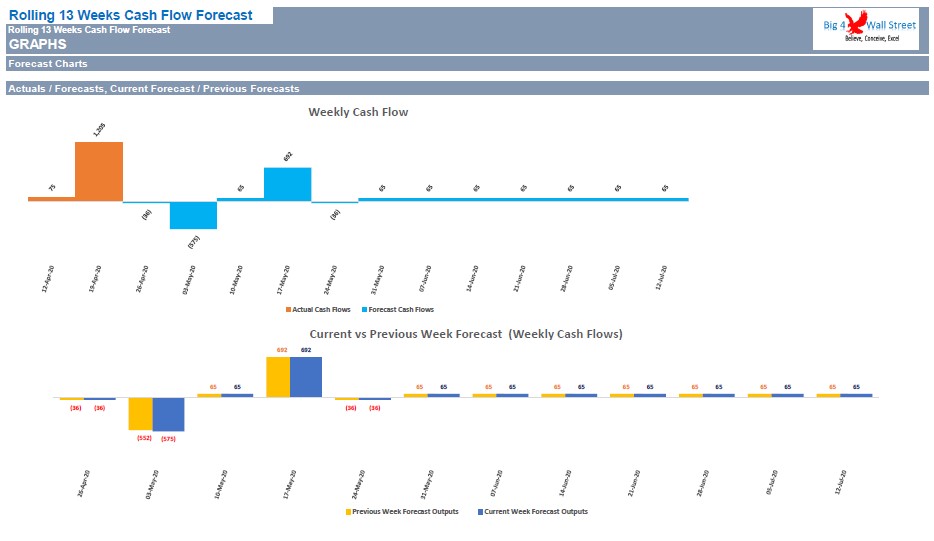
The same information is also presented on the "Charts Summary" tab, however with graphical representations. Once you have gone through these charts and tables, the user can go back to the "Summary" tab and press the button "ROLL 1 WEEK FORWARD".
After pressing the button, the current file is saved and a new file is created in the same folder with the name "Rolling 13 Wks Wk1". Press "OK".
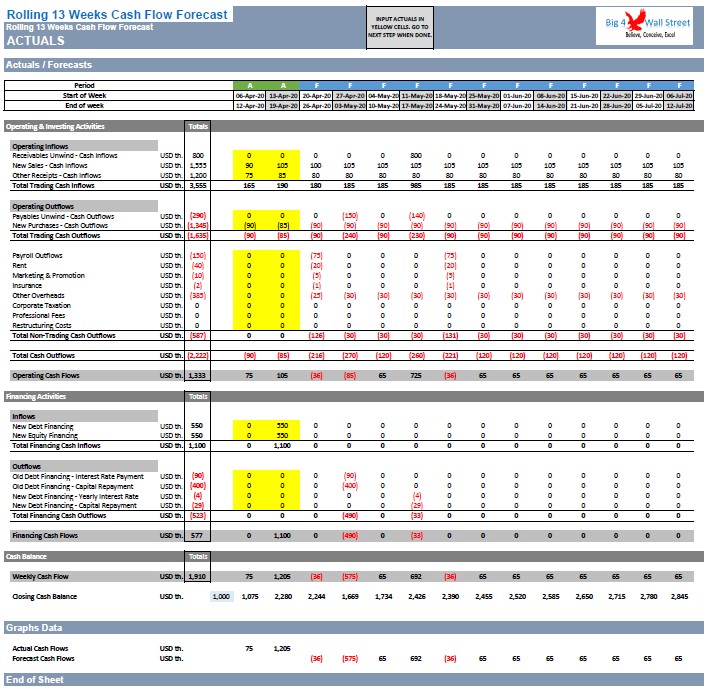
The user will be redirected to the tab "Actuals" where the user needs to fill the actual data in the yellow cells for that week. Once done with the actuals input, press the button "NEXT STEP".
The user is transferred to "Fcst Inputs", where the cash flow forecast is rolled forward by one week automatically along with your previous forecast. Change whatever you deem has changed for the 13 week rolling forecast from lines 22 to 50 (new forecast). Very important: don't change cells E7 to E9.
Once ready, press "NEXT STEP" and check your "Outputs" and press "NEXT STEP", check your "Summary" tab regarding deviations, and write any inputs you think are important. Go to "Charts Summary" and check the deviations presented through the various charts , and once ready go to "Summary" and press the button "ROLL 1 WEEK FORWARD".
After pressing the button, the current file is saved and a new file is created in the same folder with the name "Rolling 13 Wks Wk2". Press "OK".
The user will be redirected to the tab "Actuals" where the user needs to fill the actual data in the yellow cells for that week. Once done with the actuals input, press the button "NEXT STEP".
The user is transferred to "Fcst Inputs", where the cash flow forecast is rolled forward by one week automatically along with your previous forecast. Change whatever you deem has changed for the 13 week rolling forecast from lines 22 to 50 (new forecast). Very important: don't change cells E7 to E9.
Once ready, press "NEXT STEP" and check your "Outputs" and press "NEXT STEP", check your "Summary" tab regarding deviations , and write any inputs you think are important. Go to "Charts Summary" and check the deviations presented through the various charts, and once ready go to "Summary" and press the button "ROLL 1 WEEK FORWARD" and then you repeat this process until you reach the end of the forecast timeline.
And the weekly forecast cycle starts over again, with the same steps as previously presented.
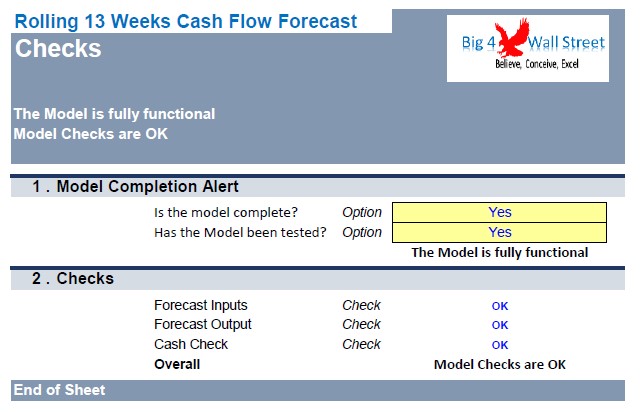
Checks: A dedicated worksheet that makes sure that everything is working as it should!
Important Notice: Yellow indicates inputs and assumptions that the user is able to change, blue cells are used for called up cells, and white cells with black characters indicates calculation cells.
Rolling 13 Weeks Cash Flow template consists of a model which assists the users in forecasting their cash flows on a weekly basis and in monitoring their actual cash flows on a weekly basis. Additionally variance analysis is performed between actual versus forecasts, as well as between current week forecast and previous week forecasts.
The model generates current and previous forecasts outputs, actual versus previous forecast on a week on week basis, and current versus previous forecasts on a weekly basis as well as on a 12 week basis.
So a quick overview of the model, in the contents tab you can see the structure of the model and by clicking on any of the headlines to be redirected to the relevant worksheet.
Additionally there is a description of the color coding of the model in the same tab. Inputs / Assumptions are always depicted with a yellow fill and black letters, call up (that is direct links from other cells) are filled in light blue with blue letters while calculations are depicted with white fill and black characters.
Before moving to the model assumptions, take some time to go through the instructions tab, where a detailed walk through of the model is presented. Of course this video will also go step by step through 2 weekly cycles of the rolling forecast cash flow.
In the "Fcst Inputs" tab, there are two set of assumptions. The first set is filled only once at the beginning of the forecast process: these yellow cells are located in the range B7 to B9 where the user needs to fill the currency, the date where week zero ends, and the cash at the end of week zero.
The second set (the forecast cash flow inputs for the next 13 weeks) which needs to be filled are yellow cells from lines 22 to 50. Inflows should be entered with a positive sign, while outflows with a negative sign.
Once you are done with these two sets, press the button "NEXT STEP". You will need to enable macros when prompted for these to work.
The user will be redirected to the "Outputs" tab, where he just needs to scroll down and check the outputs of the forecast and make sure these are as intended for the next 13 weeks. Once you are ready press the button "NEXT STEP".
In the "Summary" tab, you can see the actual versus previous forecast, as well as a weekly and 12 week current versus previous forecast in both absolute variance and in percentage variance. Of course when you are doing your first forecast you won't see any variance to compare with.
The same information is also presented on the "Charts Summary" tab, however with graphical representations. Once you have gone through these charts and tables, the user can go back to the "Summary" tab and press the button "ROLL 1 WEEK FORWARD".
After pressing the button, the current file is saved and a new file is created in the same folder with the name "Rolling 13 Wks Wk1". Press "OK".
The user will be redirected to the tab "Actuals" where the user needs to fill the actual data in the yellow cells for that week. Once done with the actuals input, press the button "NEXT STEP".
The user is transferred to "Fcst Inputs", where the cash flow forecast is rolled forward by one week automatically along with your previous forecast. Change whatever you deem has changed for the 13 week rolling forecast from lines 22 to 50 (new forecast). Very important: don't change cells E7 to E9.
Once ready, press "NEXT STEP" and check your "Outputs" and press "NEXT STEP", check your "Summary" tab regarding deviations, and write any inputs you think are important. Go to "Charts Summary" and check the deviations presented through the various charts , and once ready go to "Summary" and press the button "ROLL 1 WEEK FORWARD".
After pressing the button, the current file is saved and a new file is created in the same folder with the name "Rolling 13 Wks Wk2". Press "OK".
The user will be redirected to the tab "Actuals" where the user needs to fill the actual data in the yellow cells for that week. Once done with the actuals input, press the button "NEXT STEP".
The user is transferred to "Fcst Inputs", where the cash flow forecast is rolled forward by one week automatically along with your previous forecast. Change whatever you deem has changed for the 13 week rolling forecast from lines 22 to 50 (new forecast). Very important: don't change cells E7 to E9.
Once ready, press "NEXT STEP" and check your "Outputs" and press "NEXT STEP", check your "Summary" tab regarding deviations , and write any inputs you think are important. Go to "Charts Summary" and check the deviations presented through the various charts, and once ready go to "Summary" and press the button "ROLL 1 WEEK FORWARD" and then you repeat this process until you reach the end of the forecast timeline.
And the weekly forecast cycle starts over again, with the same steps as previously presented.
Checks: A dedicated worksheet that makes sure that everything is working as it should!
Important Notice: Yellow indicates inputs and assumptions that the user is able to change, blue cells are used for called up cells, and white cells with black characters indicates calculation cells.
This Best Practice includes
1 Excel and 1 PDF
