Originally published: 26/03/2018 13:54
Publication number: ELQ-58674-1
View all versions & Certificate
certified

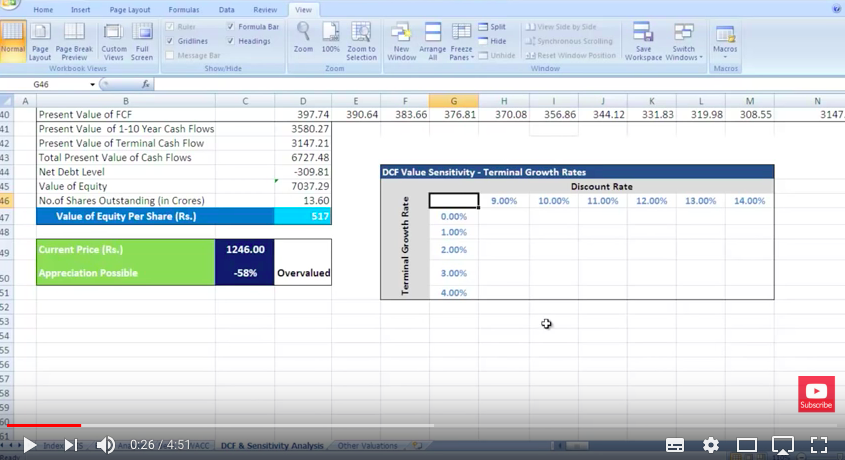
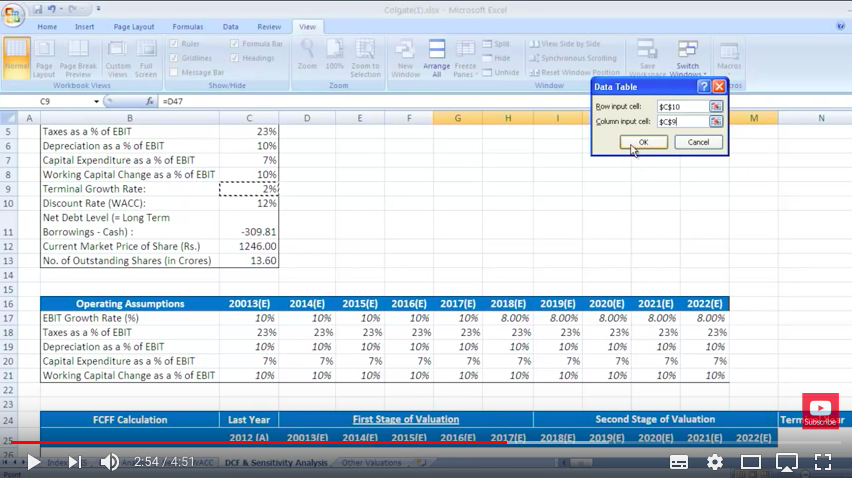
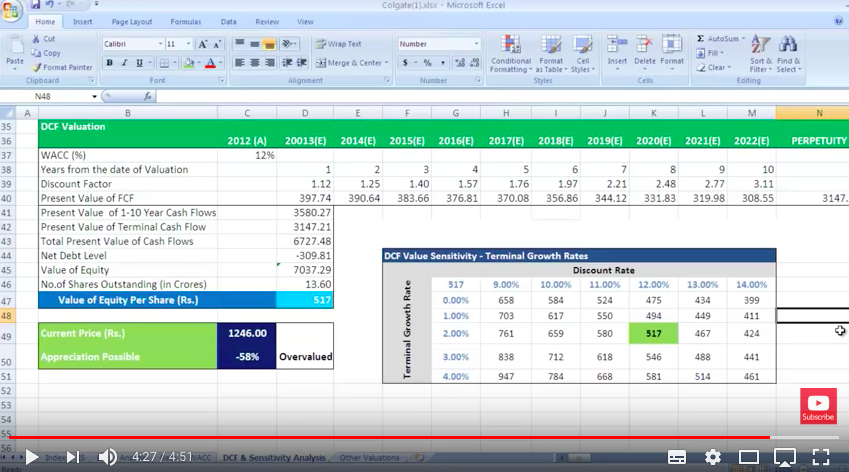
Sensitivity Analysis Using Excel

In this video you will learn how to carry out sensitivity analysis using Excel.

Description
In this video, you will see a sensitivity analysis using data tables and will learn how to use data tables in sensitivity analysis.

Sensitivity analysis is a technique that is used to see how different values of an independent variable impact a particular dependent variable under a given set of assumptions. This technique is used within specific boundaries that depended on one or more input variables - for example, the effect that changes in interest rates have on the price of bonds.

Video length: 4:51

This Best Practice includes
1 Video File

Add to bookmarks

Did Finance Walk's Best Practice help you? You can make a small financial contribution to support the author.

helpSupport


4.2 / 5 (6 votes)

please wait...