

Originally published: 01/06/2023 13:36
Publication number: ELQ-26381-1
View all versions & Certificate
Publication number: ELQ-26381-1
View all versions & Certificate

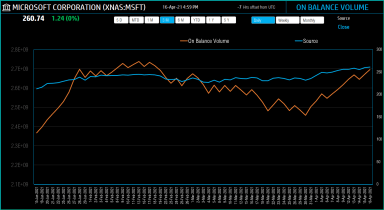
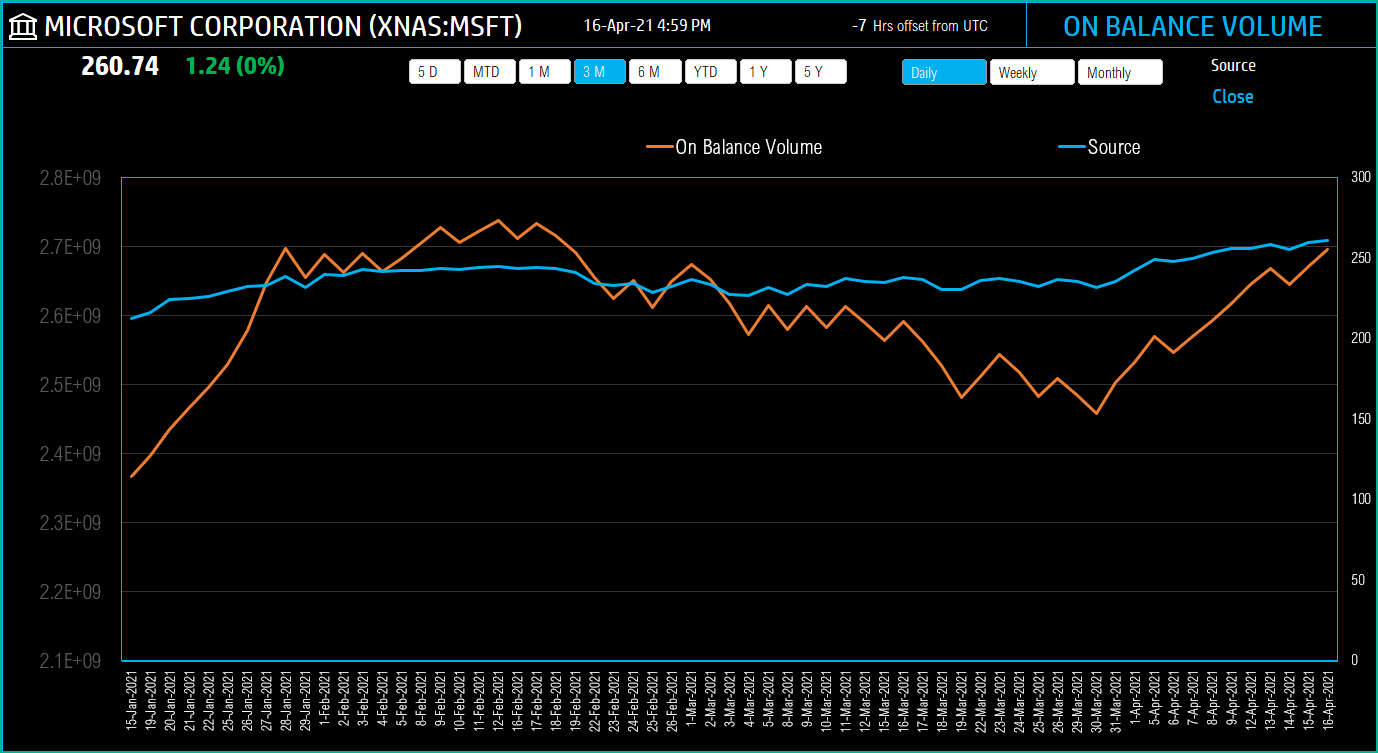
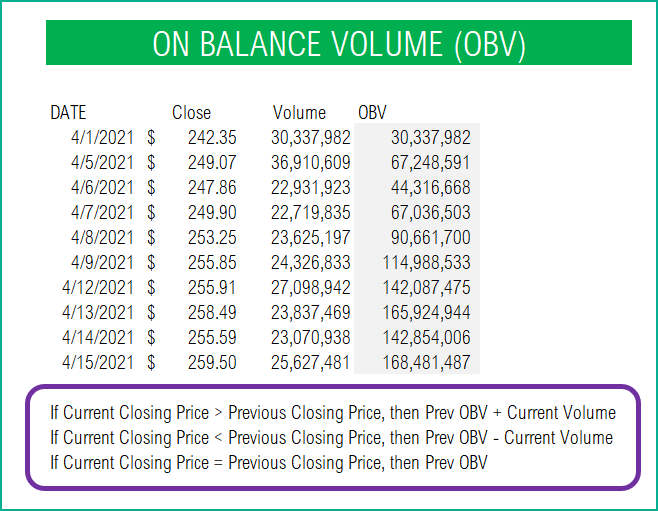
On Balance Volume Indicator – Technical Analysis
Use this free Excel template to calculate On Balance Volume Indicator for any stock you are interested in!
