ICICI Bank Financial Model — 3-Statement, NIM Schedule, Valuation & Dashboard (Excel)
Originally published: 03/08/2026 12:49
Publication number: ELQ-44589-1
View all versions & Certificate
certified

ICICI Bank Financial Model — 3-Statement, NIM Schedule, Valuation & Dashboard (Excel)

Complete banking-sector 3-statement model for ICICI Bank with NII/NIM, asset quality, and CASA schedules, multi-method valuation, and scenario analysis.

Description

This is a fully built, investment-grade financial model for ICICI Bank — India's second-largest private sector bank — constructed entirely from scratch and adapted specifically for the banking sector.

Model Overview

Unlike manufacturing models, banking financial models require a fundamentally different architecture, and this model reflects that in every sheet.


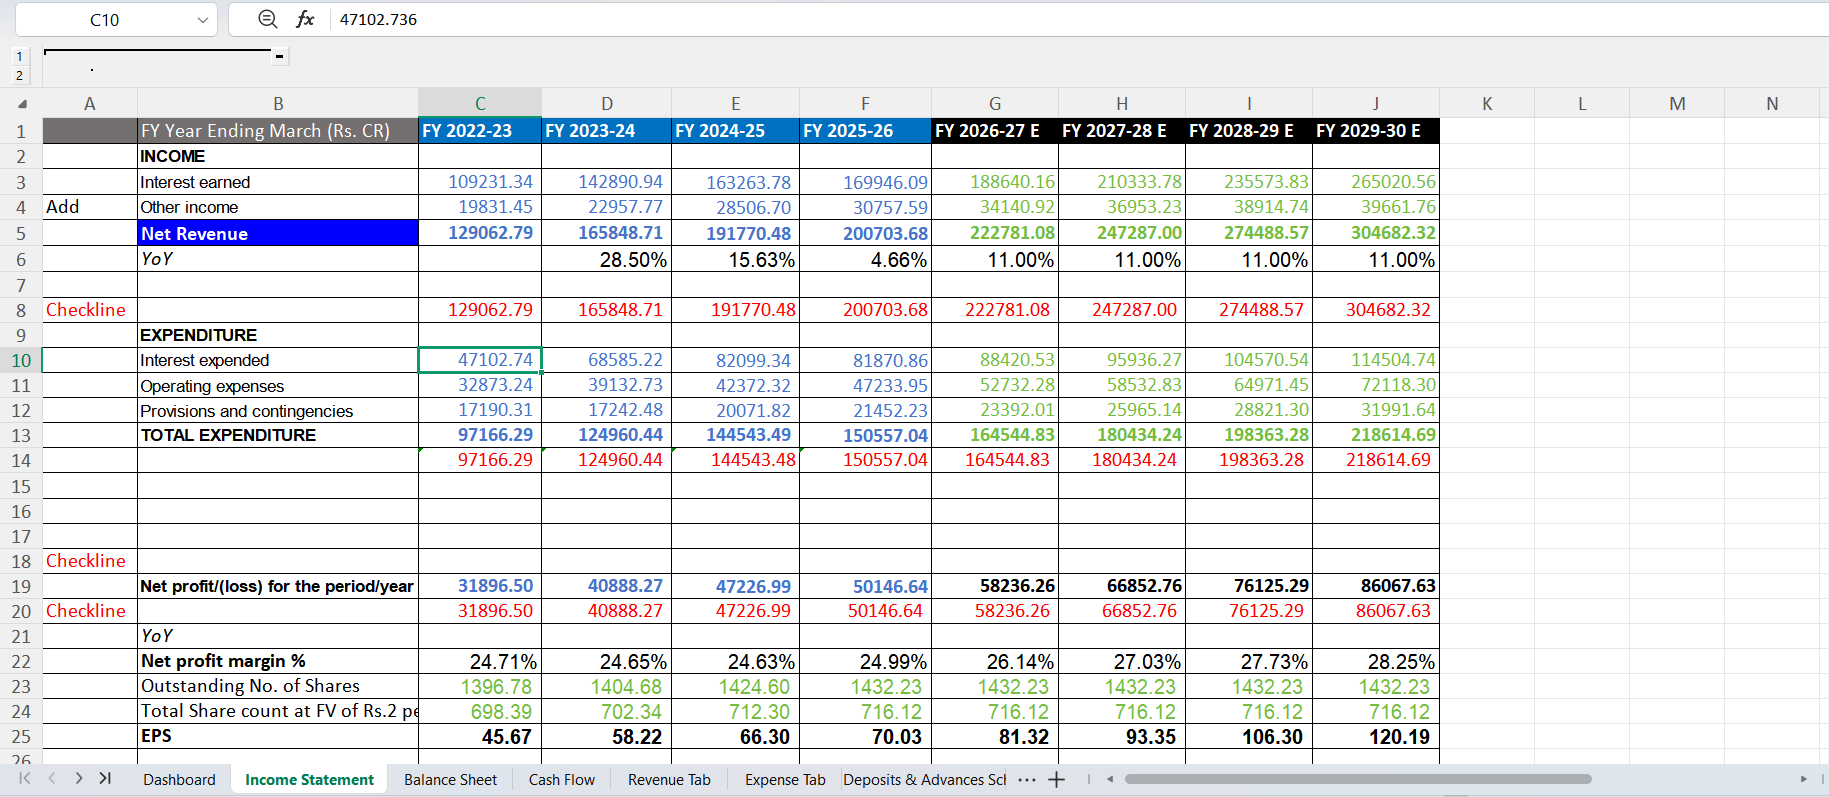
The model covers a complete 3-statement framework (Income Statement, Balance Sheet, and Cash Flow) with banking-specific line items:

  • Interest Earned

  • Interest Expended

  • Provisions & Contingencies

  • Net Interest Income


These are correctly structured as per RBI reporting norms.

Dedicated Schedules

The model includes four dedicated schedules built exclusively for banking analysis:

  1. NII & NIM Schedule: Tracks Yield on Assets, Cost of Funds, and Interest Spread across FY23–FY30E.

  2. Loan Book & Asset Quality Schedule: Covers Retail, Corporate, and Agriculture segments with:

    • Gross NPA%

    • Net NPA%

    • Provision Coverage Ratio

    • Slippage Rate

    • Credit Cost

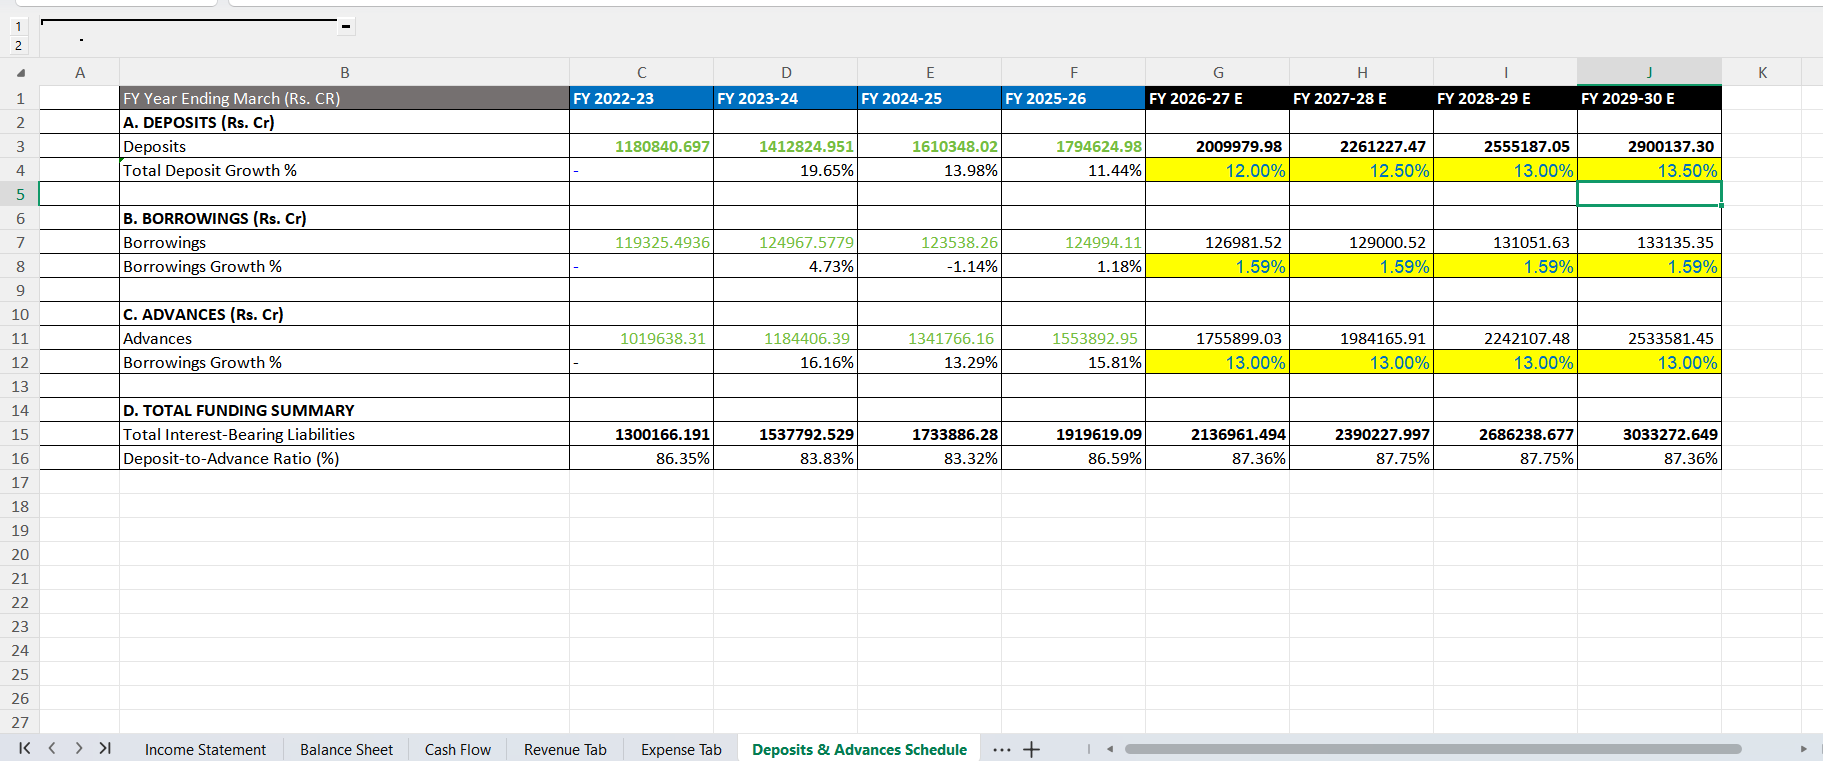
  3. Deposits & CASA Schedule: Projects:

    • CASA Ratio

    • Cost of Deposits

    • Deposit-to-Advance Ratio

  4. Equity Schedule: Tracks:

    • Book Value per Share

    • ROE

    • ROA

    • Dividend trajectory


Valuation Methods

Valuation uses three methods appropriate for banks:

  • P/E (18x)

  • P/B (2.8x)

  • DDM

With a CAPM-derived Cost of Equity of 11.14% using:

  • Beta of 0.80

  • 10-year G-Sec rate of 6.74%


FCFF and WACC are deliberately excluded, with a clear rationale explained: they are structurally inapplicable to financial institutions where debt is the raw material, not a financing choice.


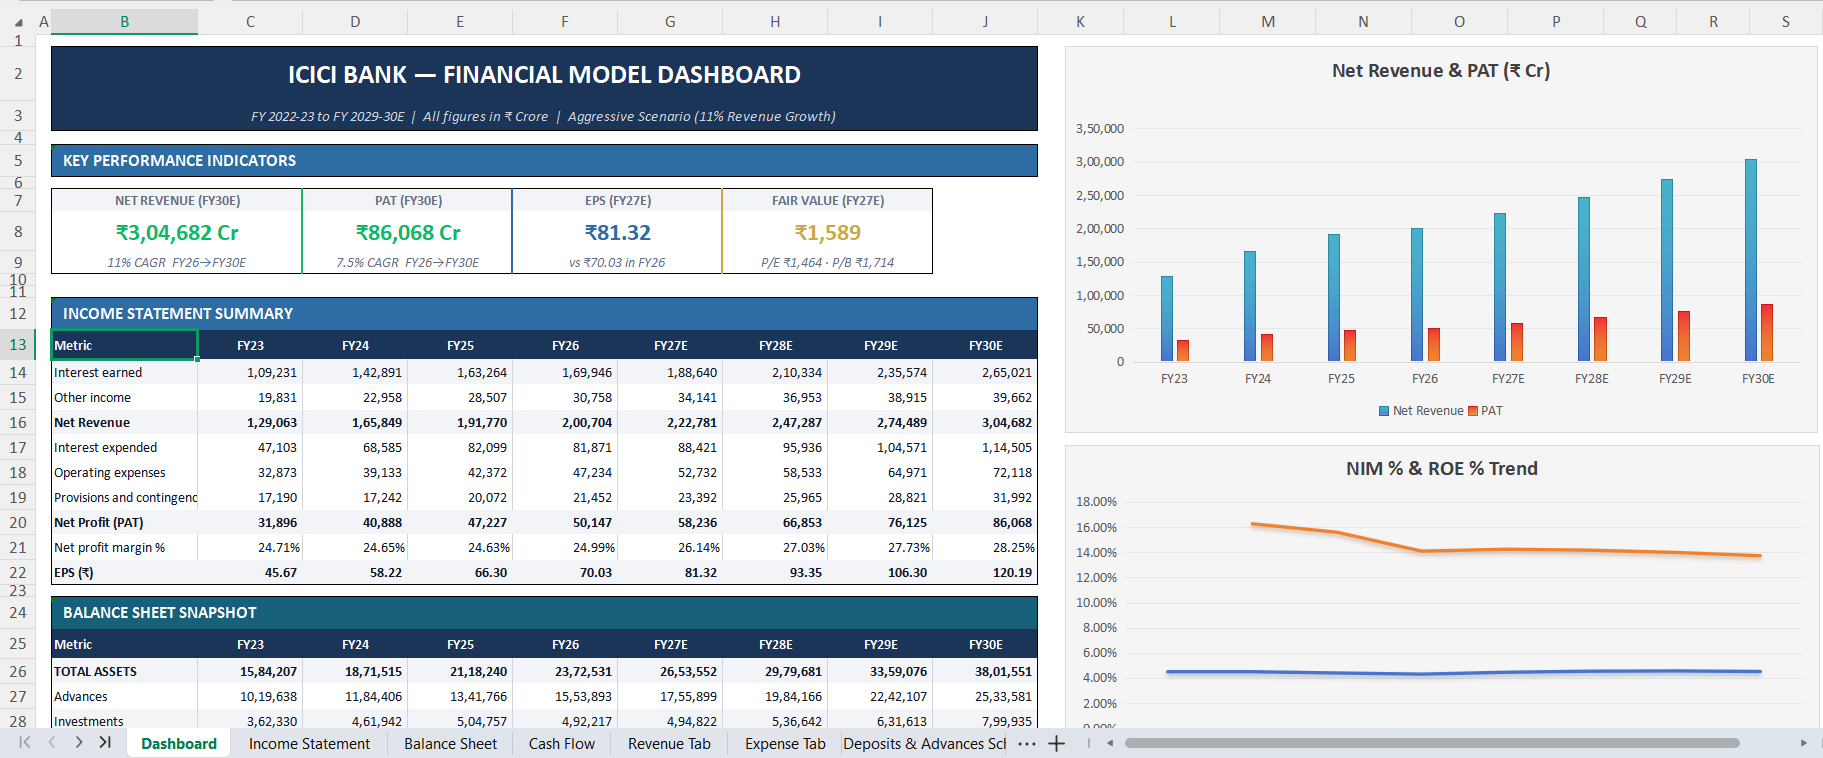
The blended fair value arrives at ₹1,589 per share for FY27E.


Scenario Framework

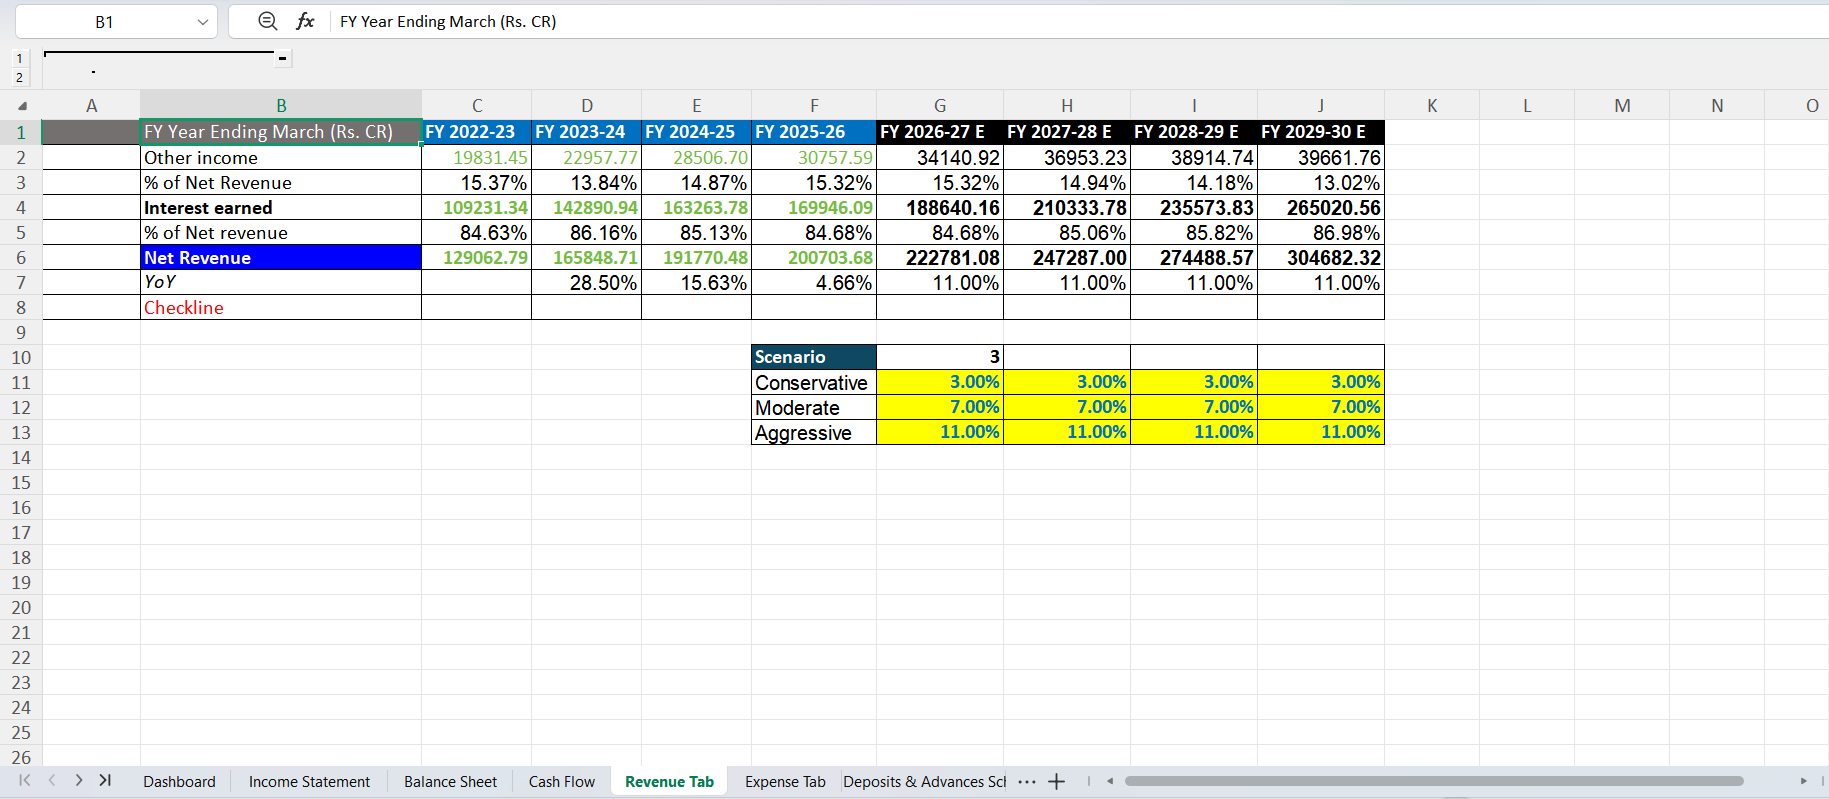
The model runs a 3-scenario framework:

  • Conservative (3%)

  • Moderate (7%)

  • Aggressive (11%)

These scenarios are switchable via a single CHOOSE function.

Projections run from FY27E to FY30E, with:

  • Interest Earned modelled at 11% growth (consistent with 13% advance CAGR minus ~2% yield compression)

  • Interest Expended stepped from 8% to 9.5% to reflect realistic deposit repricing


Executive Dashboard

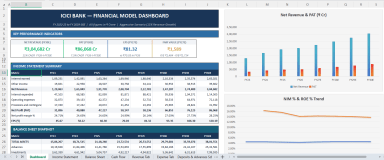
The model includes an executive Dashboard with:

  • KPI cards

  • Revenue & PAT bar chart

  • NIM & ROE trend chart


Pivot Analysis

A Pivot Analysis sheet with three structured tables decomposing:

  • NII

  • NIM

  • Yield

  • Spread

  • YoY growth rates across all metrics

This makes the model presentation-ready for:

  • Equity research

  • Credit analysis

  • Academic submissions

This Best Practice includes
1 Power point and 1 excel file

Kislay Singh offers you this Best Practice for free!

download for free

Add to bookmarks

Discuss

Further information

The objective of this financial model is to provide a comprehensive banking valuation framework that enables users to forecast financial performance, analyze Net Interest Income (NII), Net Interest Margin (NIM), asset quality, deposits, and loan growth, while estimating intrinsic value using Price-to-Book (P/B), Price-to-Earnings (P/E), and Dividend Discount Model (DDM). It is designed for finance students, equity research professionals, investors, and anyone looking to understand banking financial modelling in Excel.

Equity research and investment analysis of banking institutions.
Learning and practicing banking-specific financial modelling in Microsoft Excel.
Valuation of commercial banks using P/B, P/E, and Dividend Discount Model (DDM).
Forecasting key banking metrics such as Net Interest Income (NII), Net Interest Margin (NIM), loan growth, deposits, CASA ratio, and asset quality.
Scenario and sensitivity analysis for investment decision-making.
Academic projects, interview preparation, and financial modelling training.

Valuation of non-banking companies such as manufacturing, technology, retail, or FMCG firms.
DCF (FCFF/FCFE) valuation, which is generally not appropriate for commercial banks.
Credit risk modelling, stress testing, Basel III/IV regulatory capital modelling, or IFRS 9 Expected Credit Loss (ECL) modelling.
Live market data analysis or automated financial data updates, as inputs require manual updates.
Professional investment advice or portfolio management decisions without independent analysis and due diligence.


0.0 / 5 (0 votes)

please wait...