
Publication number: ELQ-67743-1
View all versions & Certificate

CleanTech Startup Financial Model
5 Year 3 Statement Excel spreadsheet for tracking the financial performance of a CleanTech Startup.
 by AllFinancialModels
AllFinancialModels offer a curated selection of high-quality yet financial model templates designed to support a wide range of business needs.Follow
A financial model for a cleantech startup is a comprehensive tool that provides a detailed financial projection of the company's operations, typically for 3-5 years. This model includes key financial statements such as the income statement, cash flow statement, and balance sheet, along with key metrics to assess the company's financial health and performance. Additionally, it takes into consideration the expenses of "technology scouting," "acceleration & immersion," "access to finance," and "consultancy & project management," which are crucial for the growth and development of a cleantech startup.
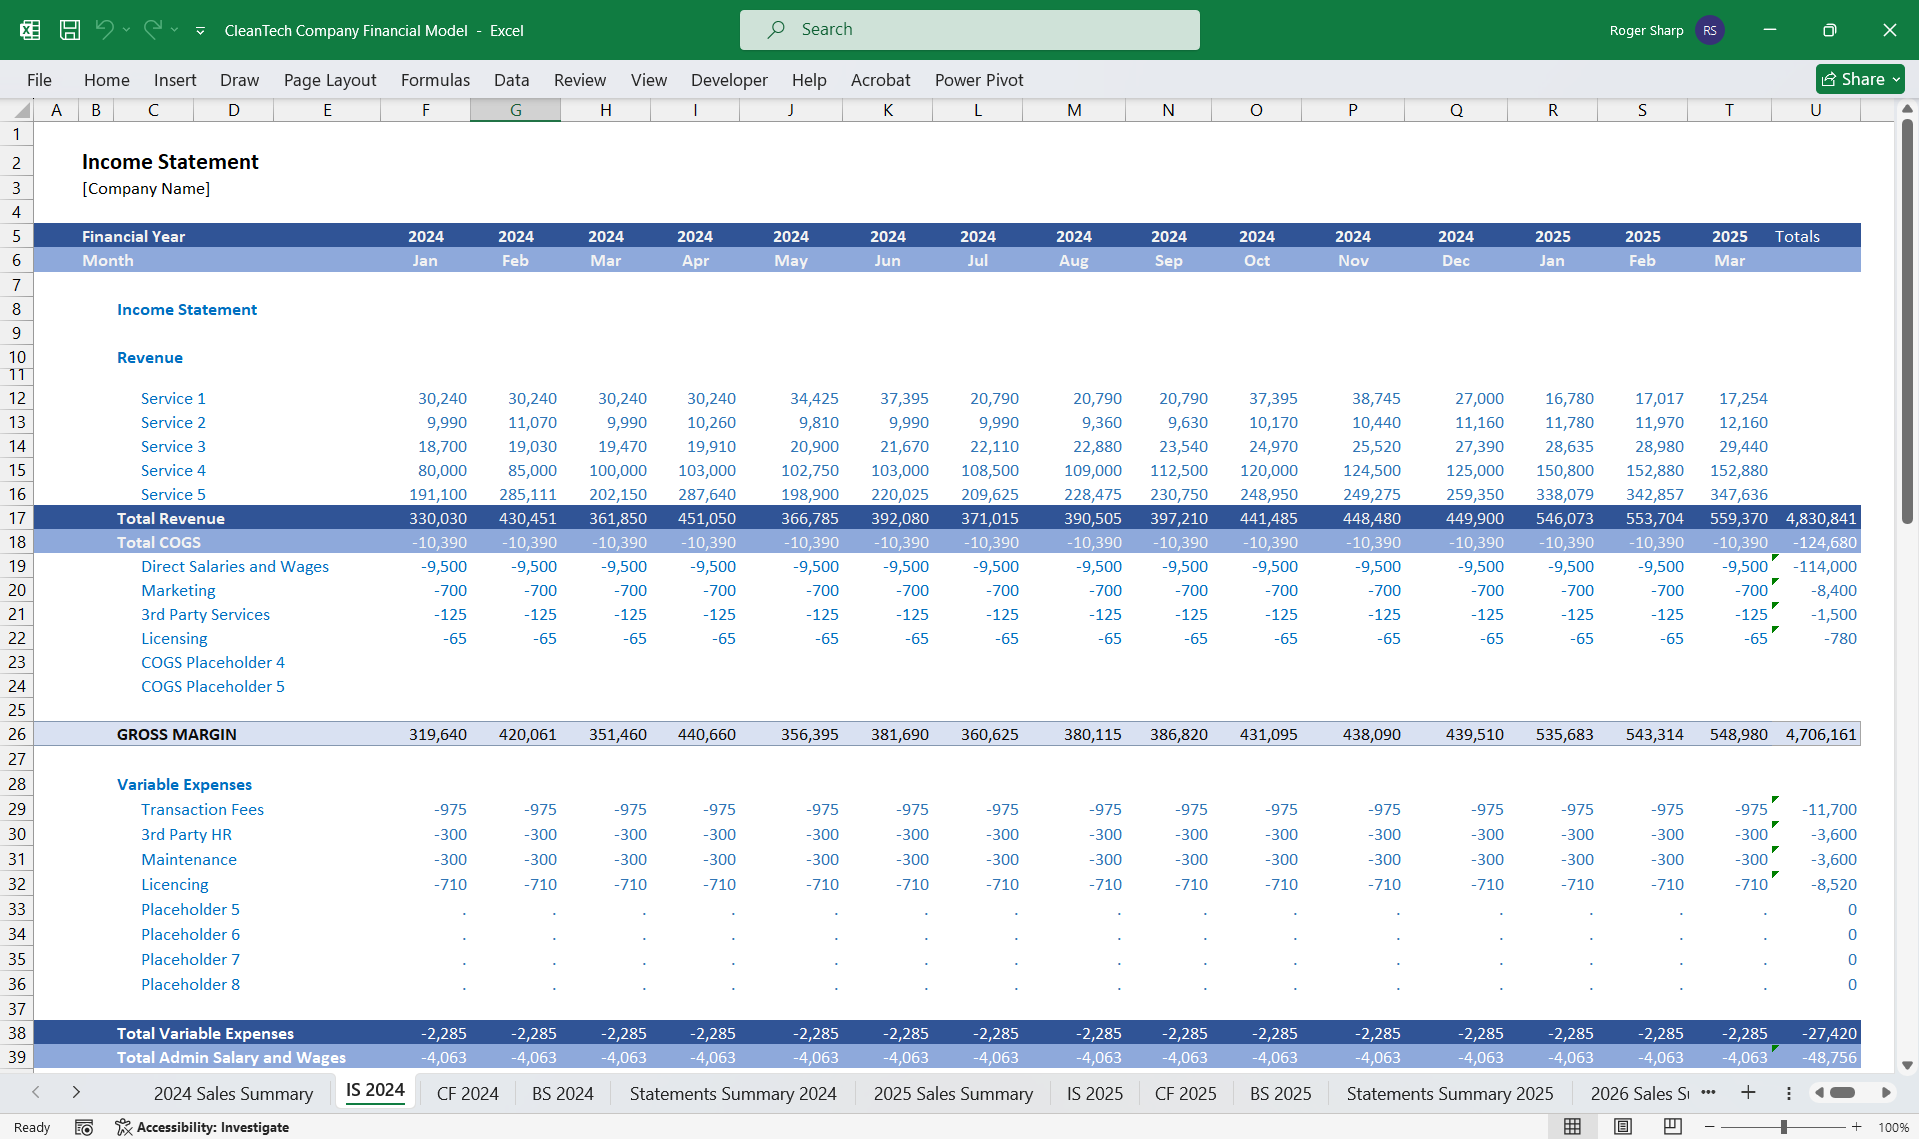
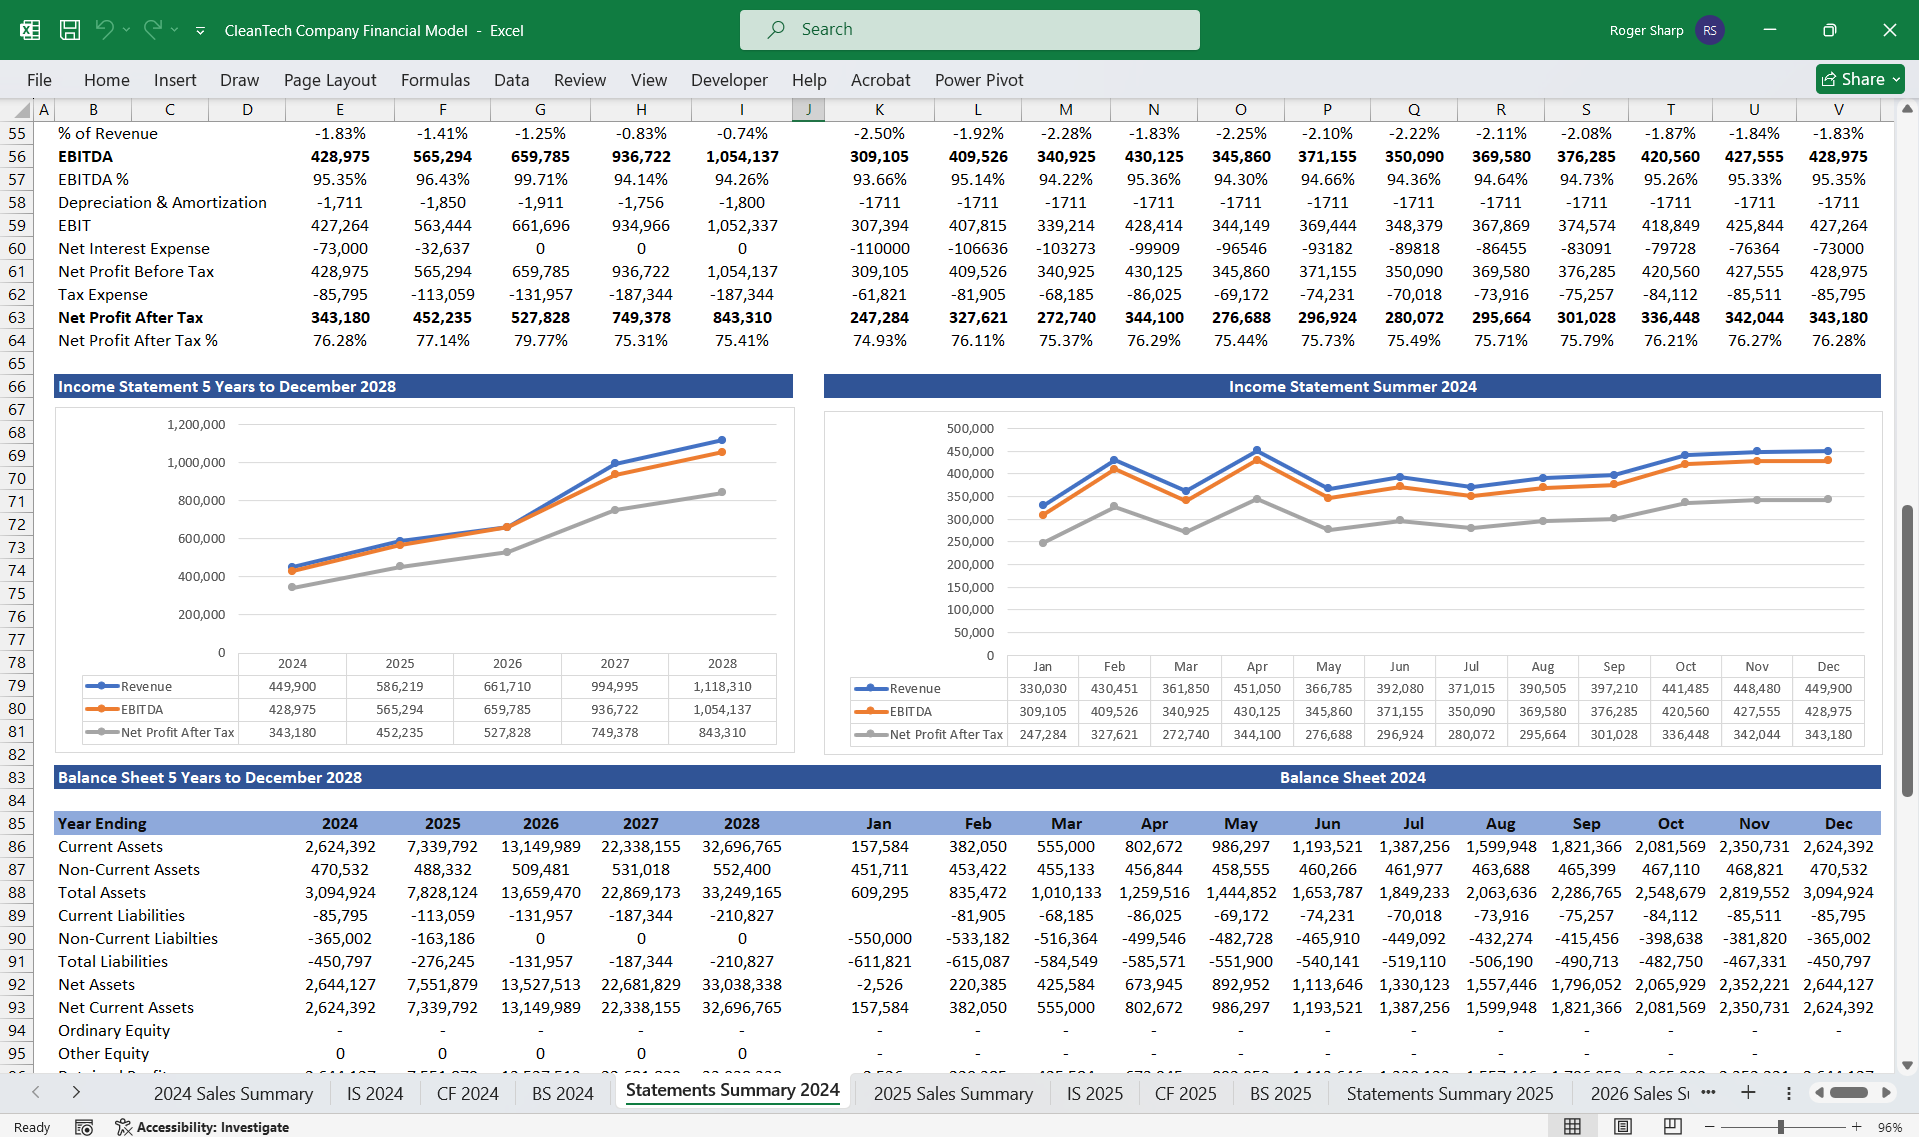
1. Income Statement
The income statement, also known as the profit and loss statement, shows the company's revenues and expenses over a specific period. Key components include:
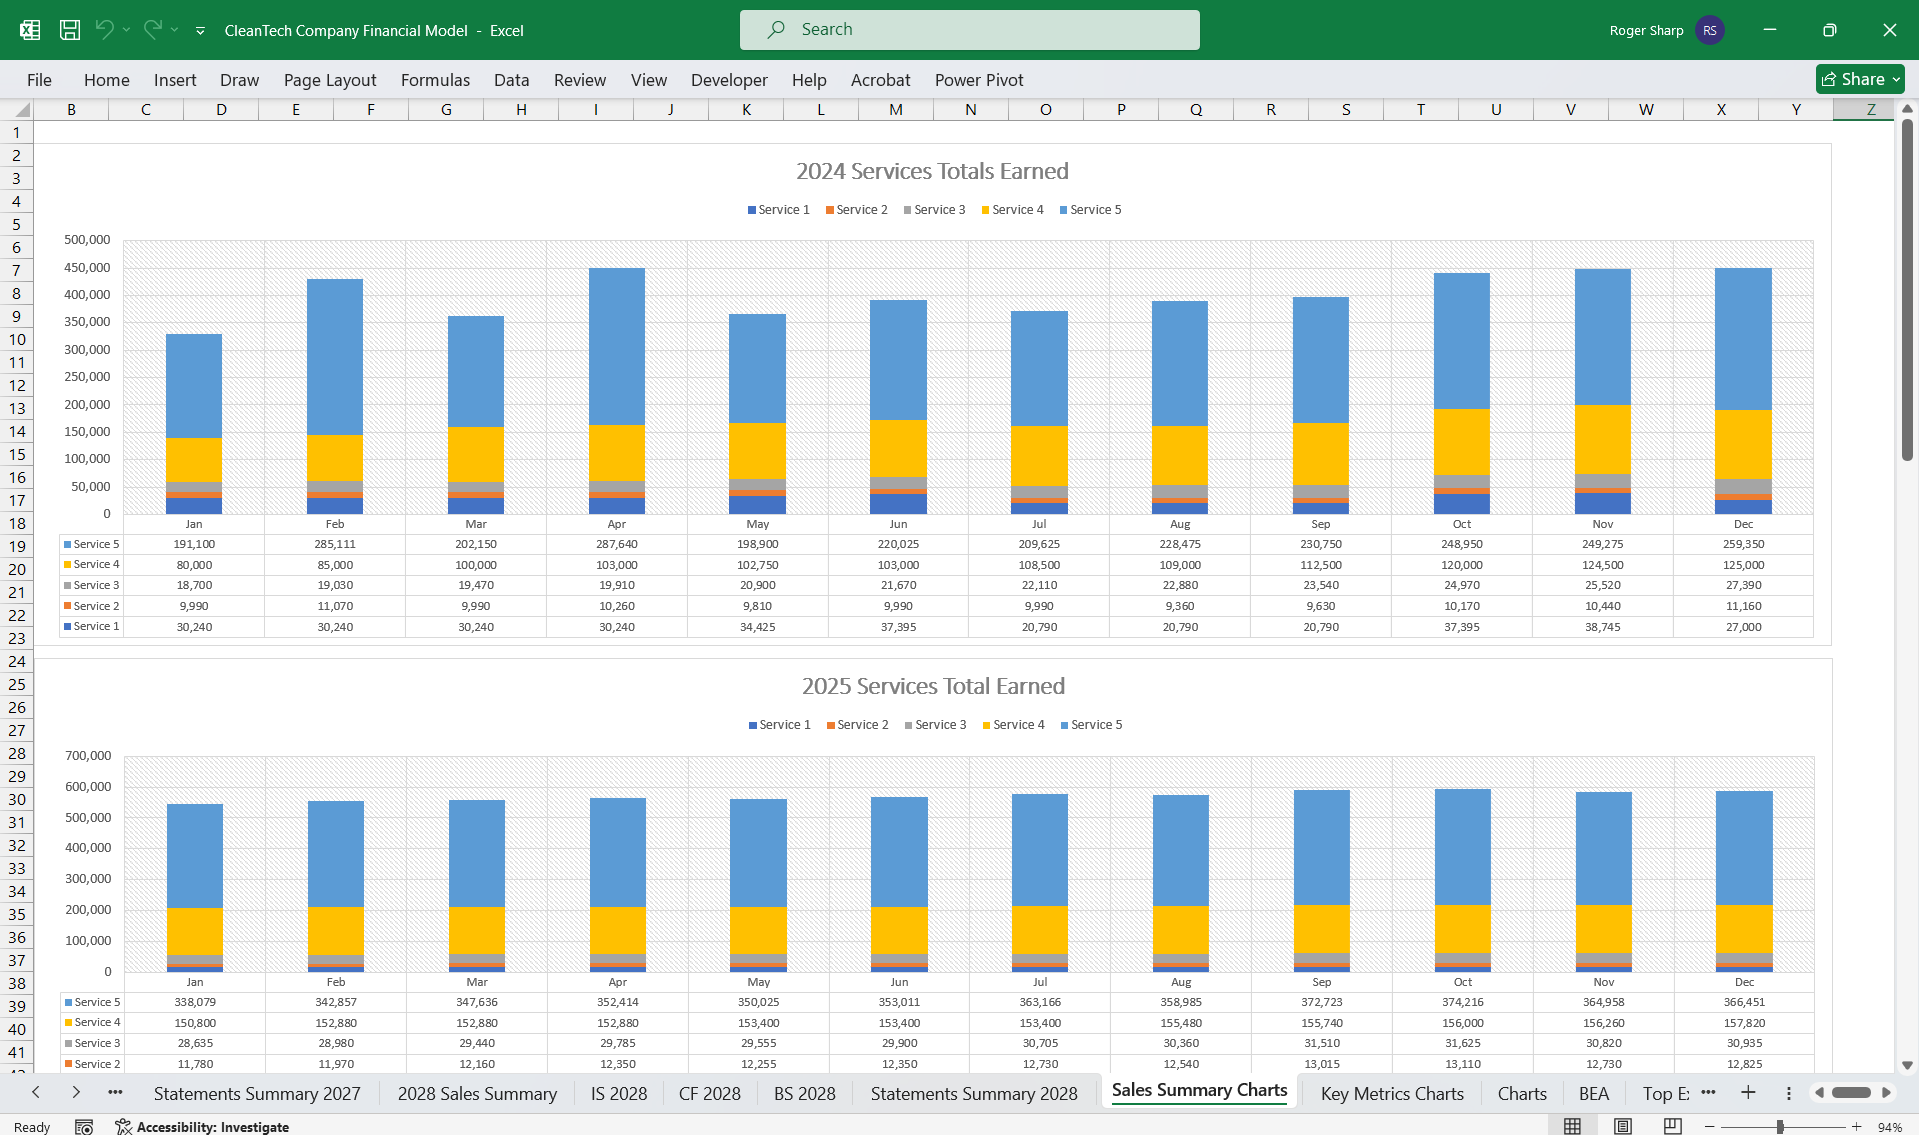
- Revenue:
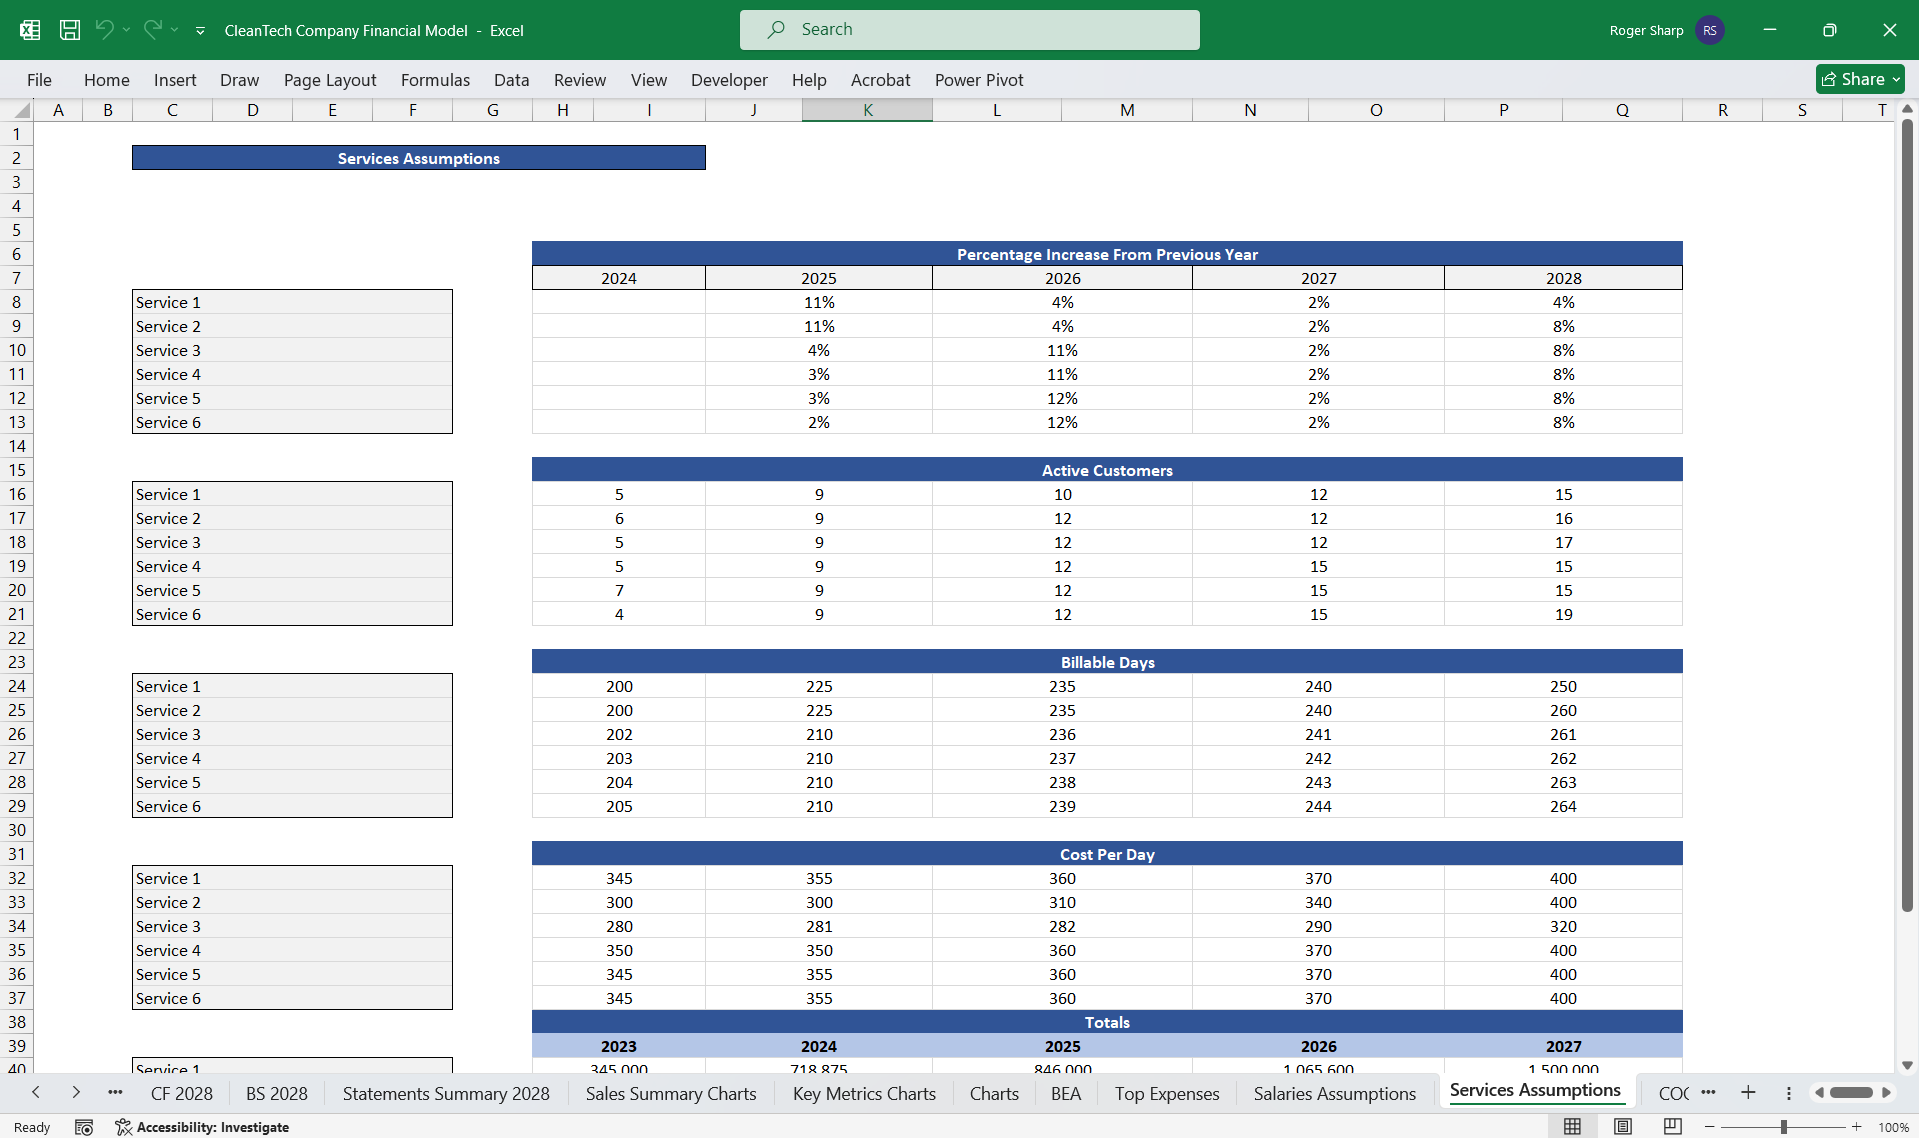
- Technology Scouting Revenue: Income from identifying and evaluating new technologies.
- Acceleration & Immersion Revenue: Fees from programs designed to accelerate startup growth.
- Access to Finance Revenue: Fees for helping startups secure funding.
- Consultancy & Project Management Revenue: Income from providing expert advice and managing projects.
- Cost of Goods Sold (COGS): Direct costs attributable to the production of the goods sold by the company.
- Technology Scouting COGS: Costs associated with research and evaluation.
- Acceleration & Immersion COGS: Costs of running acceleration programs.
- Access to Finance COGS: Costs related to financial consulting services.
- Consultancy & Project Management COGS: Direct costs of consultancy and project management.
- Gross Profit: Revenue - COGS.
- Operating Expenses:
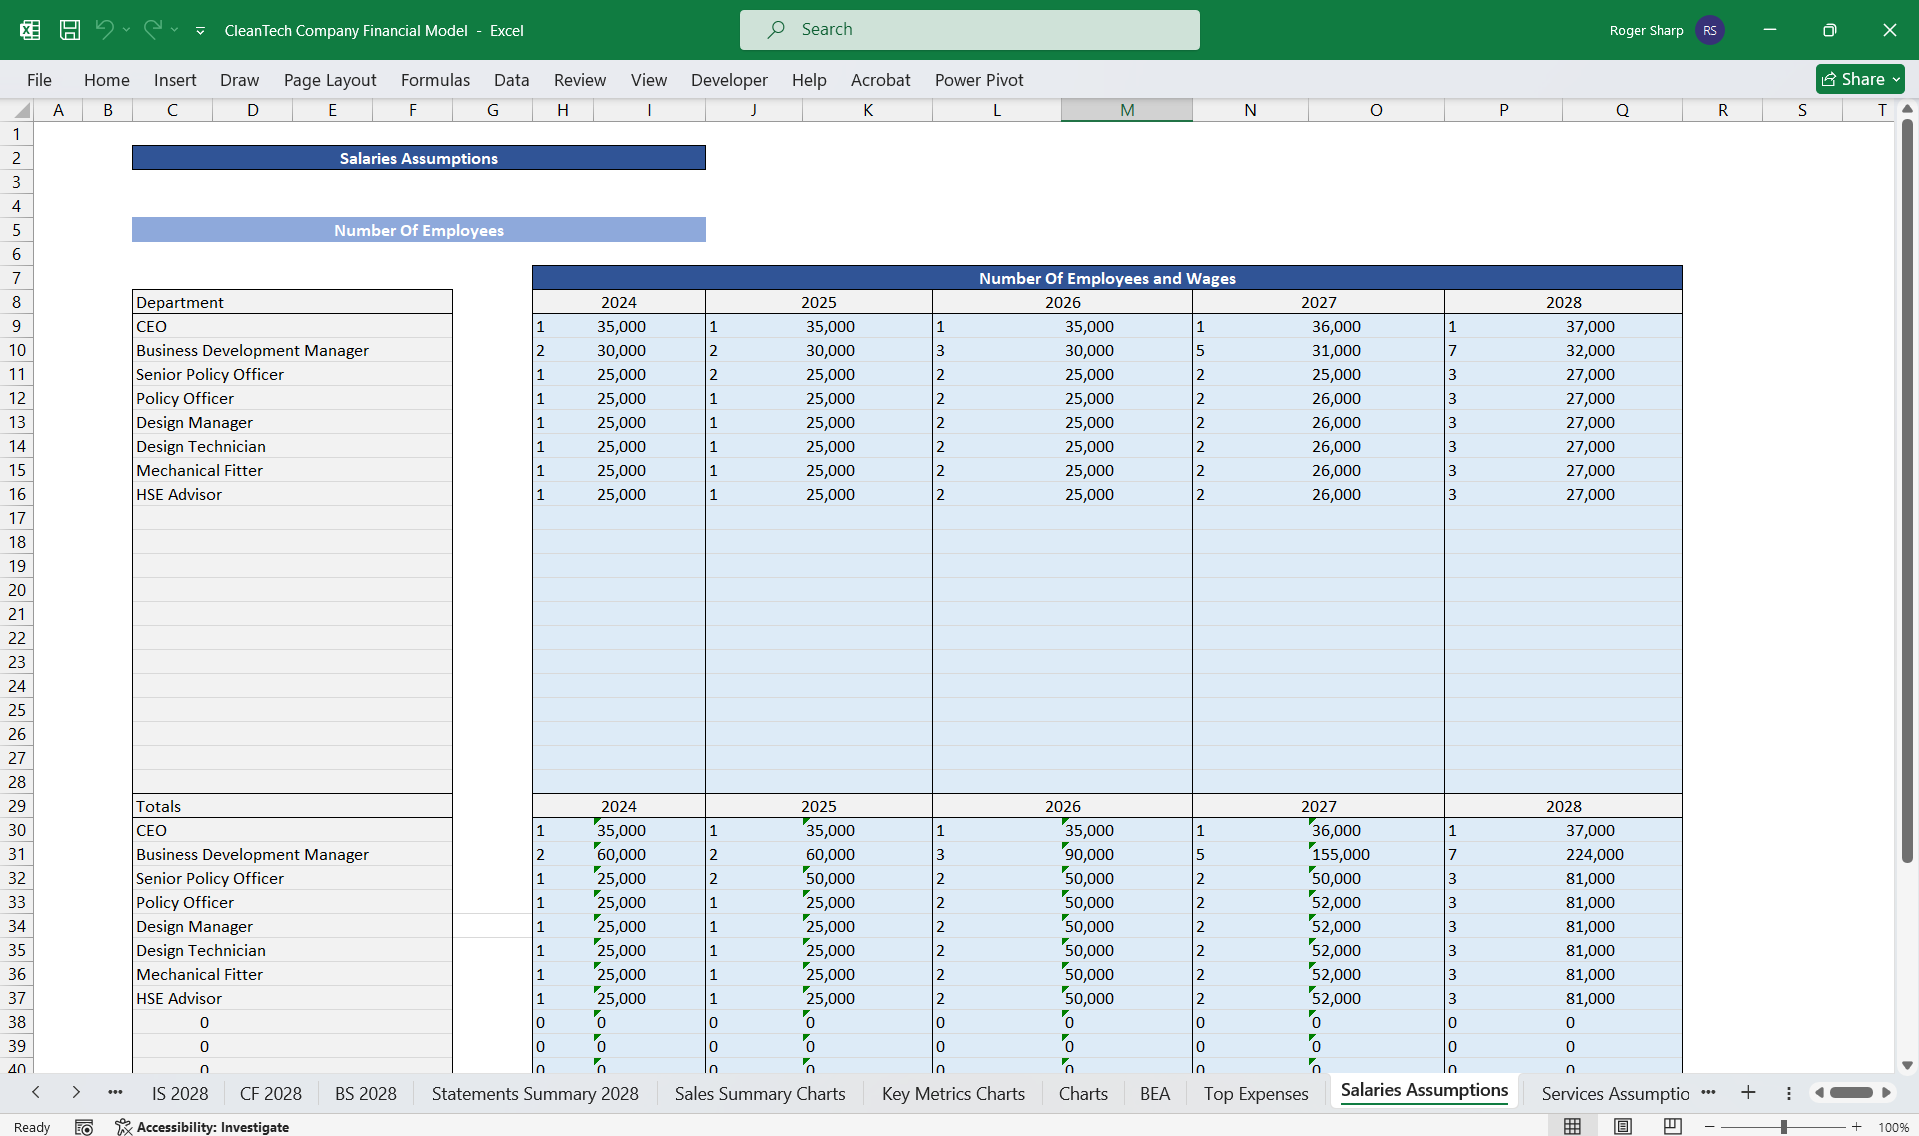
- Salaries and Wages: Compensation for employees.
- R&D Expenses: Costs associated with research and development.
- Marketing and Sales: Advertising and promotional expenses.
- General & Administrative Expenses: Office rent, utilities, and other overheads.
- EBITDA: Earnings before interest, taxes, depreciation, and amortization.
- Depreciation & Amortization: Non-cash expenses representing the reduction in value of the company's assets.
- Operating Profit (EBIT): EBITDA - Depreciation & Amortization.
- Interest Expense: Cost of debt.
- Taxes: Income tax expense.
- Net Income: Operating Profit - Interest Expense - Taxes.
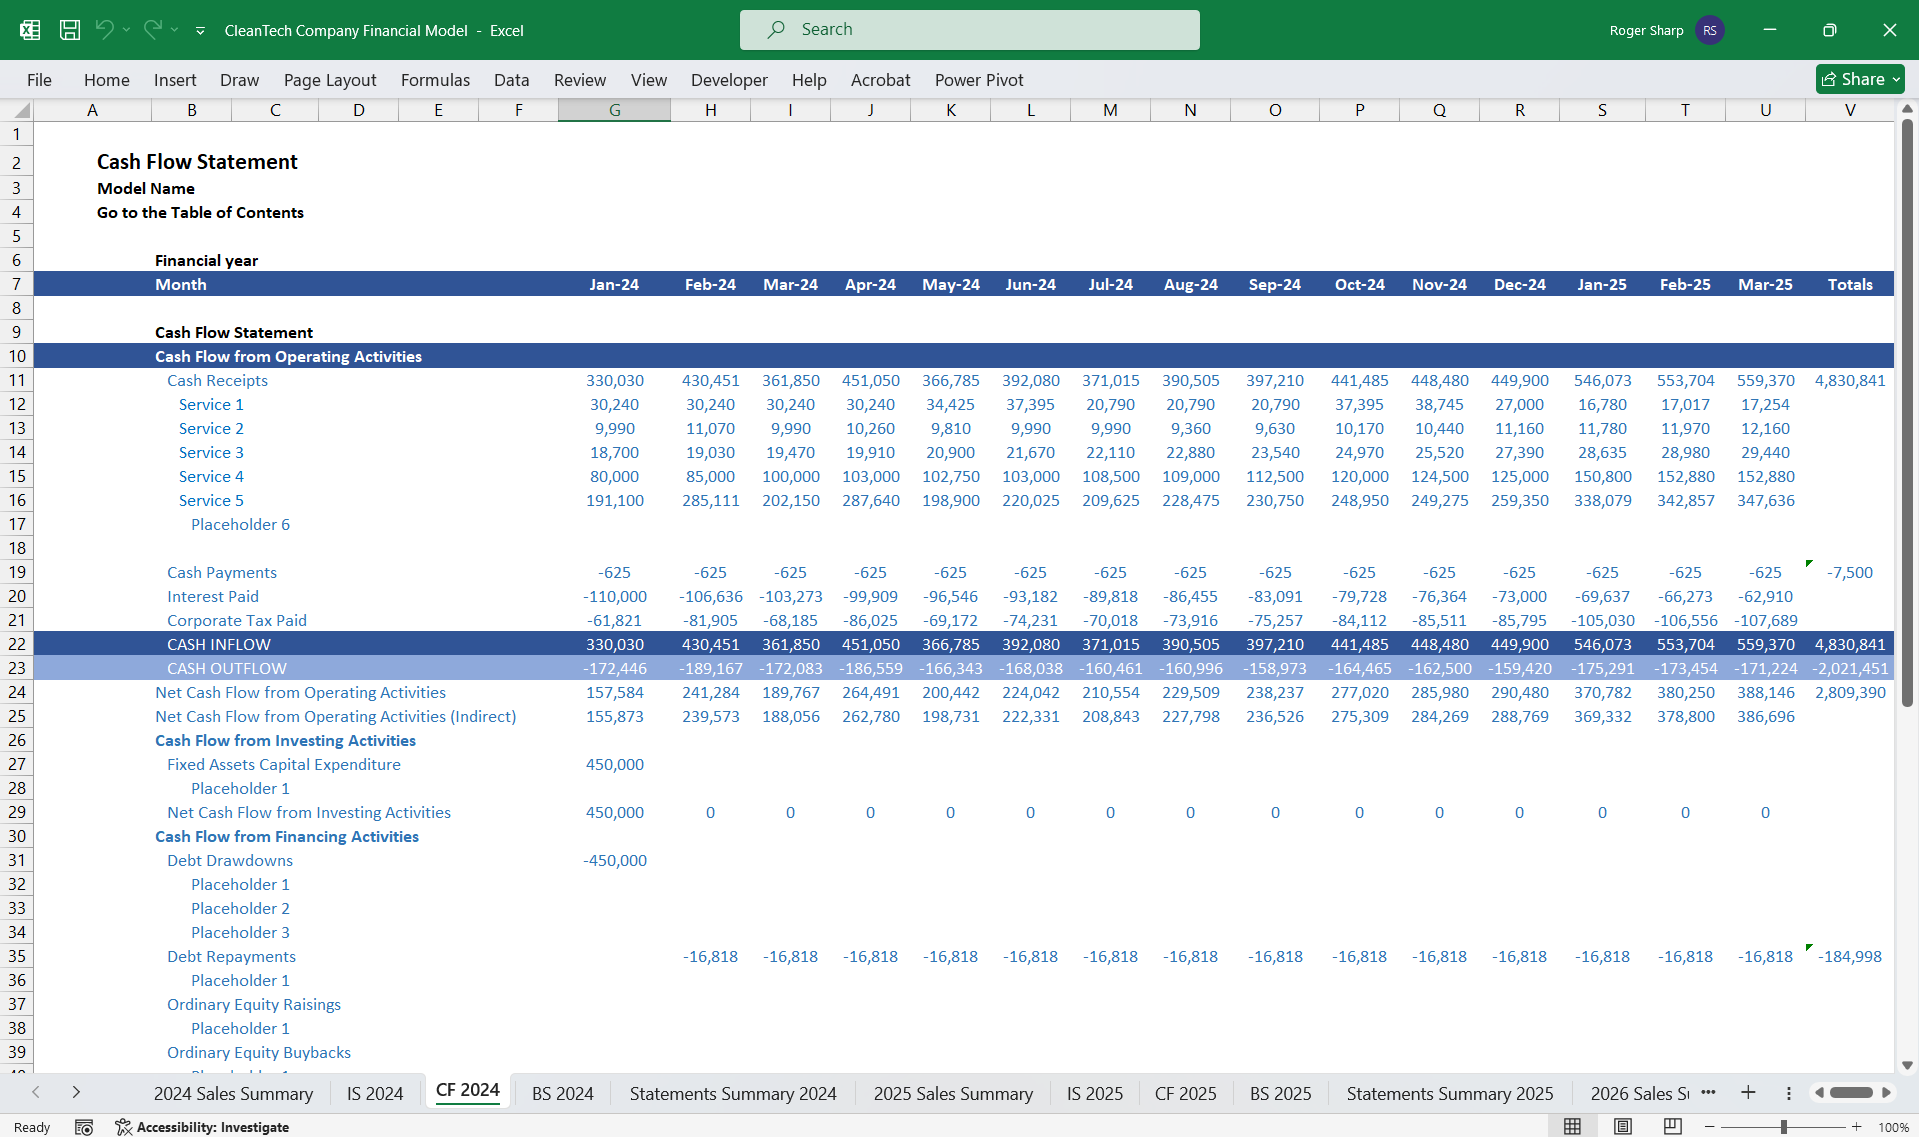
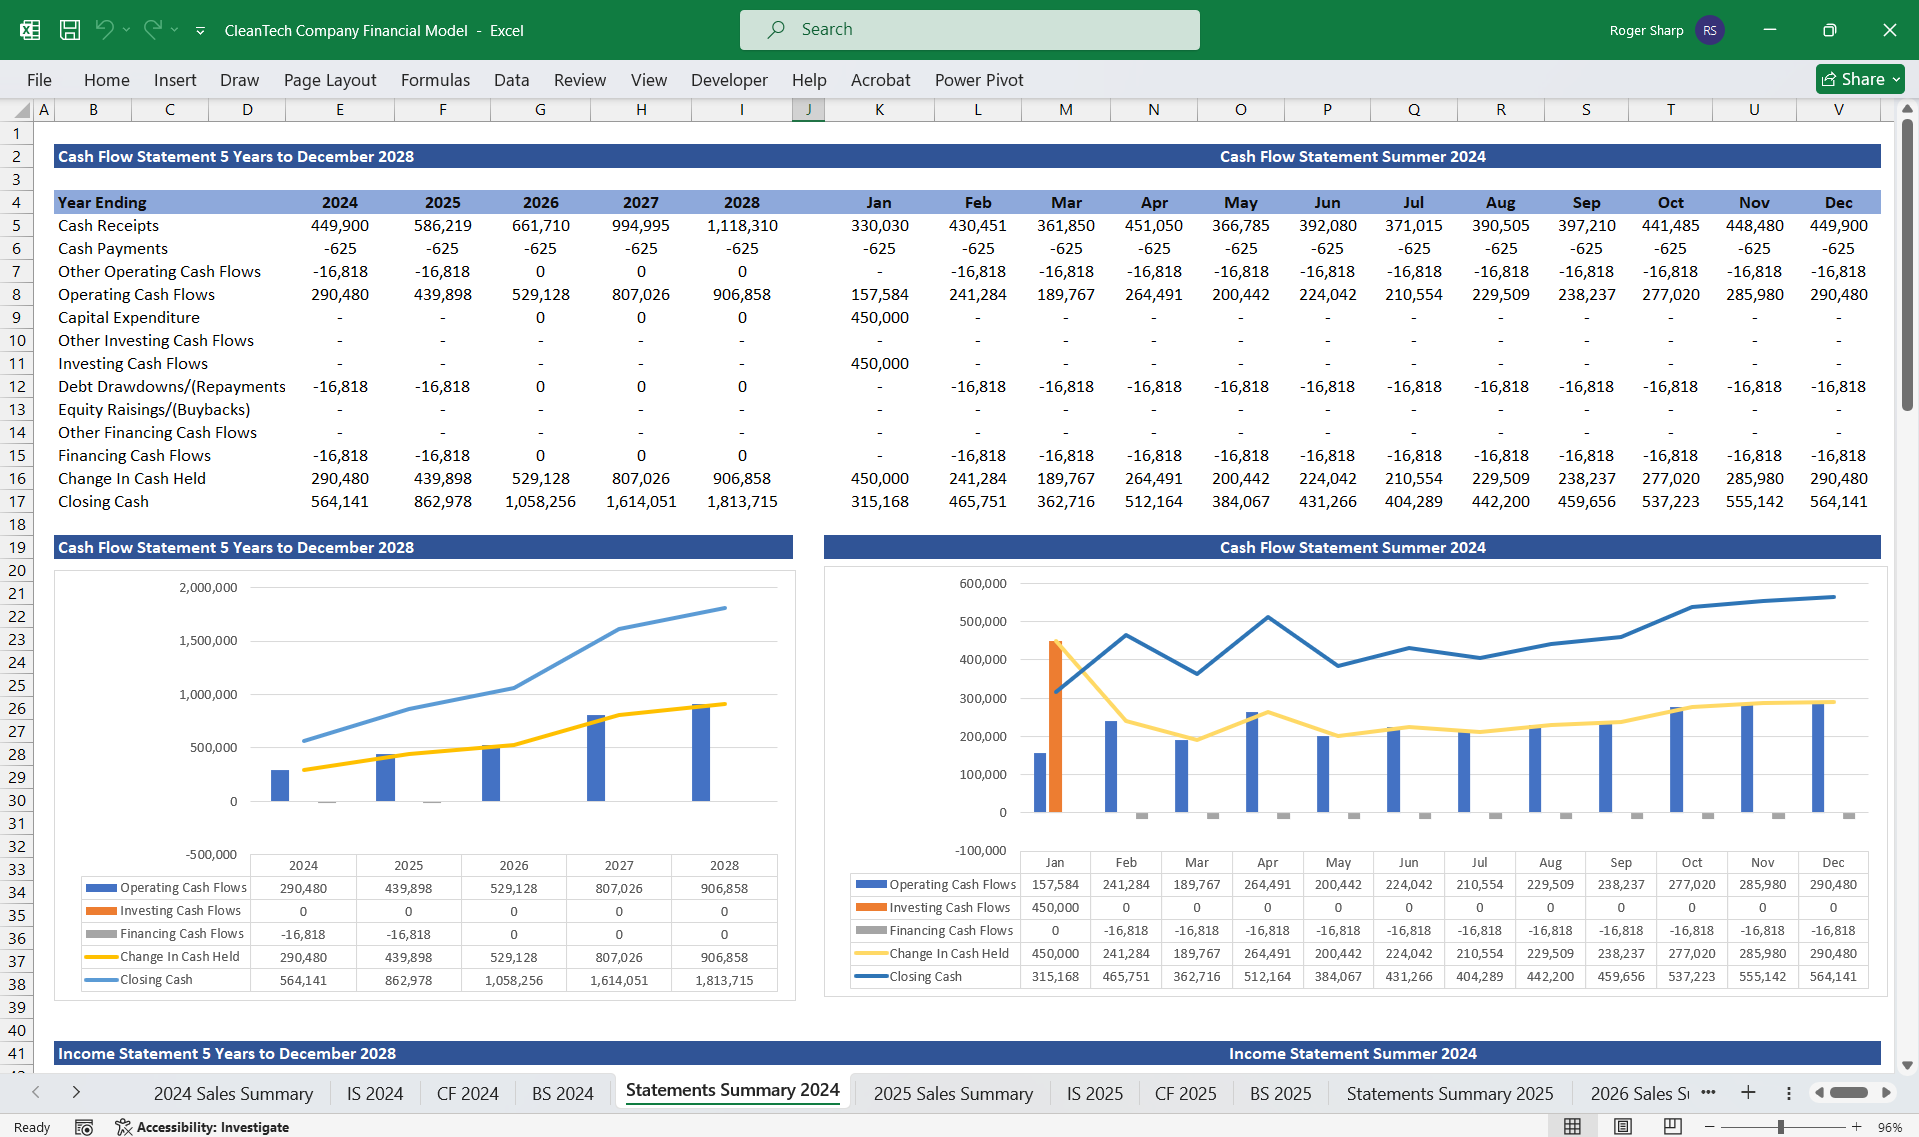
2. Cash Flow Statement
The cash flow statement outlines the inflows and outflows of cash, highlighting the liquidity of the company. It is divided into three main sections:
- Operating Activities:
- Cash receipts from customers.
- Cash payments to suppliers and employees.
- Net cash from operating activities: Adjustments for non-cash items like depreciation.
- Investing Activities:
- Purchase of equipment or technology.
- Proceeds from the sale of assets.
- Net cash used in investing activities.
- Financing Activities:
- Proceeds from issuing equity or debt.
- Repayment of loans.
- Dividend payments.
- Net cash from financing activities.
- Net Increase/Decrease in Cash: Sum of cash flows from operating, investing, and financing activities.
- Cash at Beginning of Period: Initial cash balance.
- Cash at End of Period: Final cash balance.
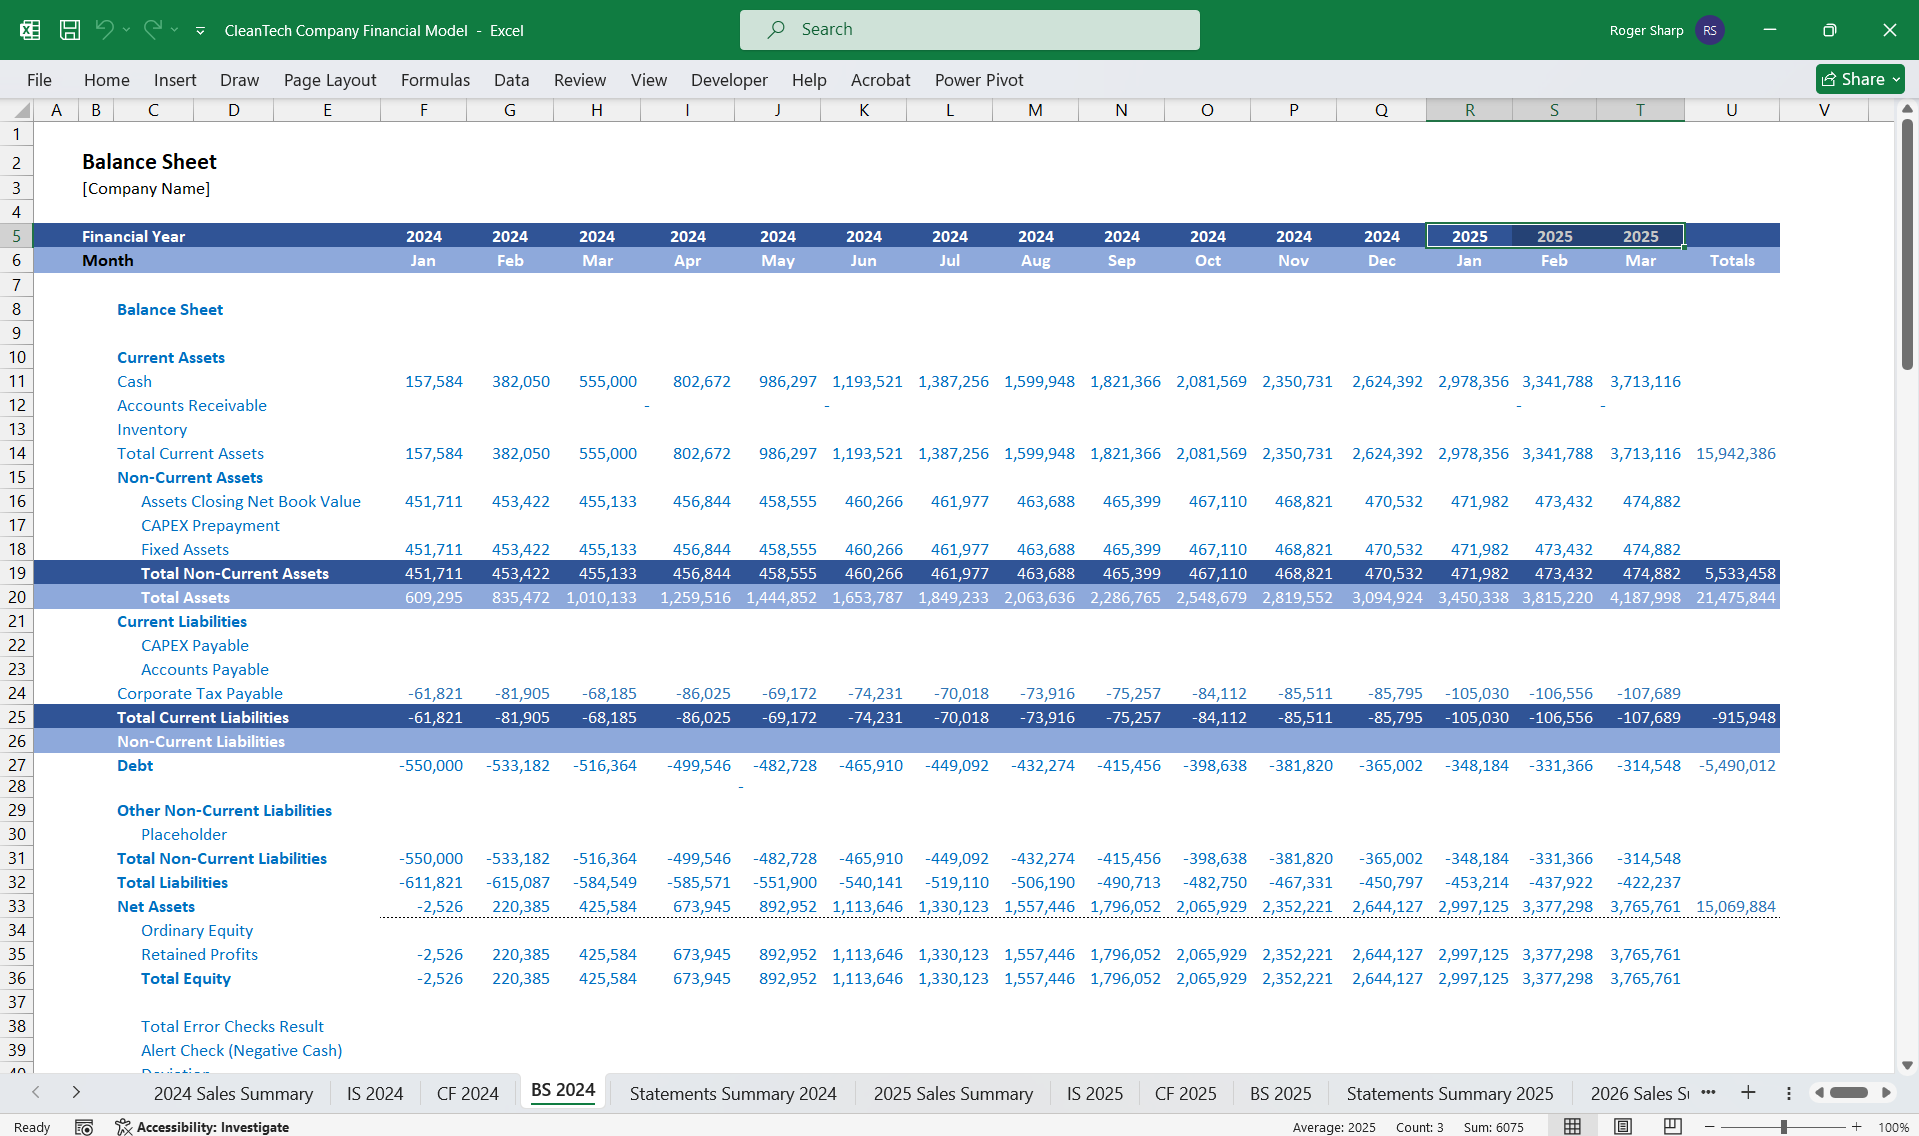
3. Balance Sheet
The balance sheet provides a snapshot of the company's financial position at a specific point in time, showing assets, liabilities, and equity.
- Assets:
- Current Assets: Cash, accounts receivable, inventory.
- Non-Current Assets: Property, plant, equipment, and intangible assets.
- Liabilities:
- Current Liabilities: Accounts payable, short-term debt.
- Non-Current Liabilities: Long-term debt, deferred tax liabilities.
- Equity:
- Shareholders' Equity: Common stock, retained earnings.
Key Metrics
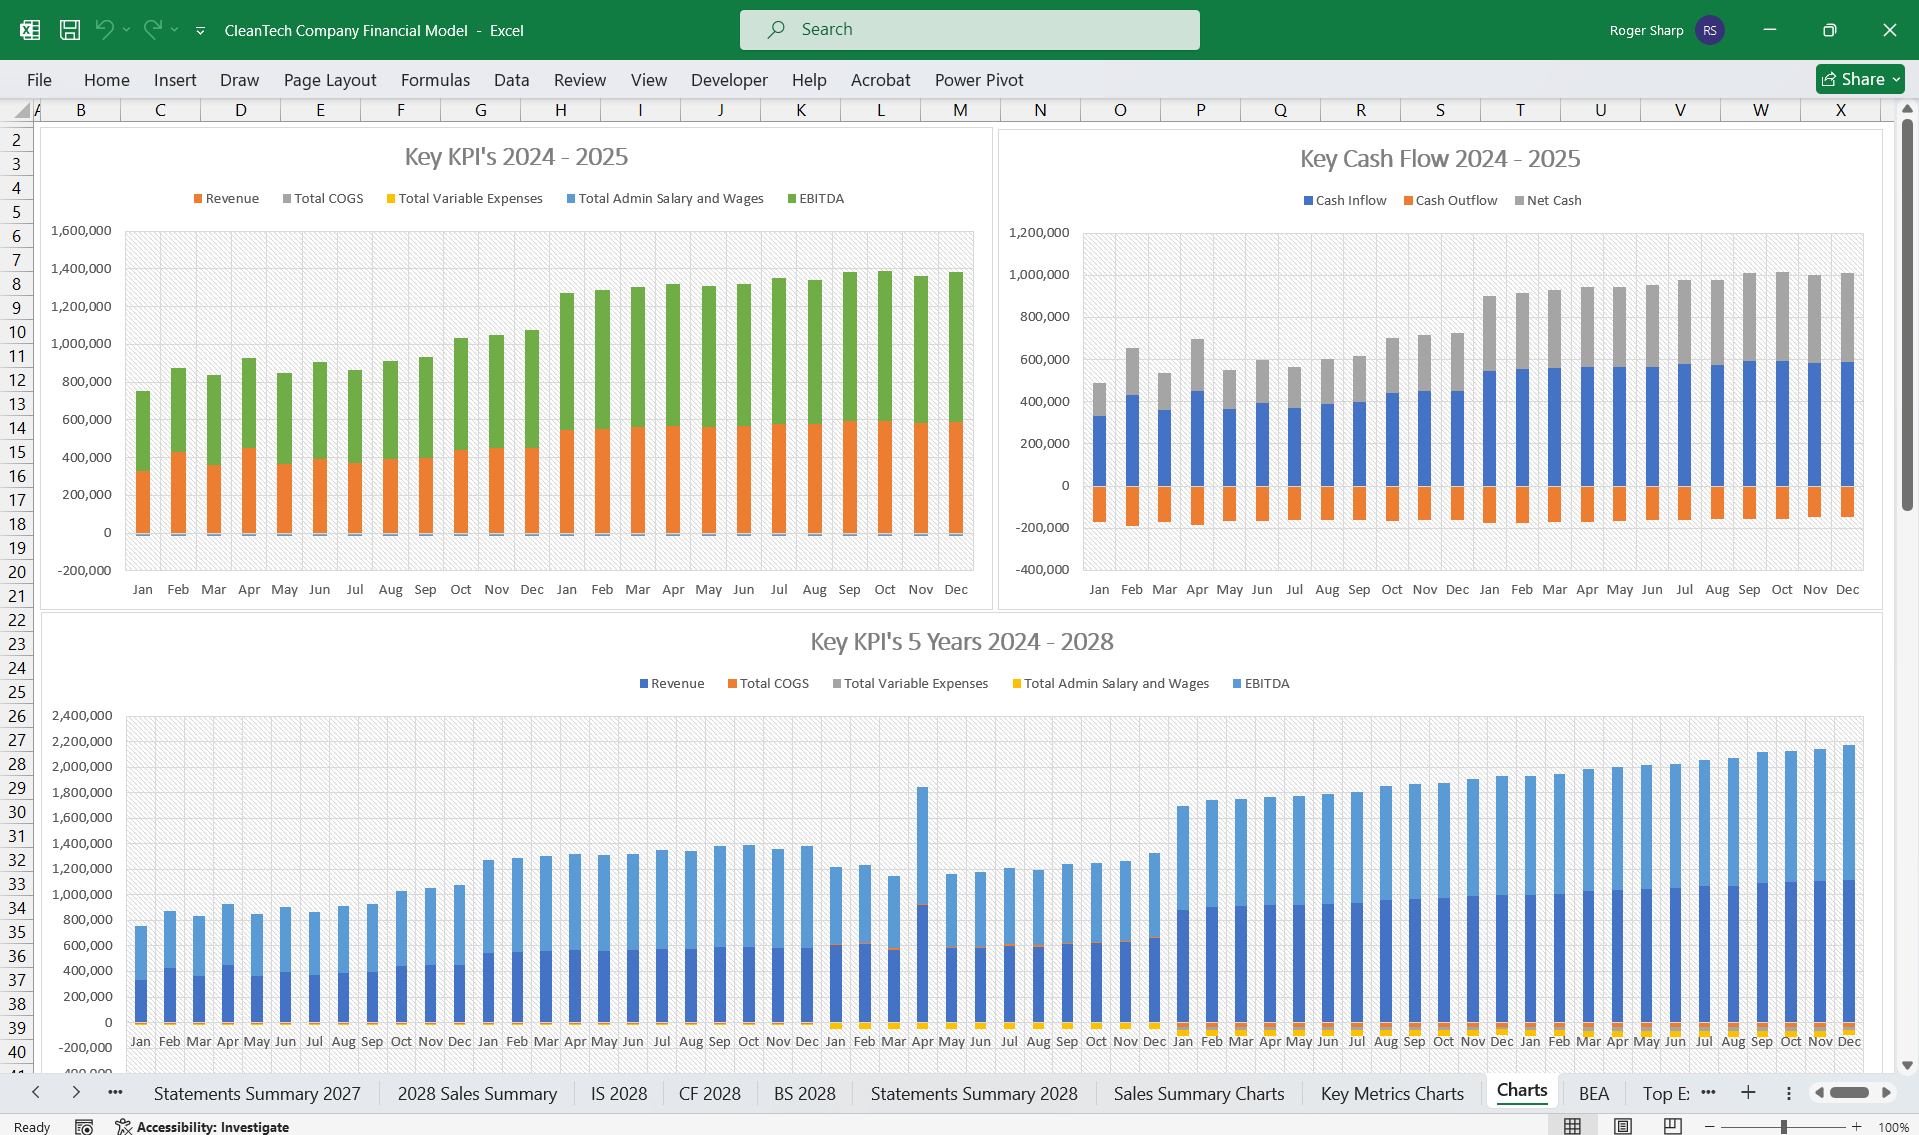
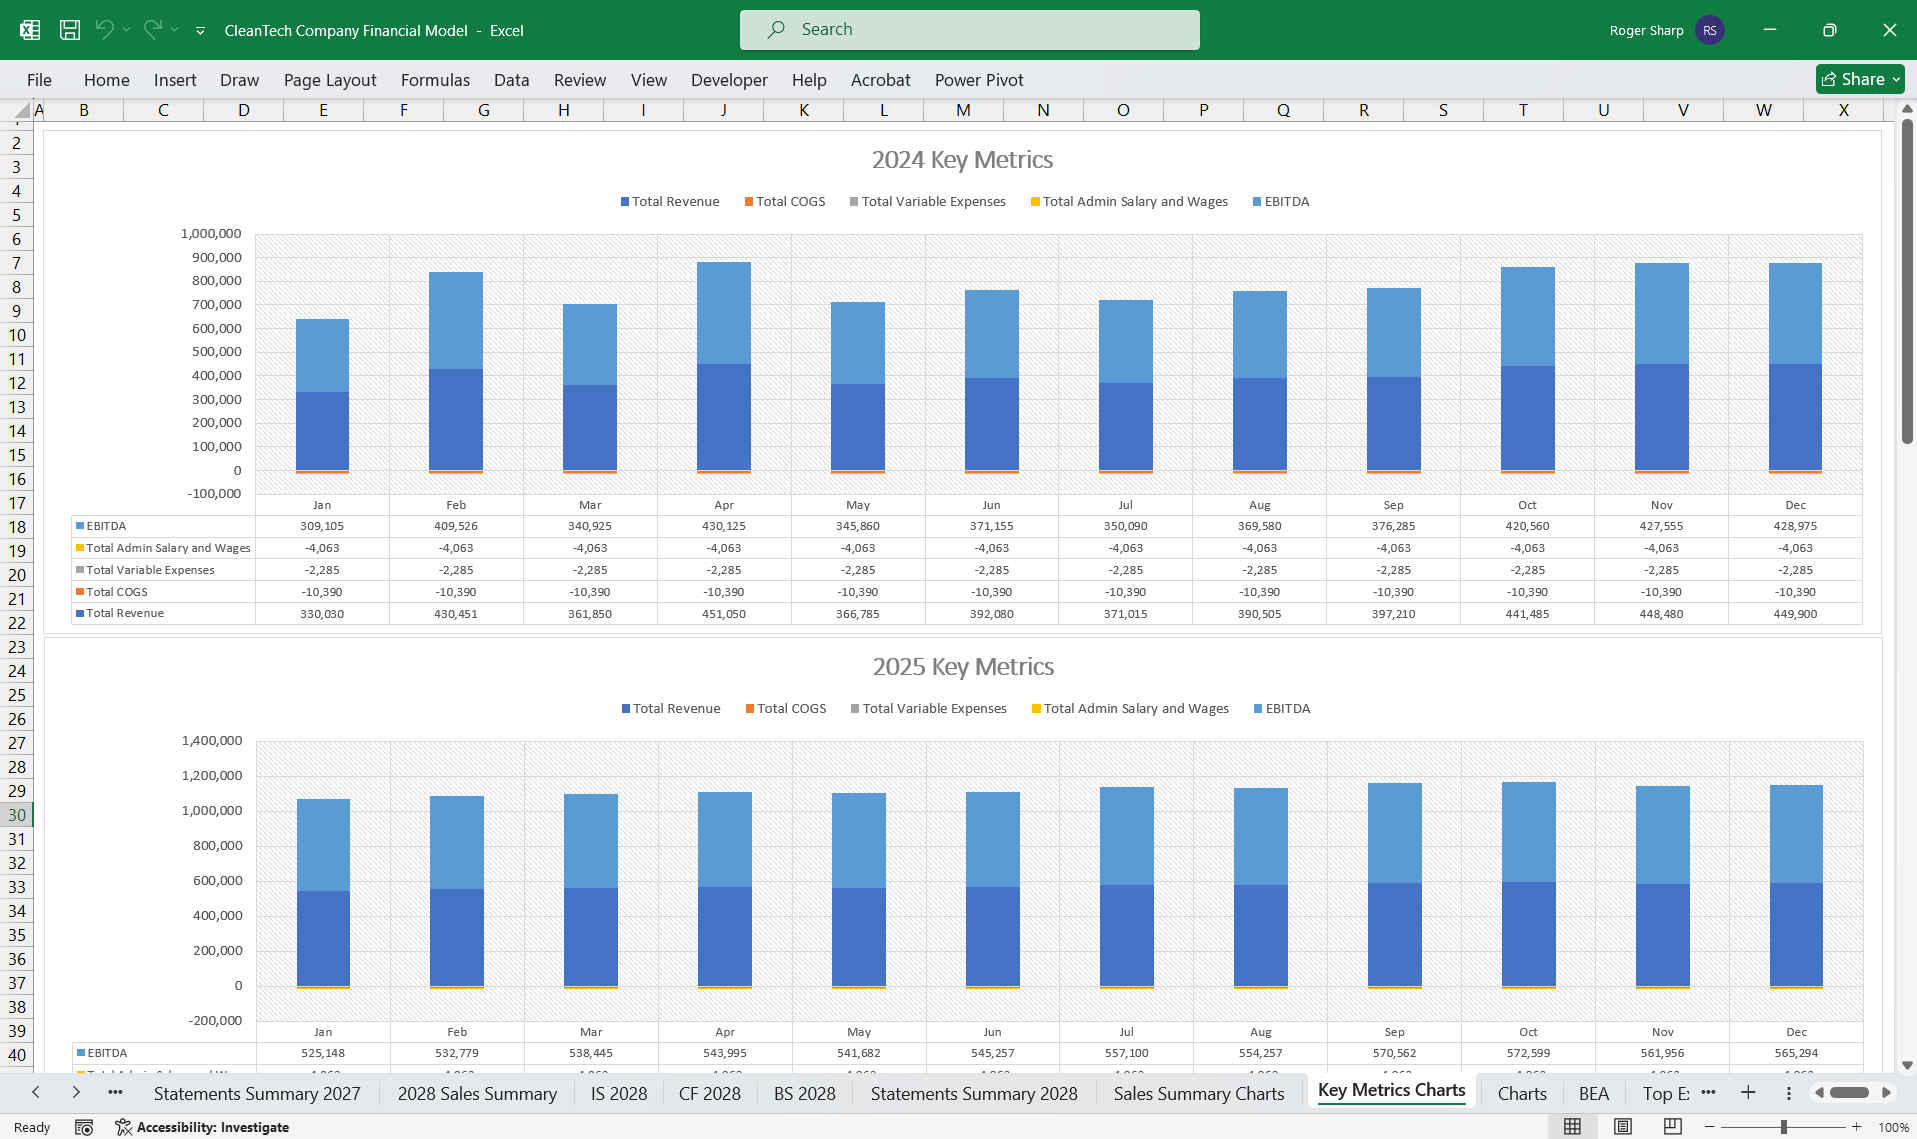
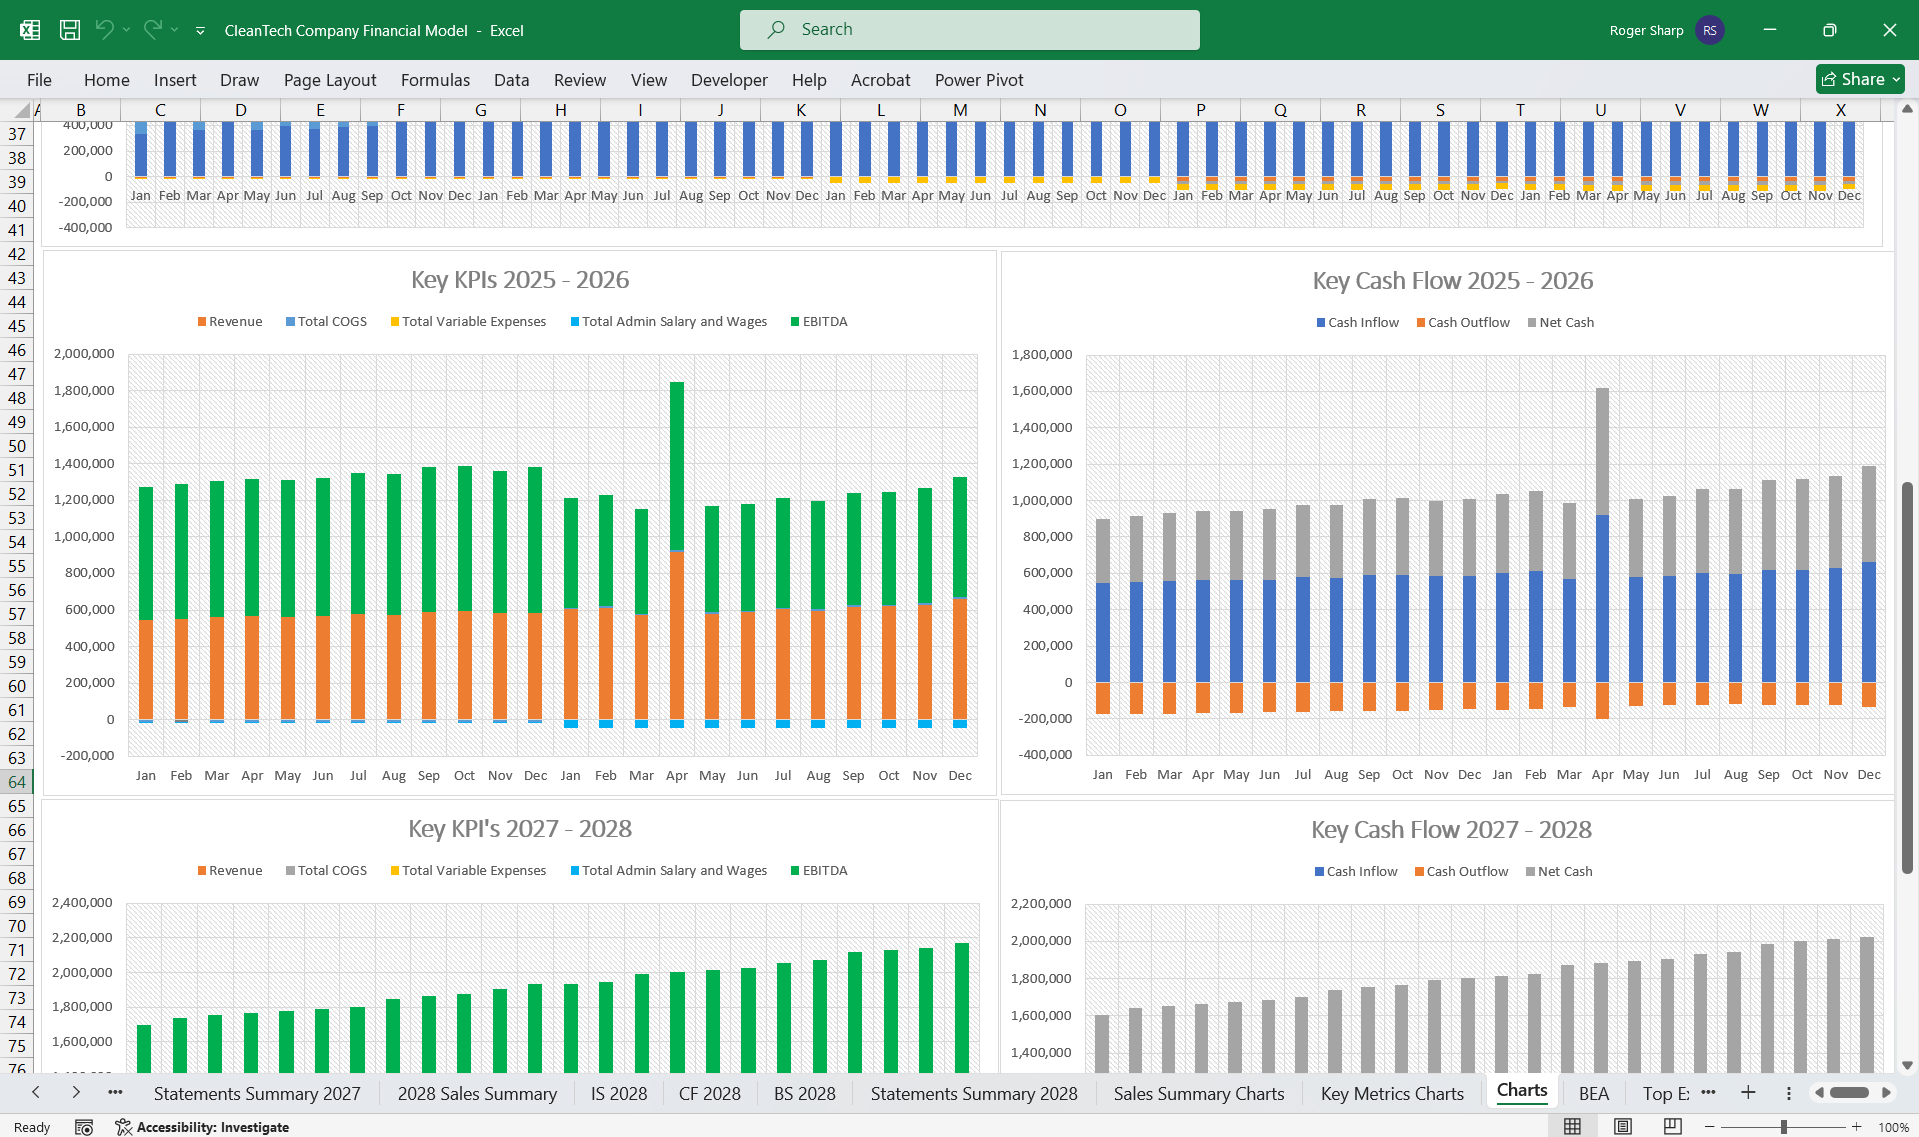
- Revenue Growth: Annual growth rate of revenues.
- EBITDA Margin: EBITDA as a percentage of revenue.
- COGS as a Percentage of Revenue: COGS divided by revenue, indicating the cost efficiency.
- Operating Cash Flow: Cash generated from operating activities.
- Net Income: Profit after all expenses have been deducted from revenue.
- Current Ratio: Current assets divided by current liabilities, indicating liquidity.
- Debt-to-Equity Ratio: Total liabilities divided by shareholders' equity, indicating financial leverage.
Specific Sections
Technology Scouting
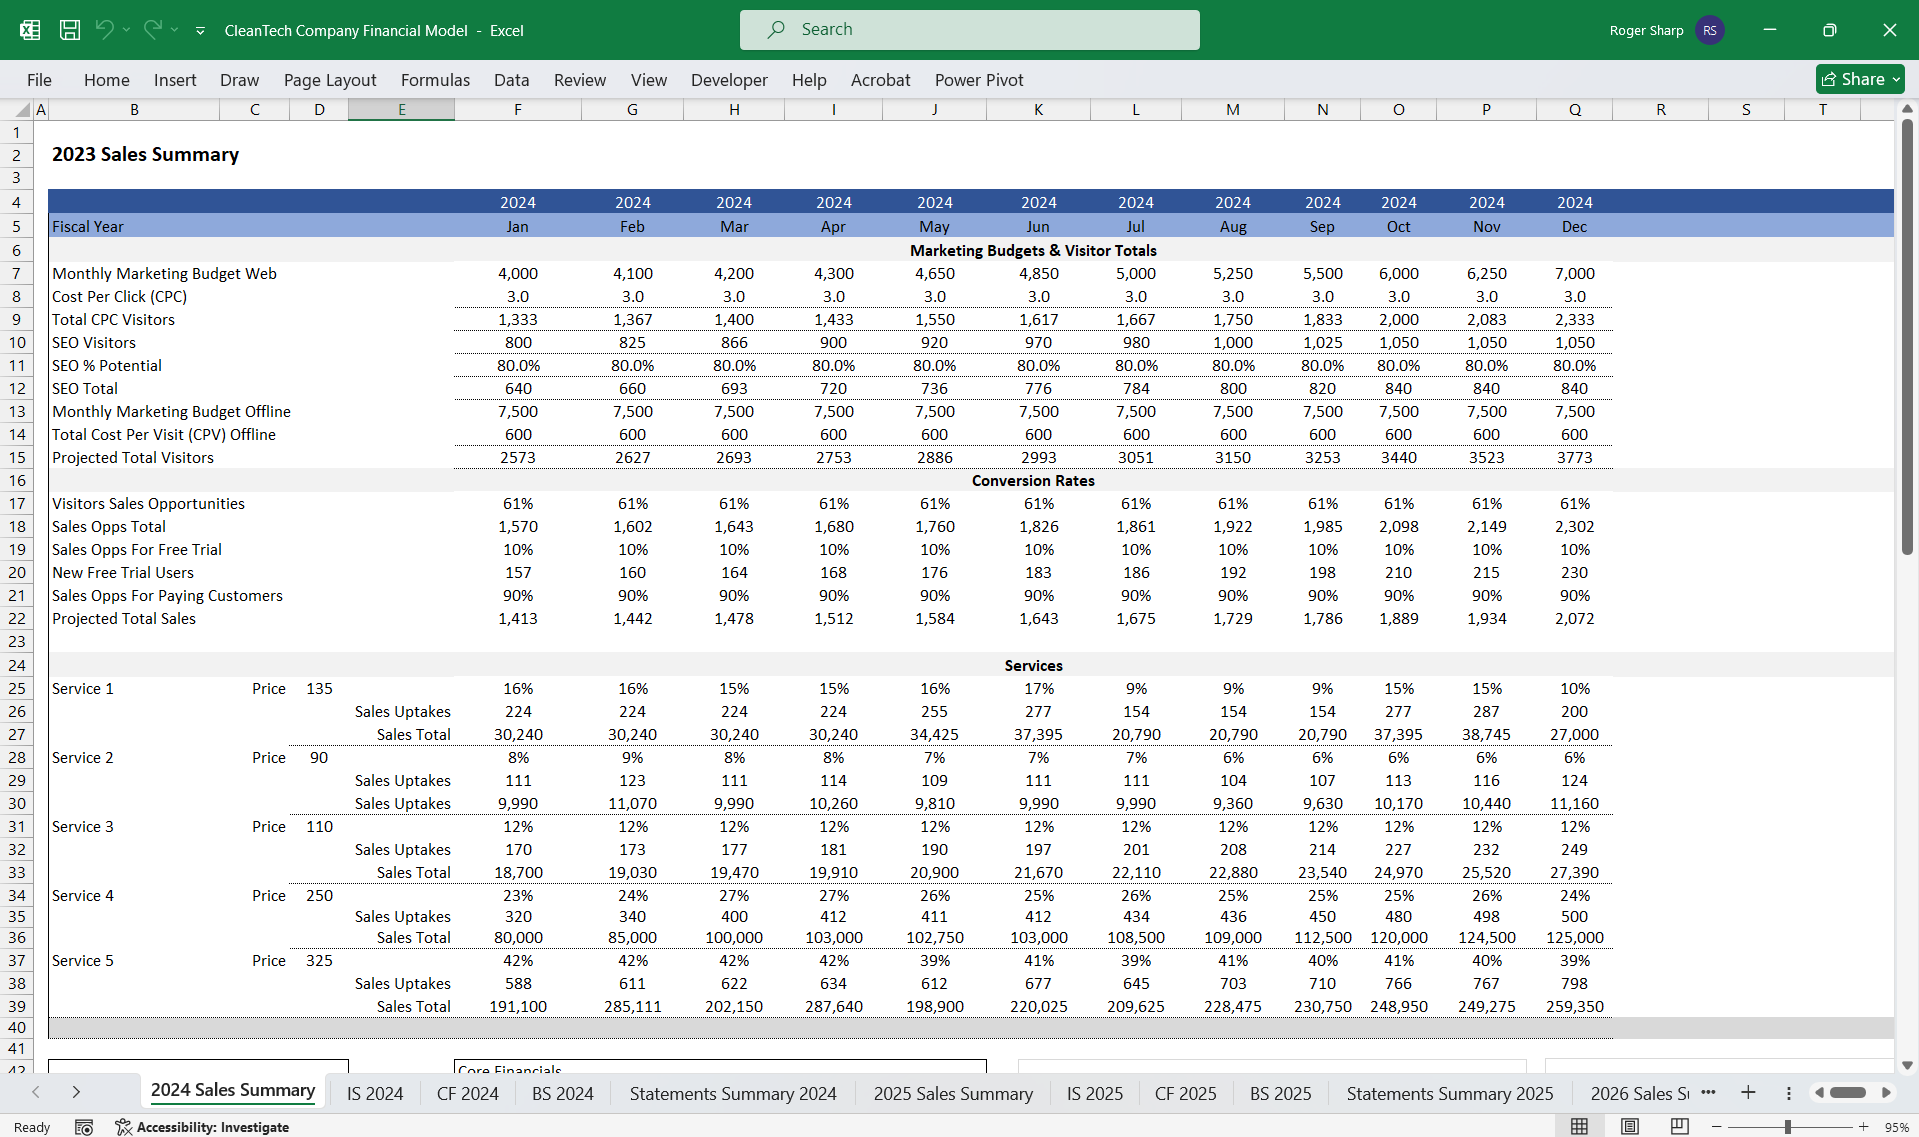
- Revenue Streams: Licensing fees, partnerships, technology transfer agreements.
- COGS: Research expenses, scouting personnel costs, travel expenses.
- Revenue Streams: Program fees, sponsorships, grants.
- COGS: Program operational costs, mentor fees, event expenses.
- Revenue Streams: Commission on funds raised, consulting fees.
- COGS: Financial advisory costs, due diligence expenses.
- Revenue Streams: Project fees, consultancy retainers, success fees.
- COGS: Consultant salaries, project execution costs, subcontractor fees.
Conclusion
This financial model for a cleantech startup provides a structured approach to forecasting financial performance and assessing the viability of the business. By tracking key metrics and financial statements, the startup can make informed strategic decisions, secure financing, and ensure sustainable growth.
This Best Practice includes
1 Excel Financial Model
Further information
Provides thorough oversight, tracking, and reporting of CleanTech Startup finances, including updates on budget utilisation and projections.
