
Originally published: 30/08/2018 08:22
Last version published: 21/05/2020 07:54
Publication number: ELQ-89685-2
View all versions & Certificate
Last version published: 21/05/2020 07:54
Publication number: ELQ-89685-2
View all versions & Certificate

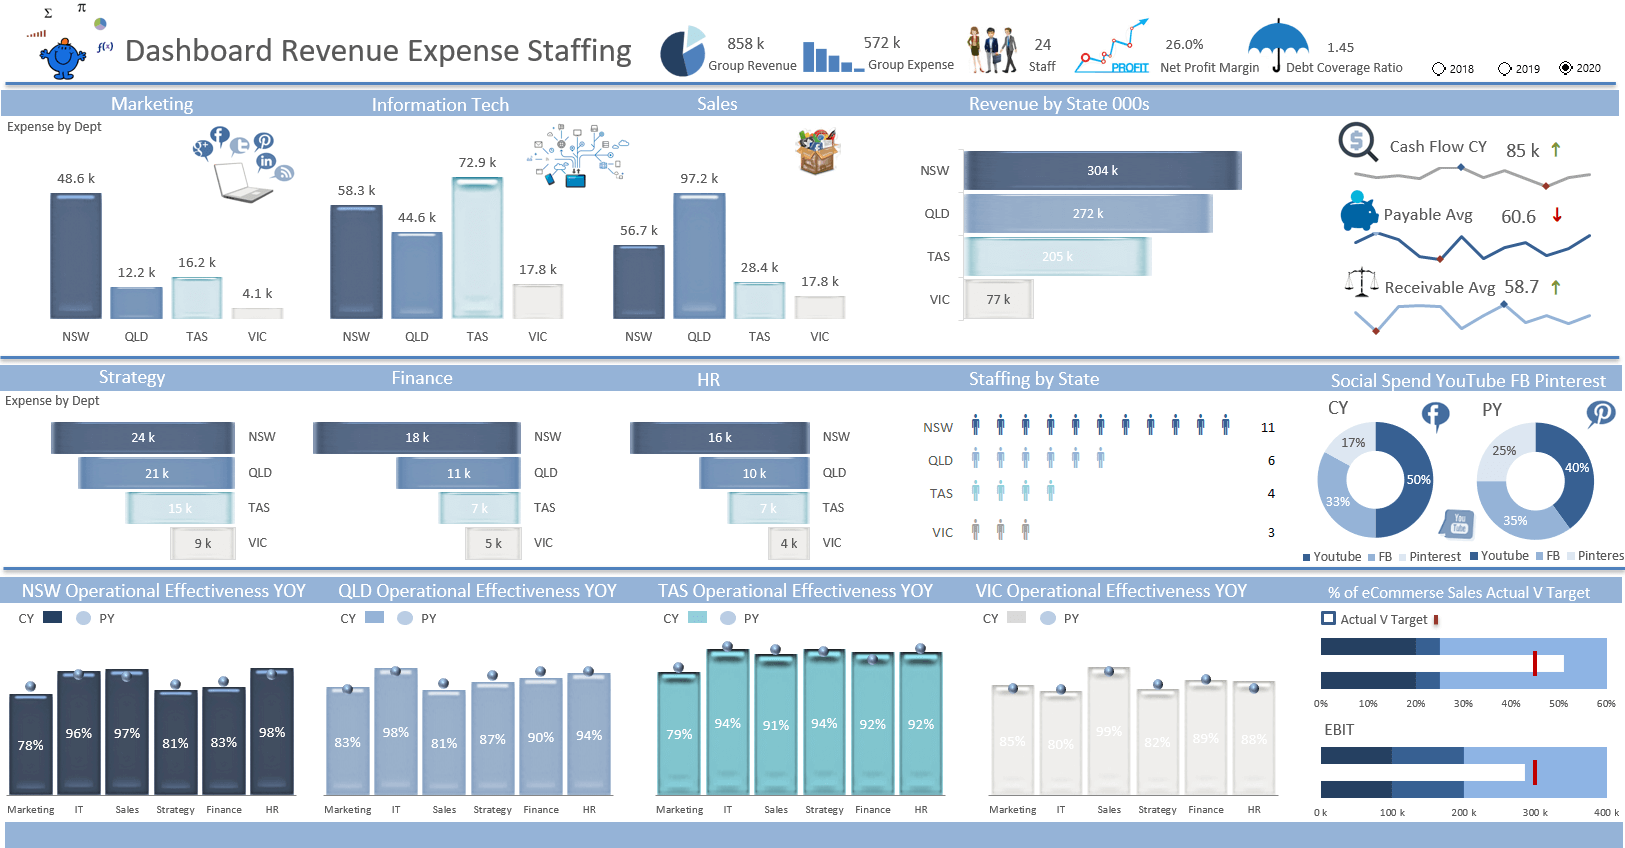
Revenue and Expenses Dashboard
A succinct Excel Dashboard report which focuses acutely on organisation's revenue and expenses in the outputs.
Further information
To summaries data in a neat clear way in order to help management understand some of the key metrics inside the organisation.
