Originally published: 23/11/2019 19:35
Last version published: 12/04/2020 17:01
Publication number: ELQ-84530-6
View all versions & Certificate
Last version published: 12/04/2020 17:01
Publication number: ELQ-84530-6
View all versions & Certificate

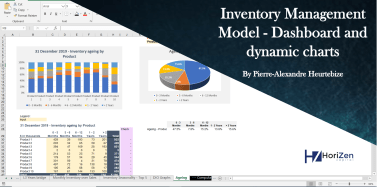
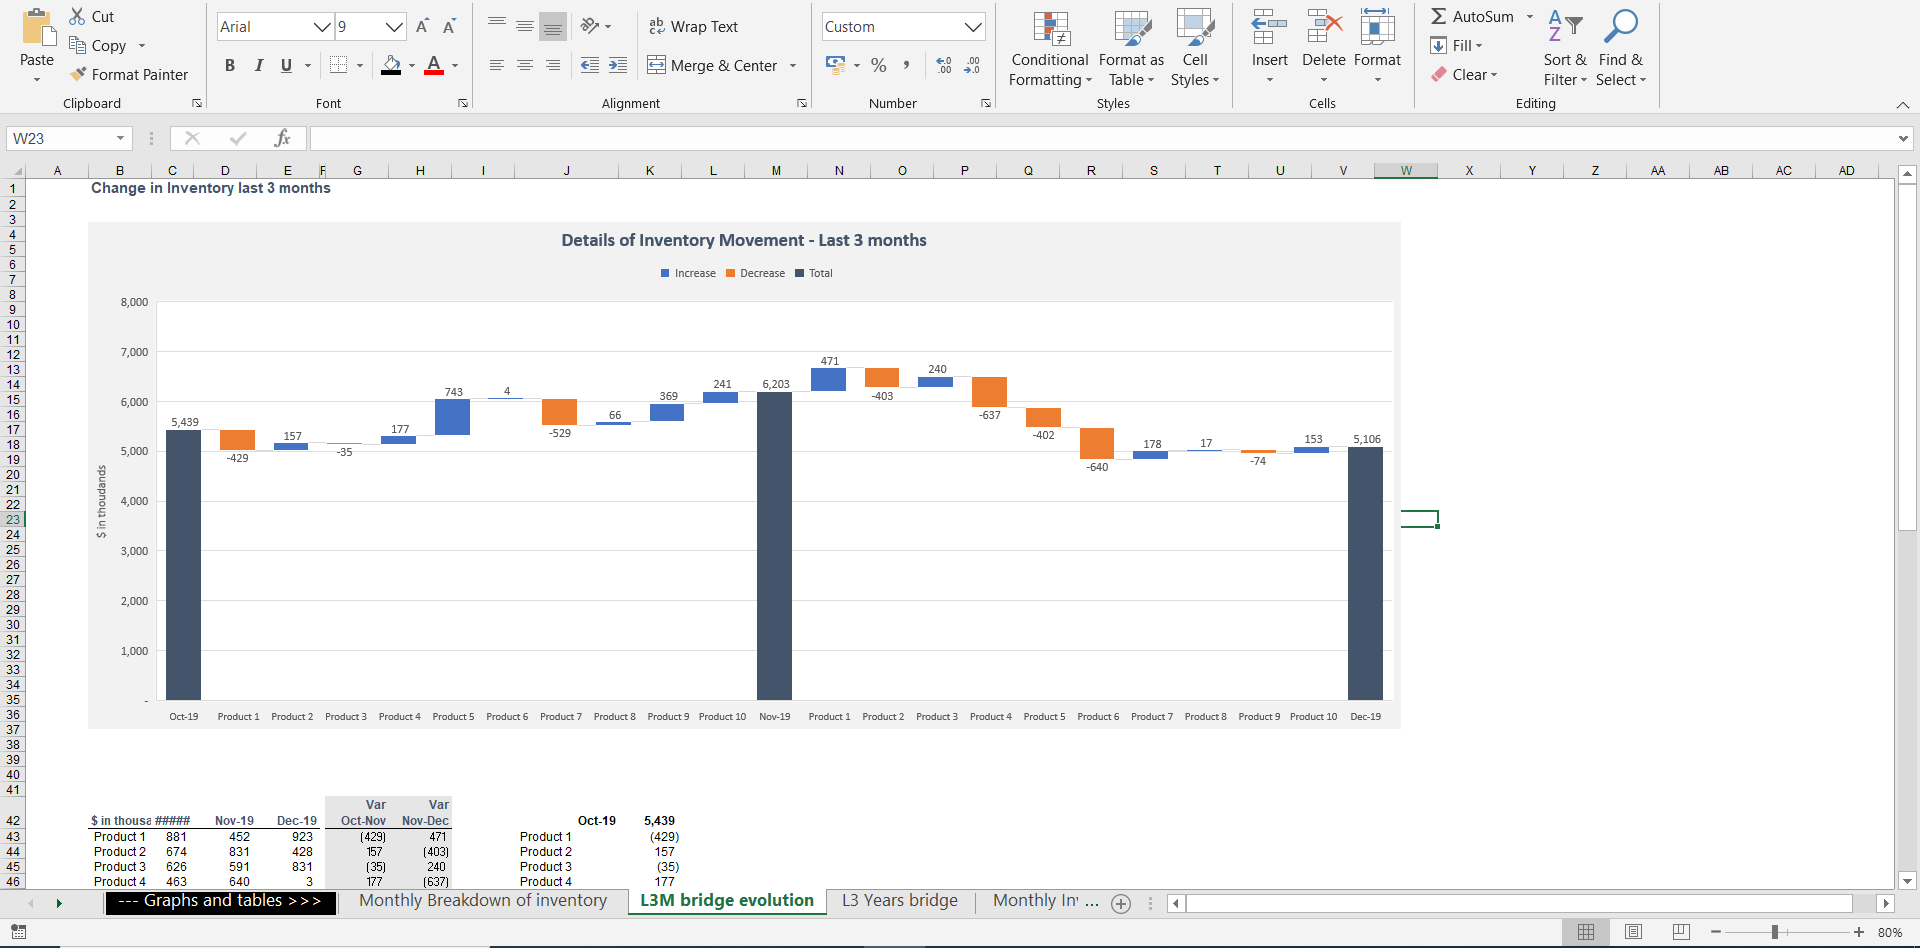
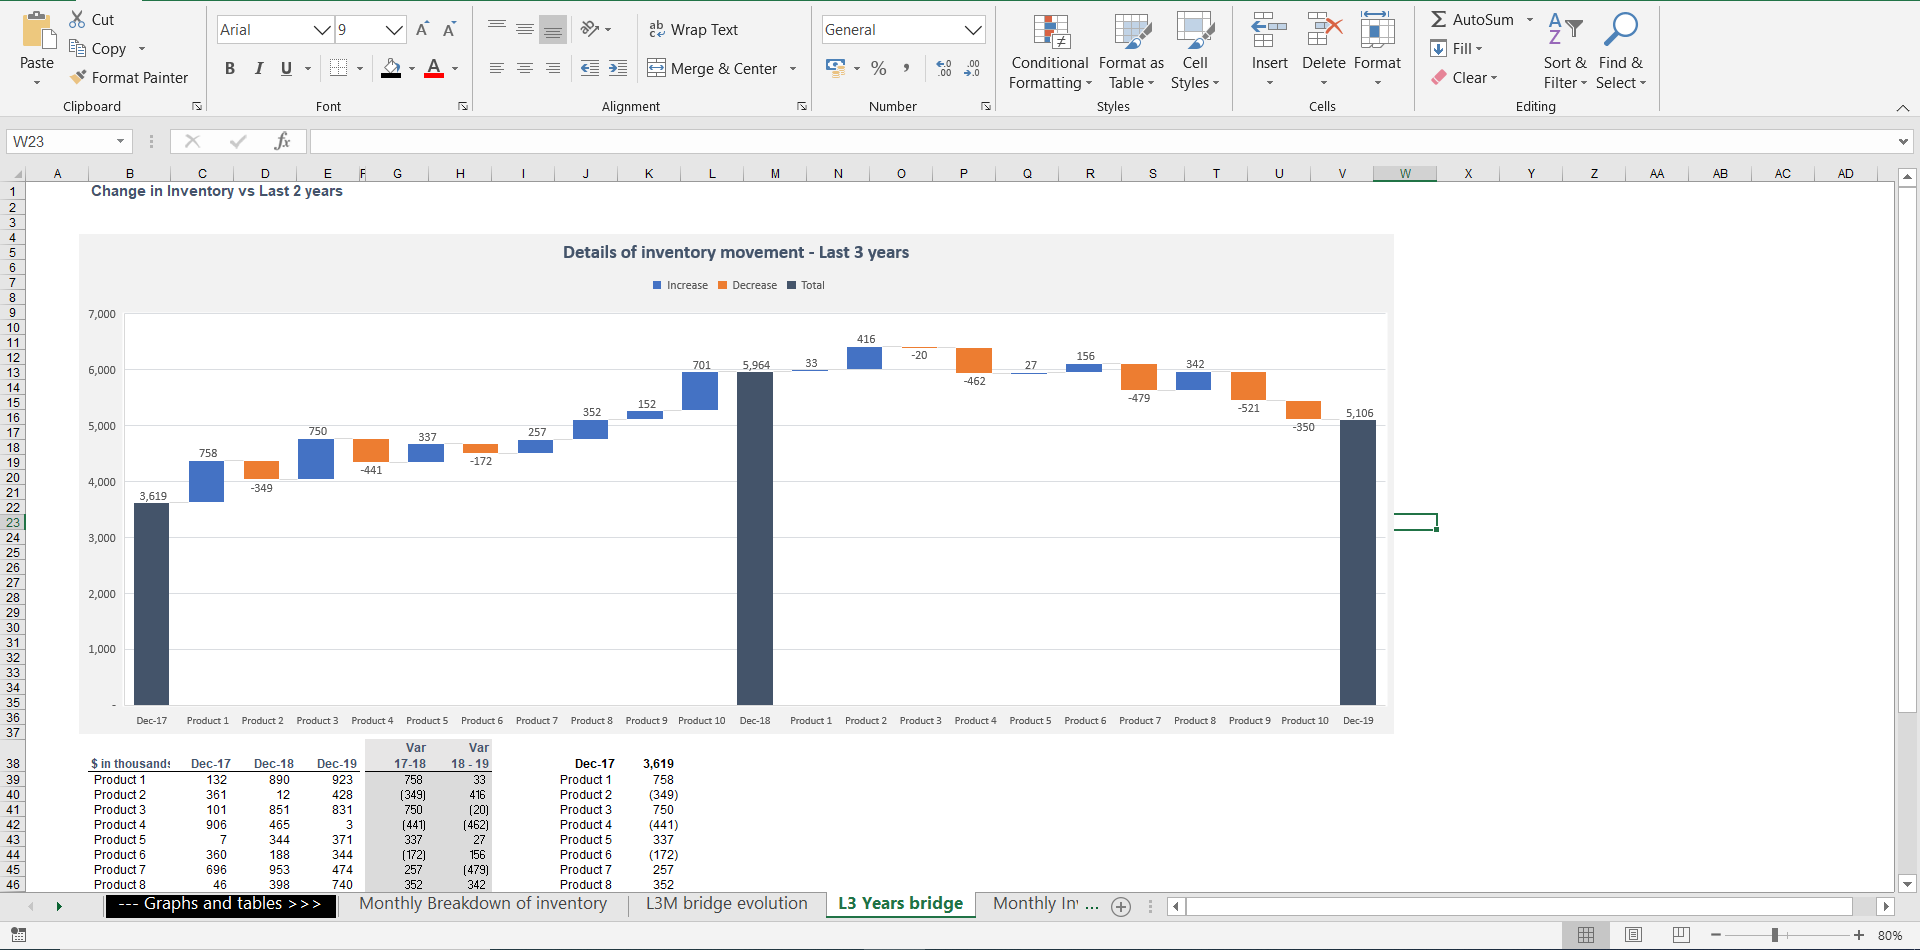
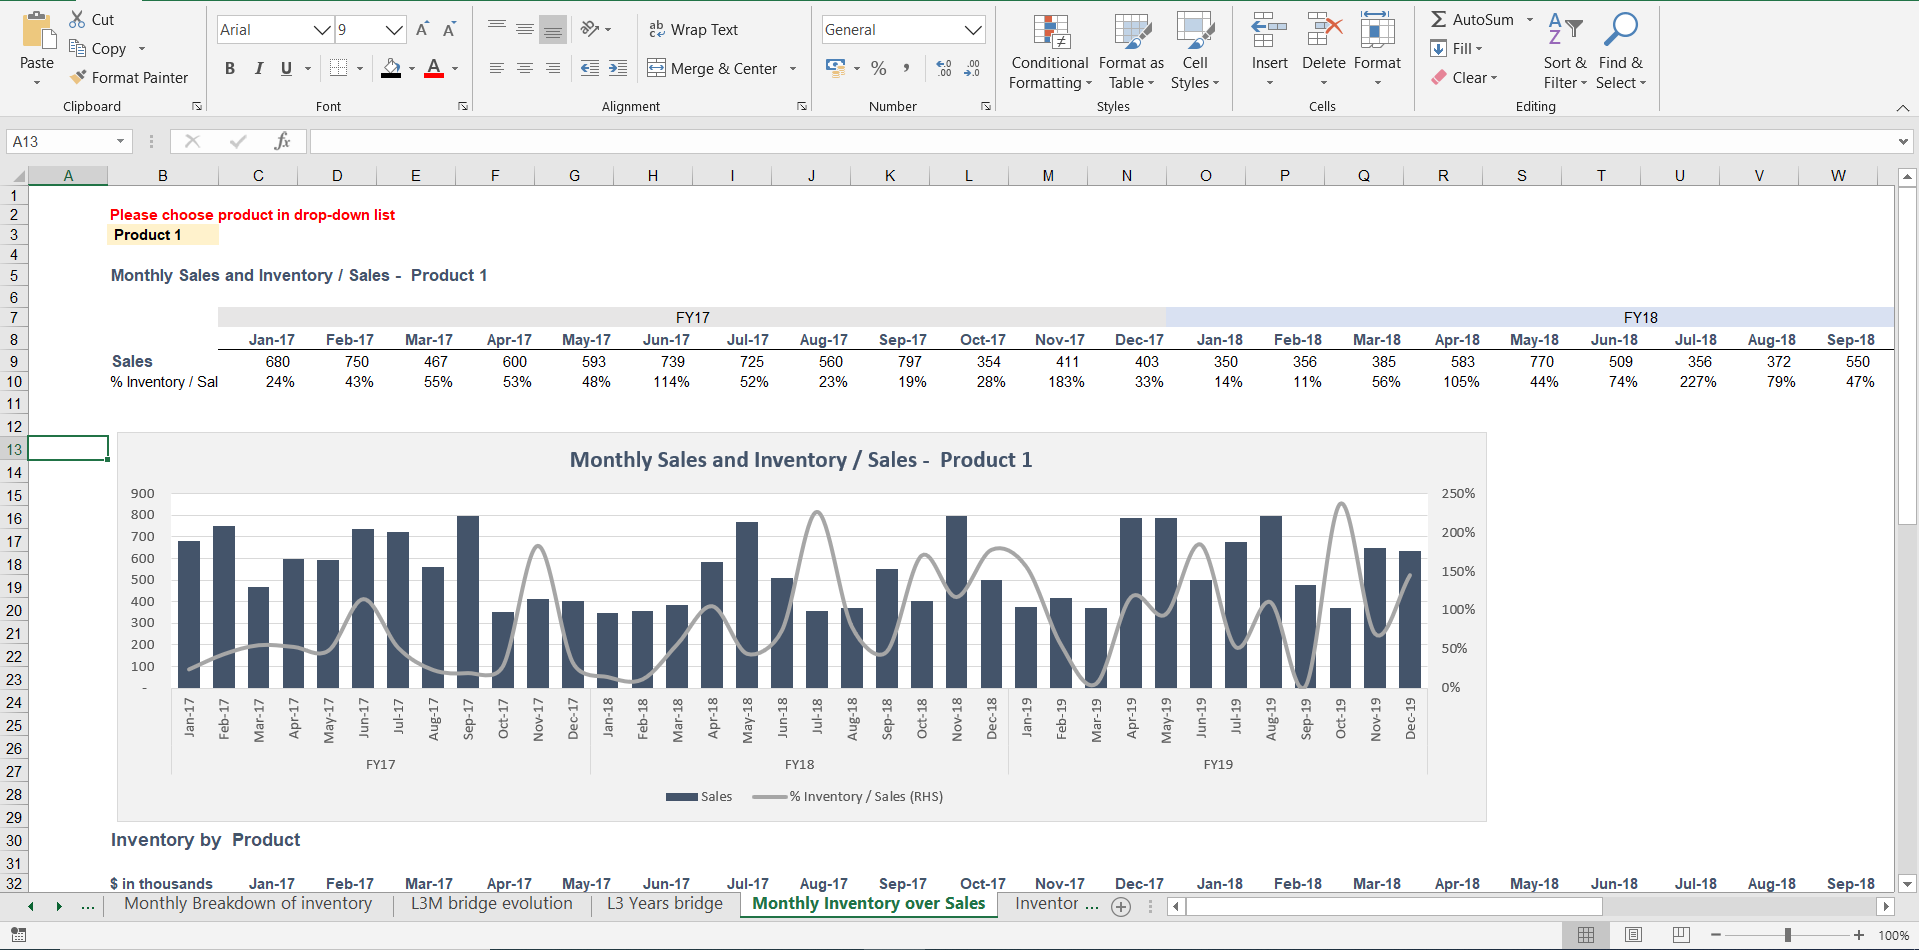
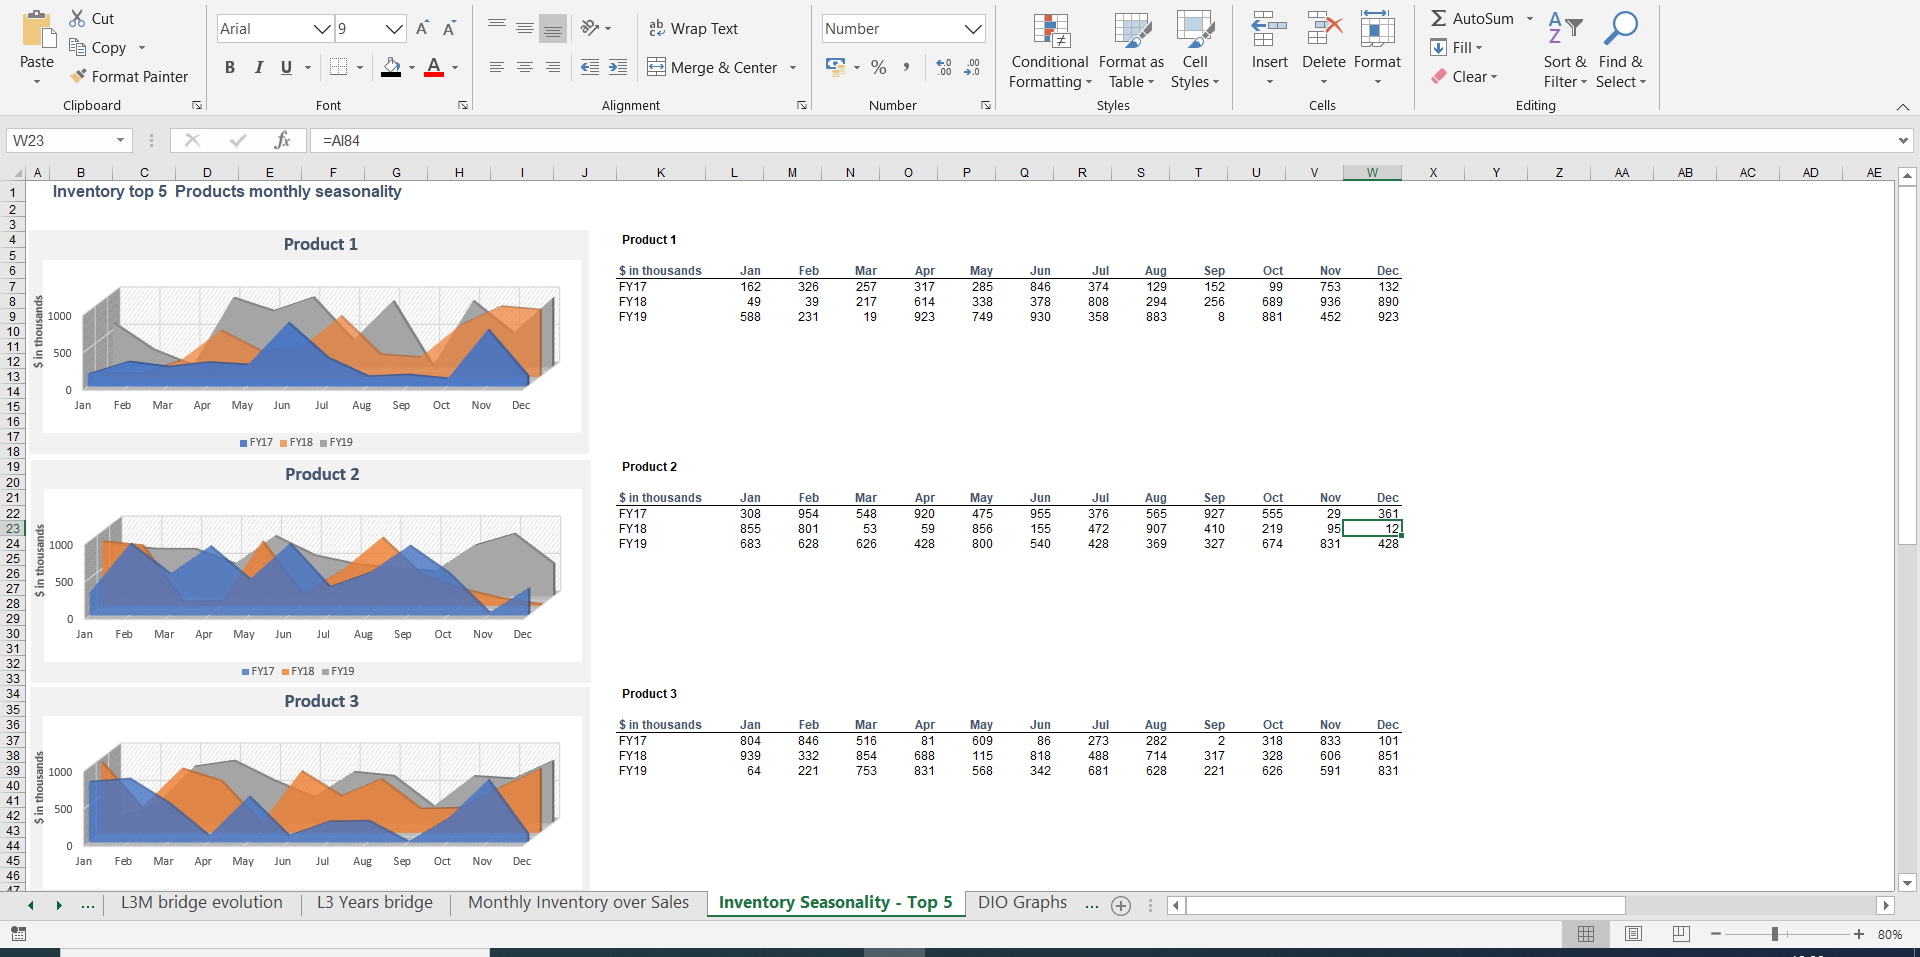
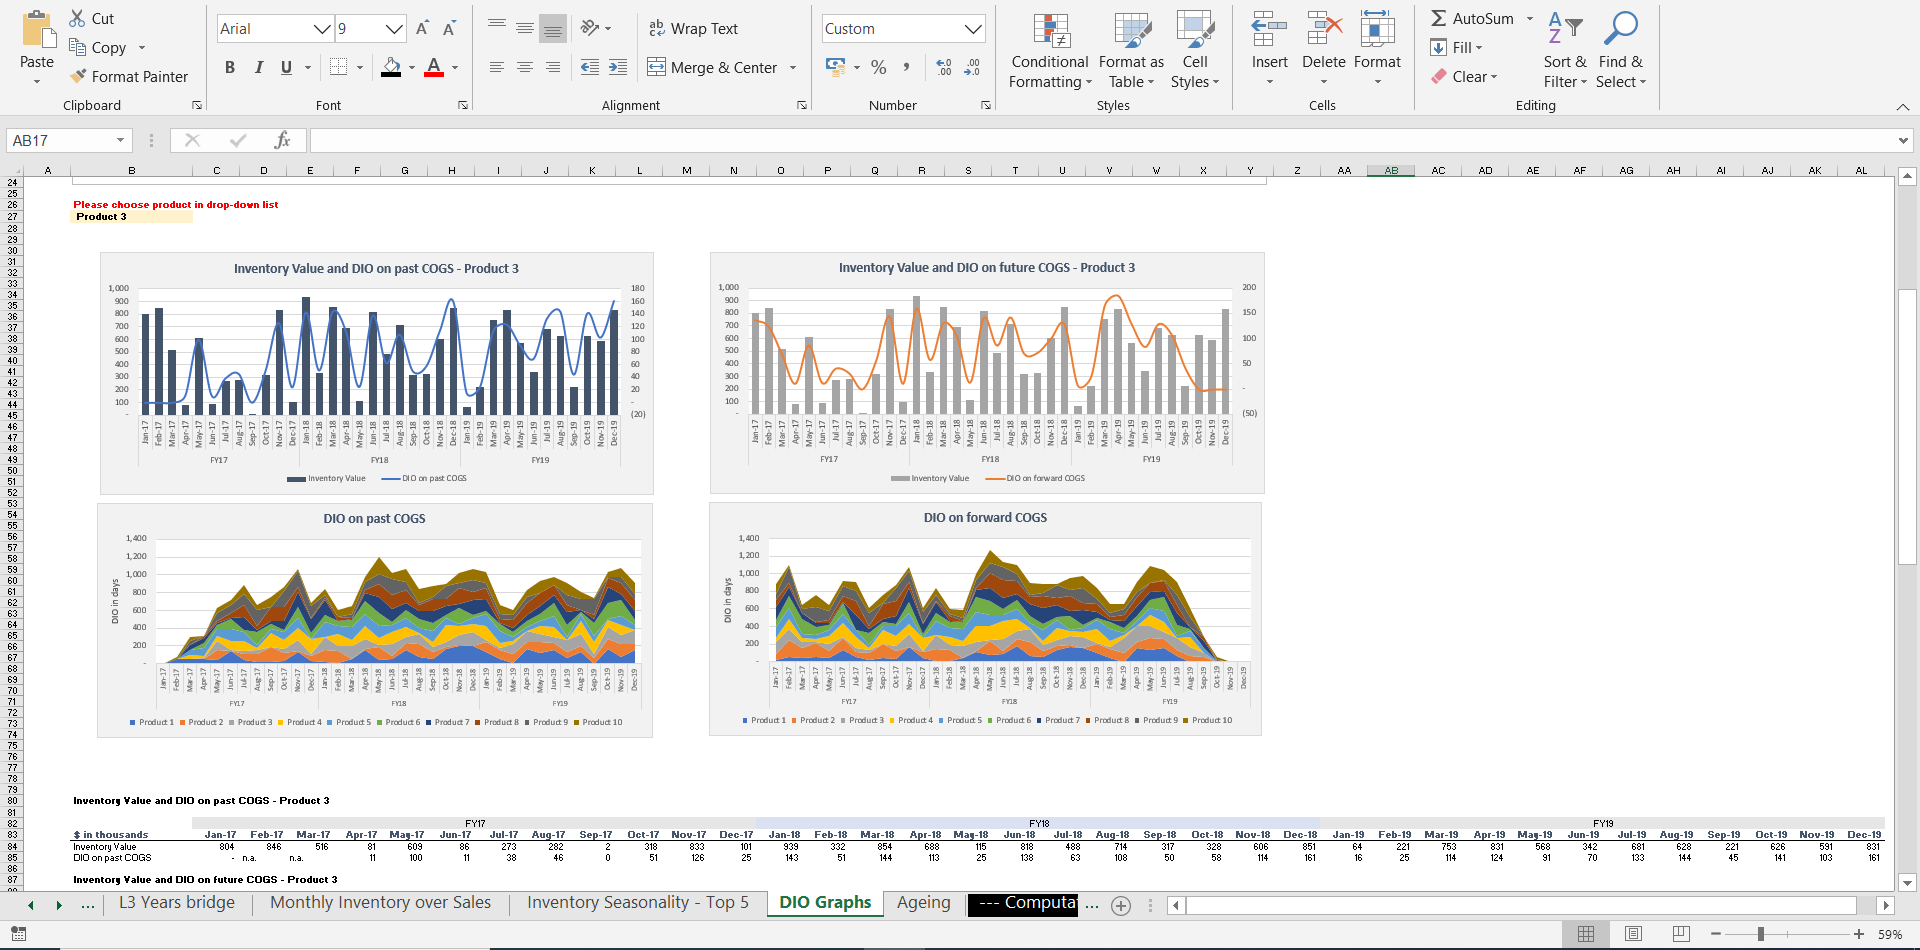
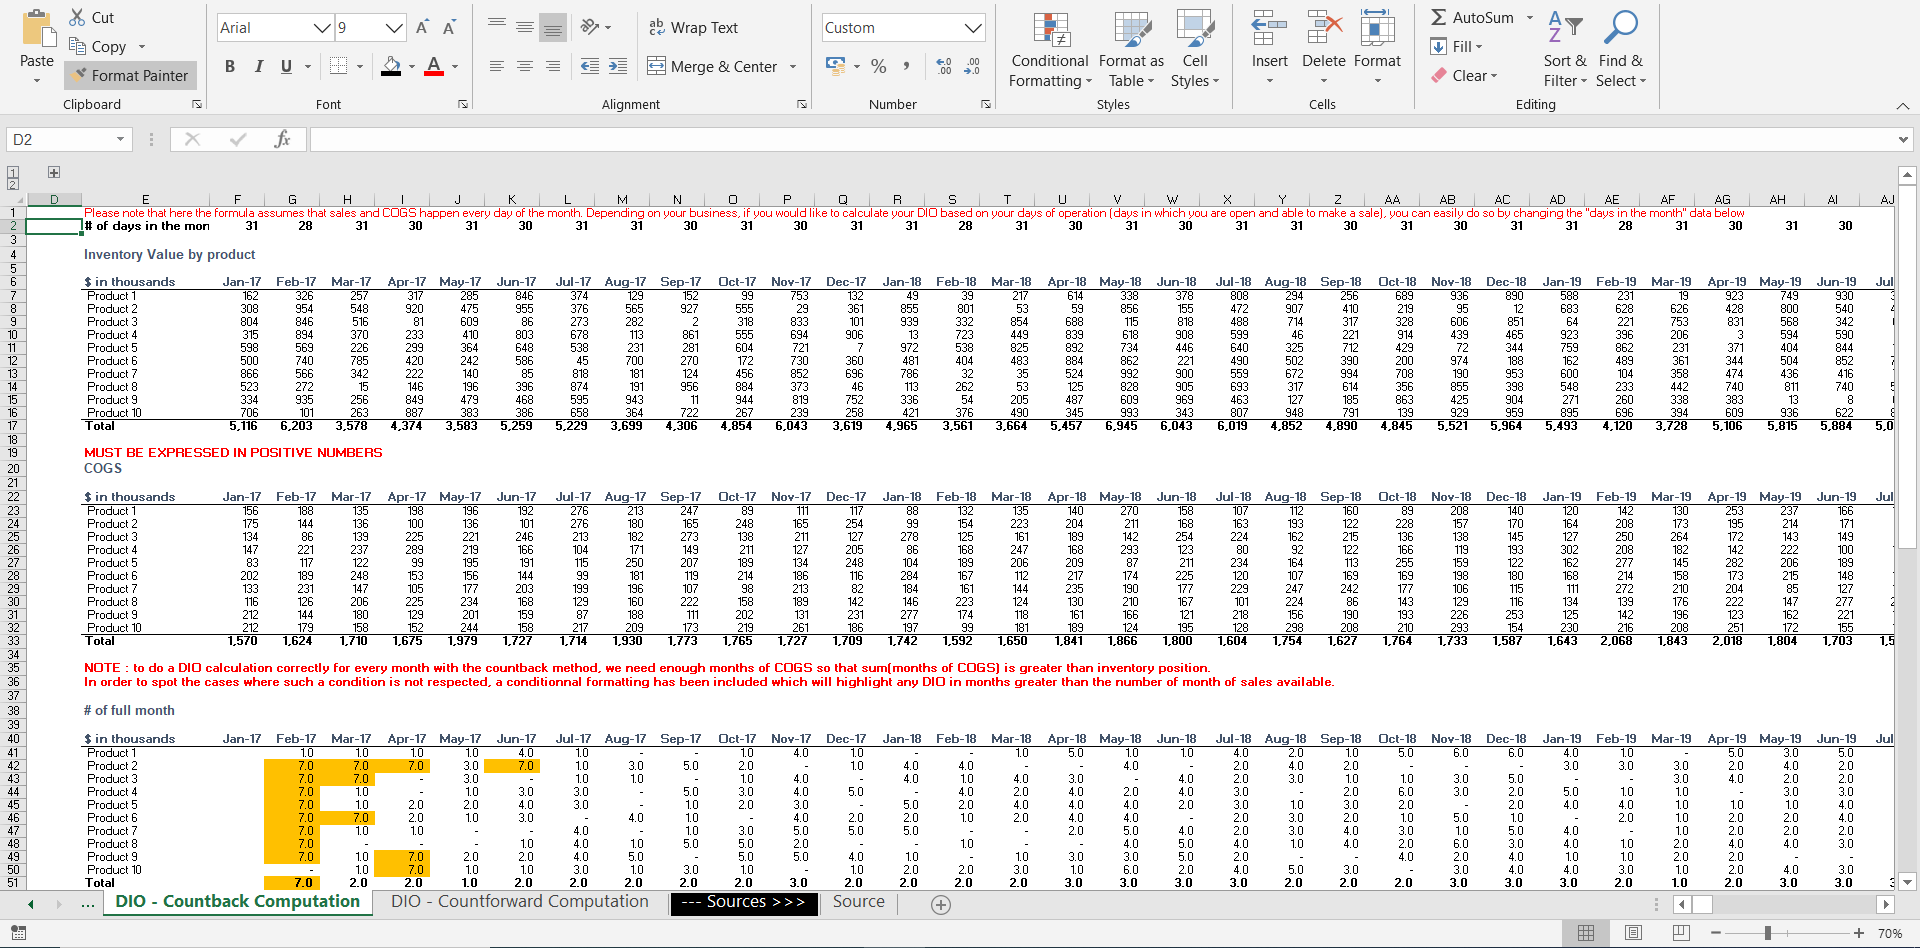
Inventory Management and Analysis best practice with dynamic charts
Inventory Management and Analysis best practice. Useful to the Management team as well as to external financial analyst.
Consultant - M&A, Modelling and Financial expert - M&A director at HoriZen CapitalFollow 68
Further information
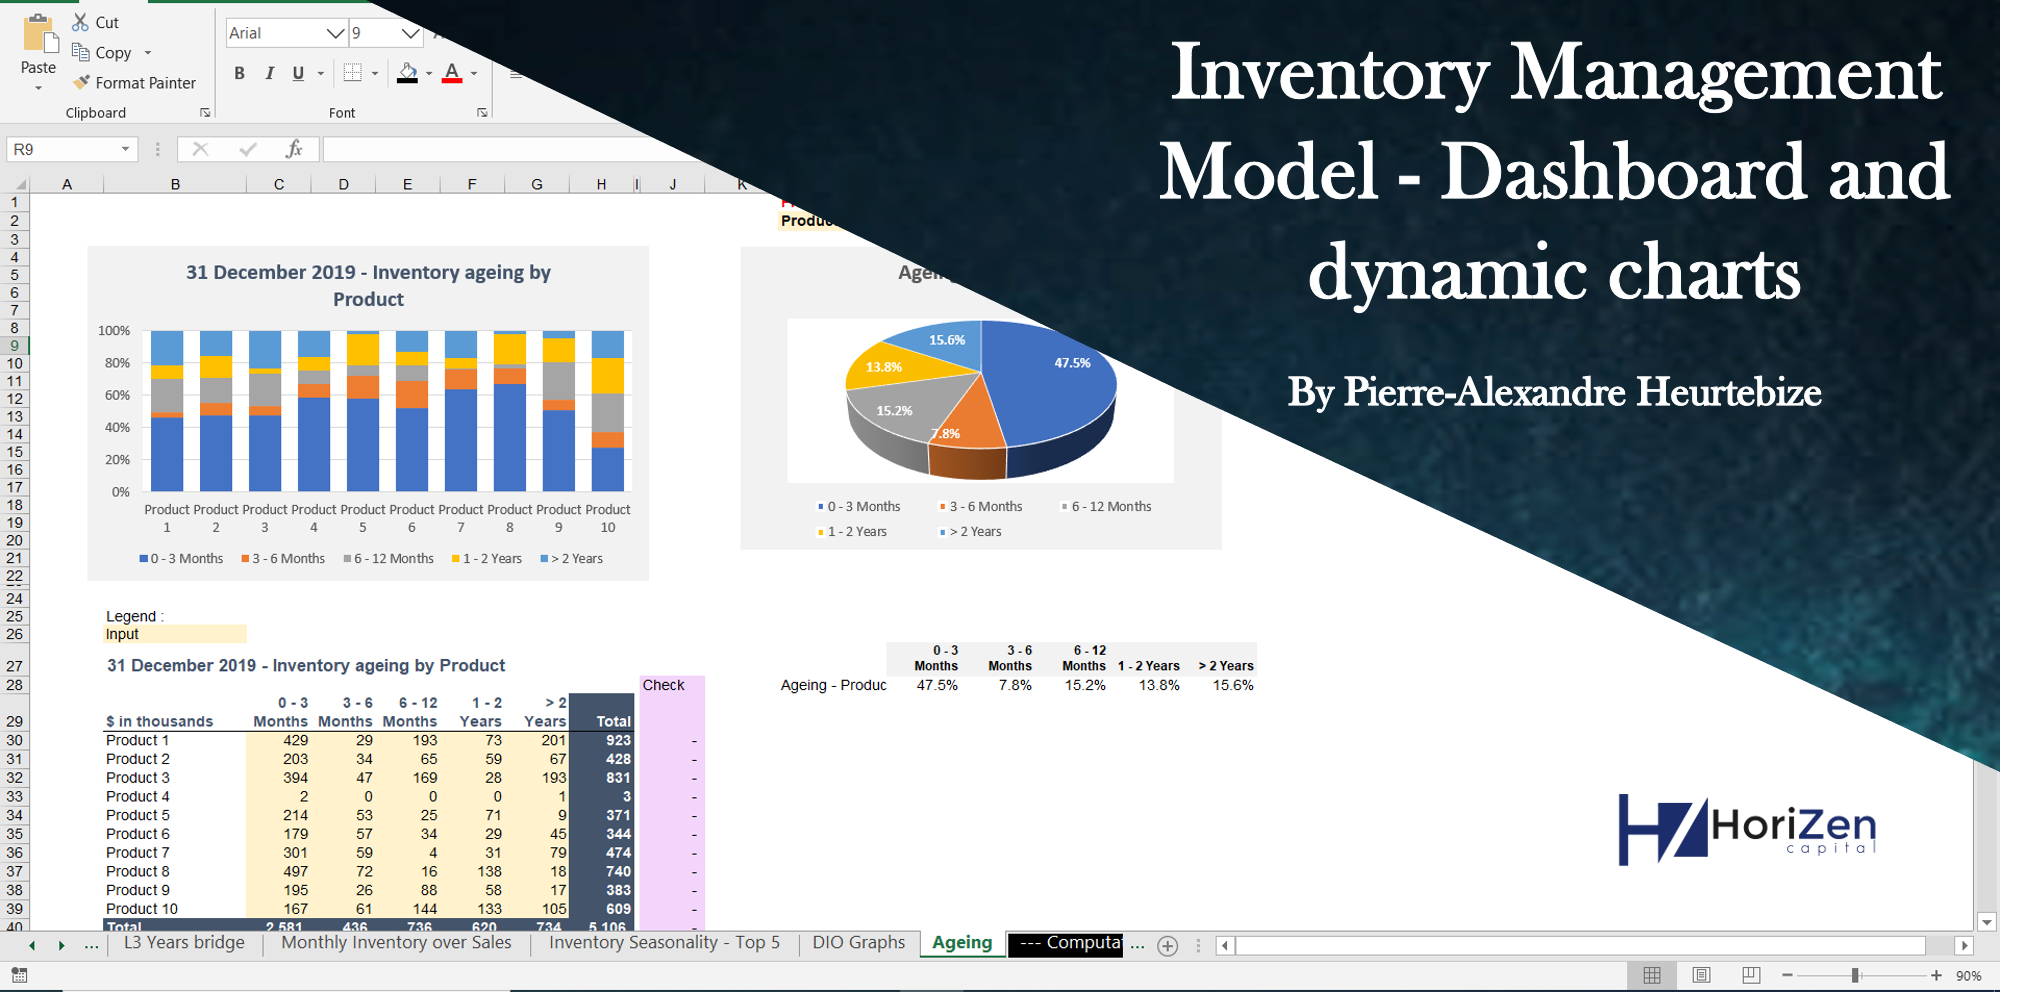
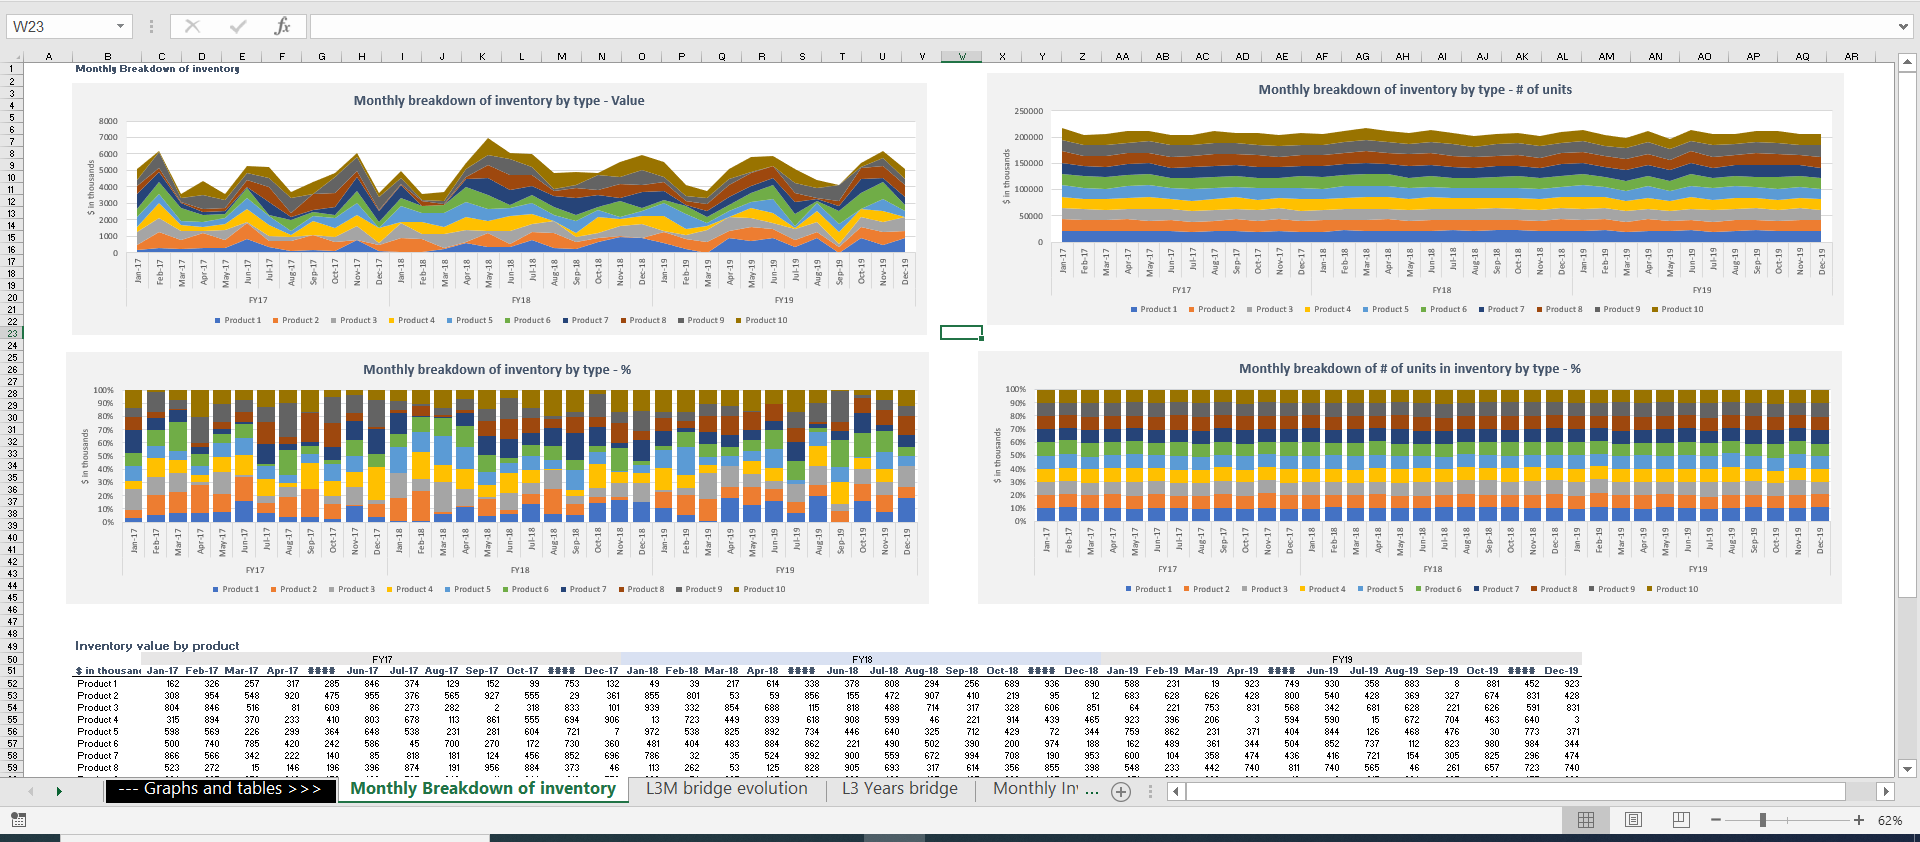
Improve Inventory tracking, inventory Management and inventory analysis. Provide insights through clear charts.
Inventory Management, inventory analysis. Can either be used internally to track inventory at a high level and present it to the board or for a FInancial due diligence phase.
