Summary Sources and Uses Chart in a Project Finance Model
Originally published: 15/06/2021 13:08
Publication number: ELQ-72735-1
View all versions & Certificate
certified

Summary Sources and Uses Chart in a Project Finance Model

A real life example of a bar chart to visualize the sources and uses of funds in a project finance model

Description
One of the most important statement in a project finance model is the sources and uses of funds during construction. It is composed of two sections:

Uses of funds statement shows the total cost of a project with an explicit and meaningful breakdown of costs. It identifies the total financing required for a project.

Sources of funds statement lists the financing facilities that have been identified as available to meet the cost.

The summary sources and uses of funds table appears in most project documents and should also be included in the summary sheet or dashboard within the financial model.

It is also useful to include a chart to visualize the main items in the total project and the financing plan.

Getting a nice looking chart with descending or ascending order require some work.

In this Excel spreadsheet and manual I show you the steps to create a good looking bar chart for your Dashboard.

What you get:

1. An excel file
2. A pdf manual describing the steps with snapshots
3. Short video

The Excel temple can be used for educational purpose and users can also incorporate the template within their own models by making the links to the Sources and Uses line items in their own project financial models.

This Best Practice includes
1 PDF manual and 1 Excel template

FinExMod offers you this Best Practice for free!

download for free

Add to bookmarks

Discuss

Further information

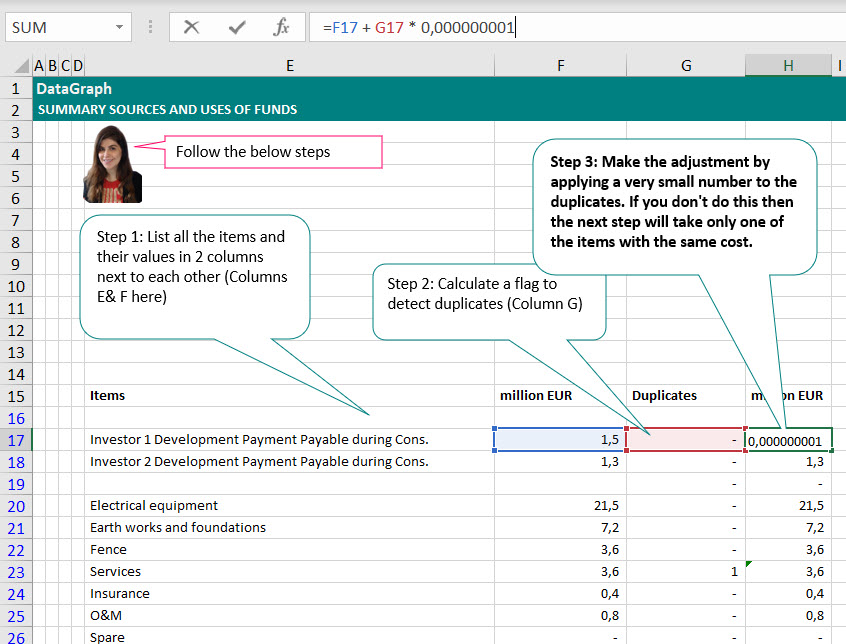
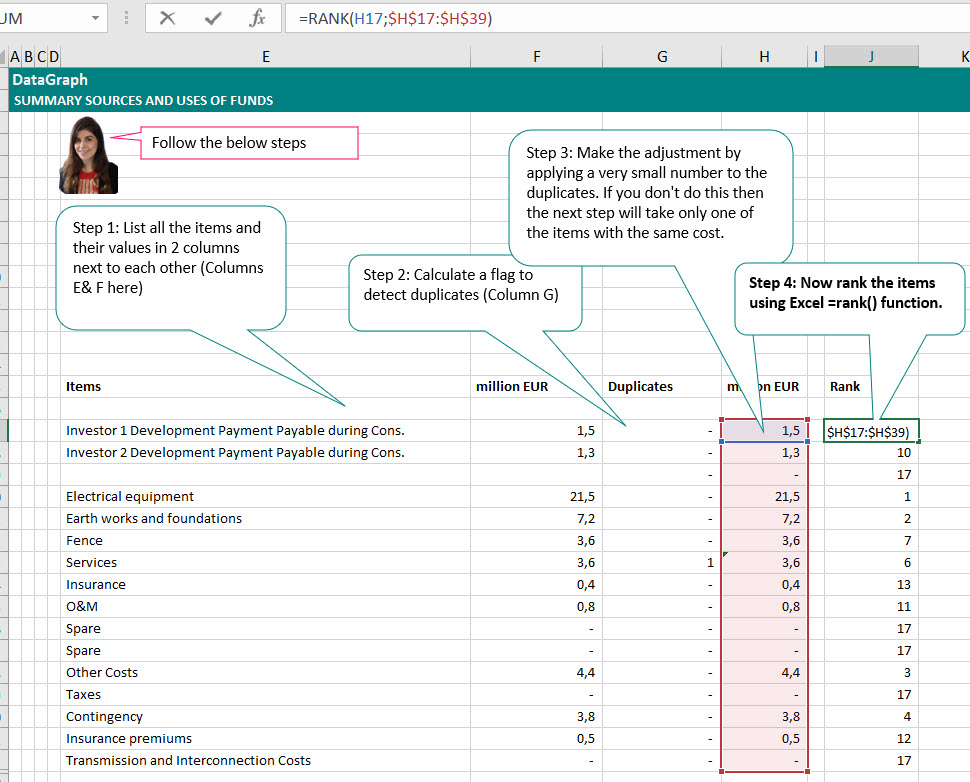
This is not a complete Project Finance model and is just extract


4.7 / 5 (15 votes)

please wait...