
Publication number: ELQ-55374-1
View all versions & Certificate

Quality KPI Dashboard: Real-Time Monthly Performance Tracker with Target vs. Actual Analysis
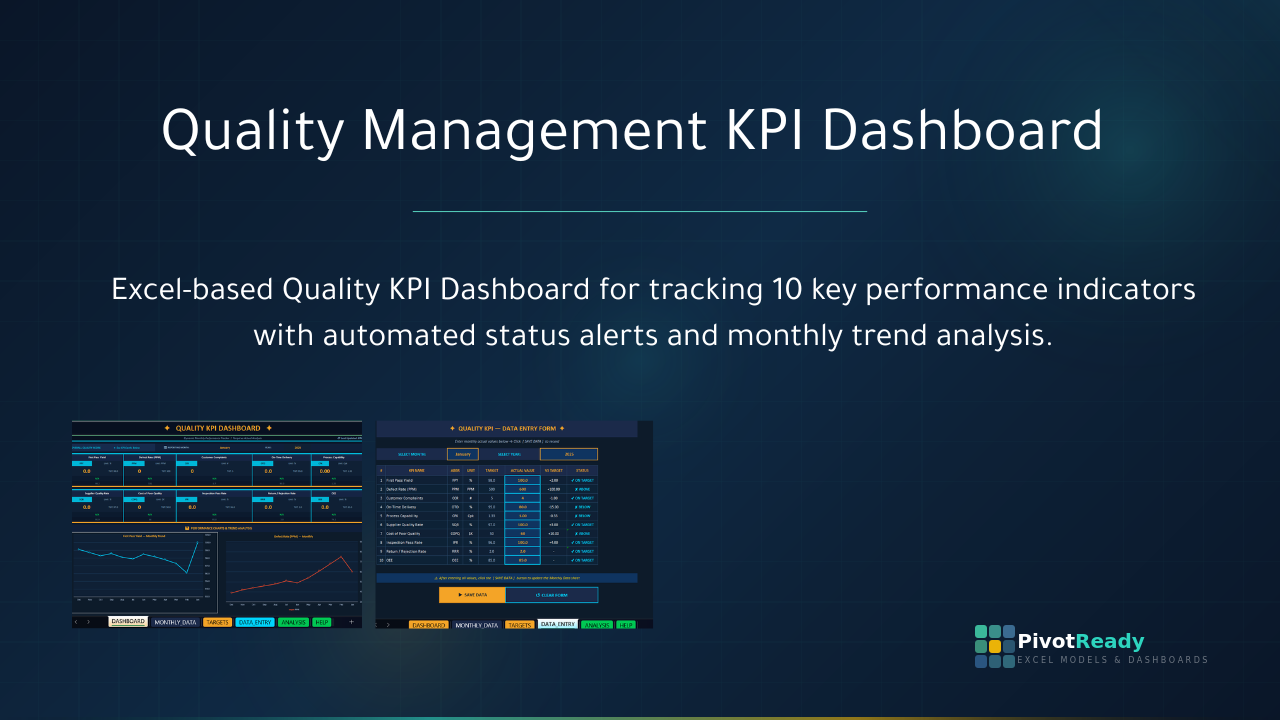
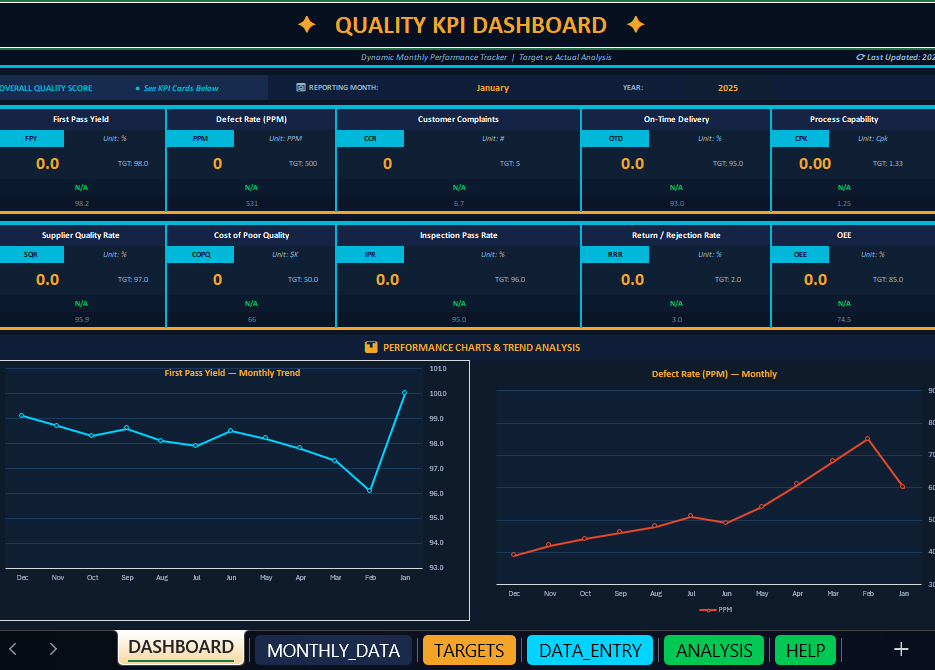
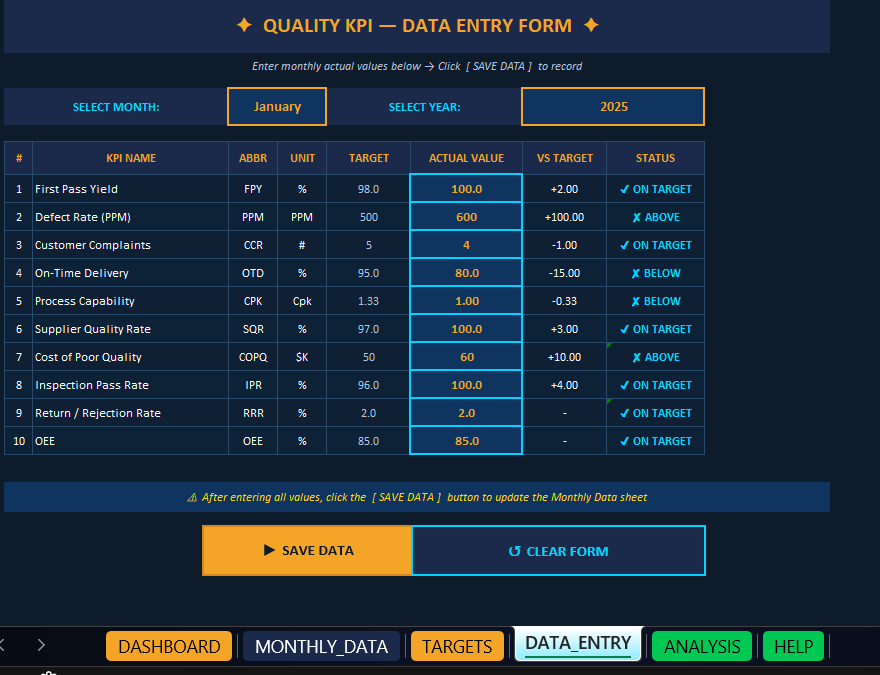
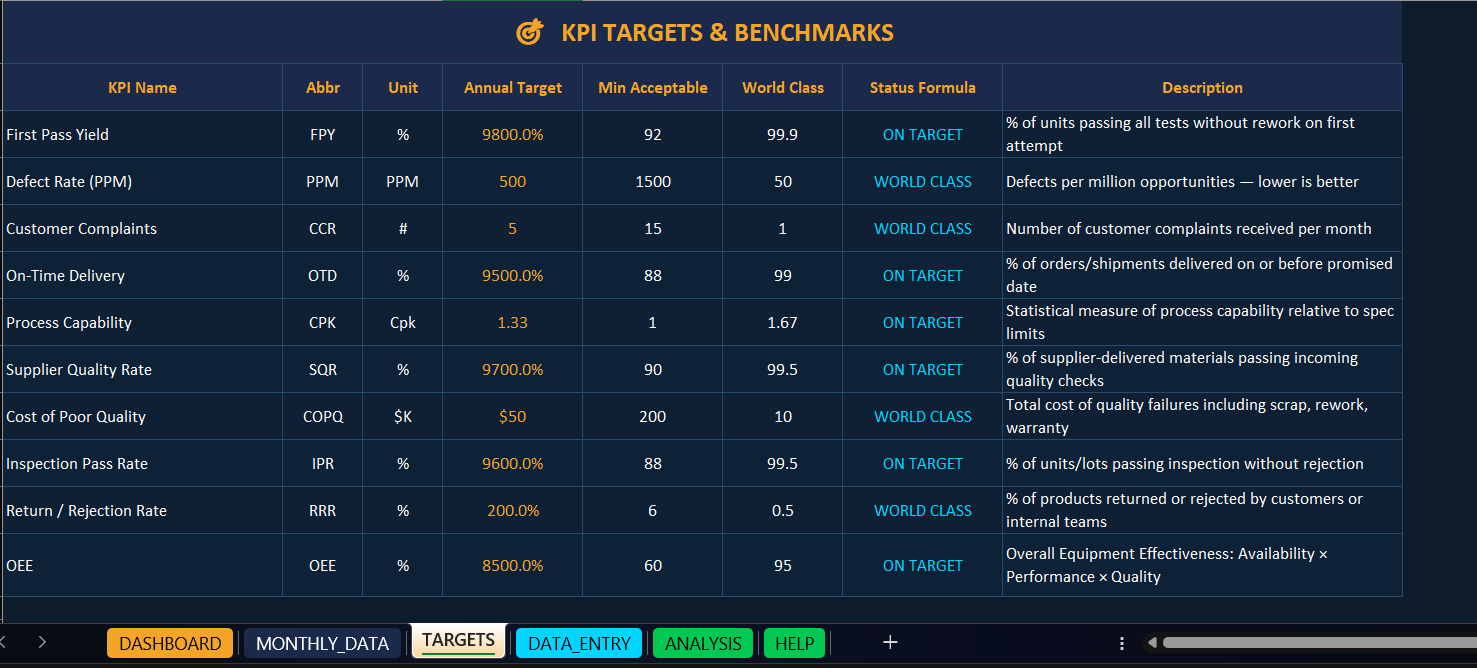
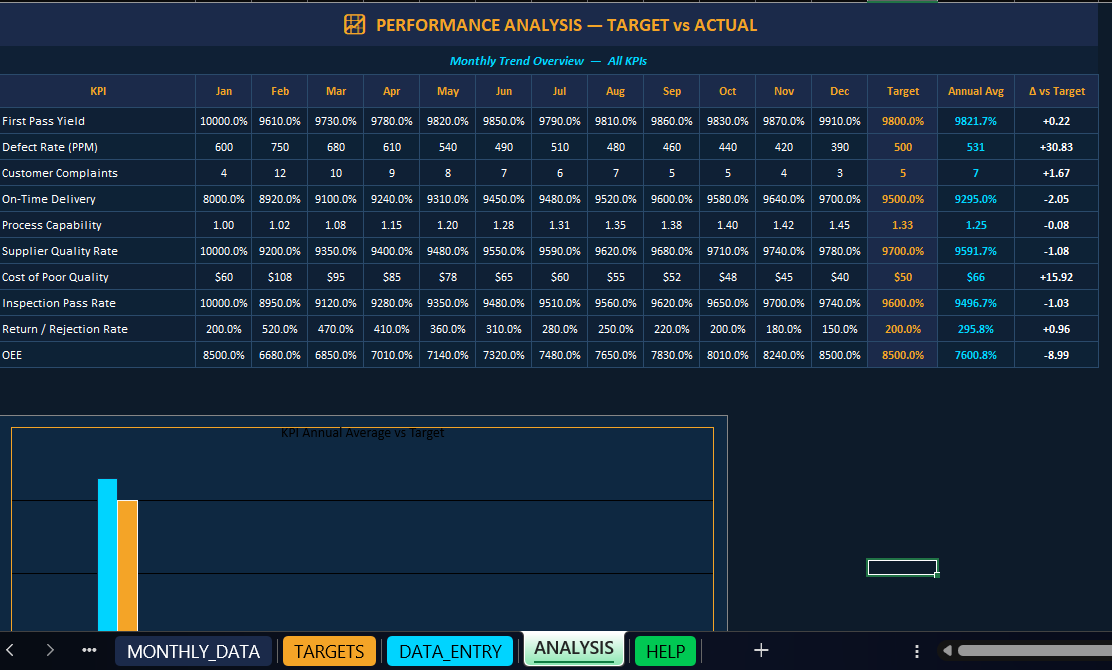
Excel-based Quality KPI Dashboard for tracking 10 key performance indicators with automated status alerts and monthly trend analysis.
Further information
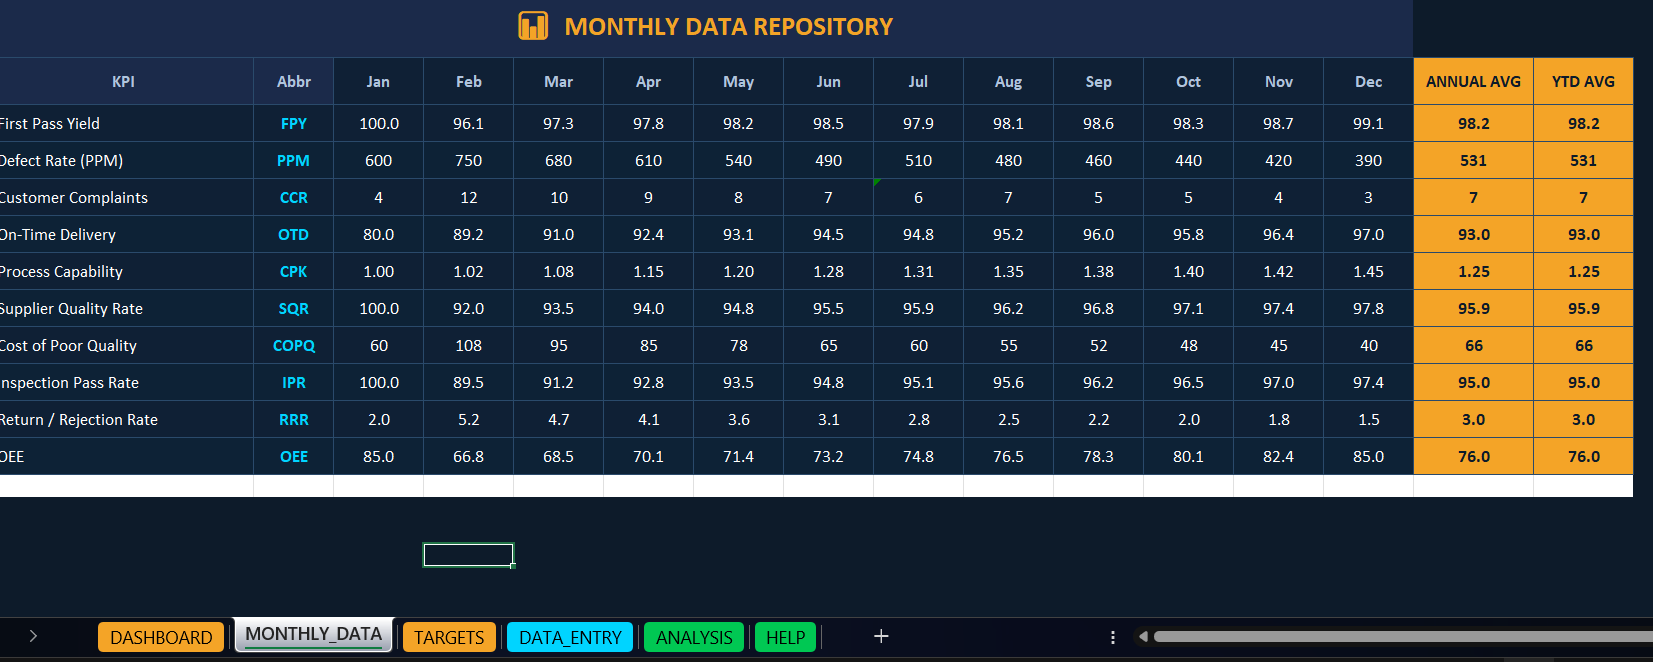
1. Provide a single-source-of-truth for quality KPI reporting on a monthly basis
2. Automate the comparison of actual vs. target for 10 key quality metrics
3. Enable trend visibility through monthly charts to detect deteriorating performance early
4. Reduce reporting preparation time from hours to minutes
5. Standardize quality reporting language and metrics across teams and sites
6. Support data-driven conversations in management reviews and operational meetings
• Manufacturing or production environments tracking recurring monthly quality data
• Teams with defined quality targets for metrics such as FPY, PPM, OTD, COPQ, OEE
• Organizations seeking to standardize quality reporting across departments or sites
• Quality Managers who currently report manually via PowerPoint or scattered Excel files
• Environments where Excel is the primary reporting tool and no BI tool is available
• Sites undergoing ISO 9001, IATF 16949, or similar quality management system audits
Conditions for Which This Best Practice Does Not Apply Ideally
• Organizations requiring real-time / live data feeds from ERP or MES systems (this tool requires manual monthly data entry)
• Teams with more than 12 months of history needing multi-year trend analysis (template is structured for rolling 12-month view)
• Environments where Power BI, Tableau, or similar BI tools are already deployed and maintained
• Companies tracking more than 10 KPIs as the card layout is fixed to the current 5+5 structure
• Users unfamiliar with basic Excel navigation (no macros or automated guidance beyond the HELP sheet)
