Originally published: 10/01/2025 08:41
Publication number: ELQ-10927-1
View all versions & Certificate
Publication number: ELQ-10927-1
View all versions & Certificate

Data Analytics Service Financial Model
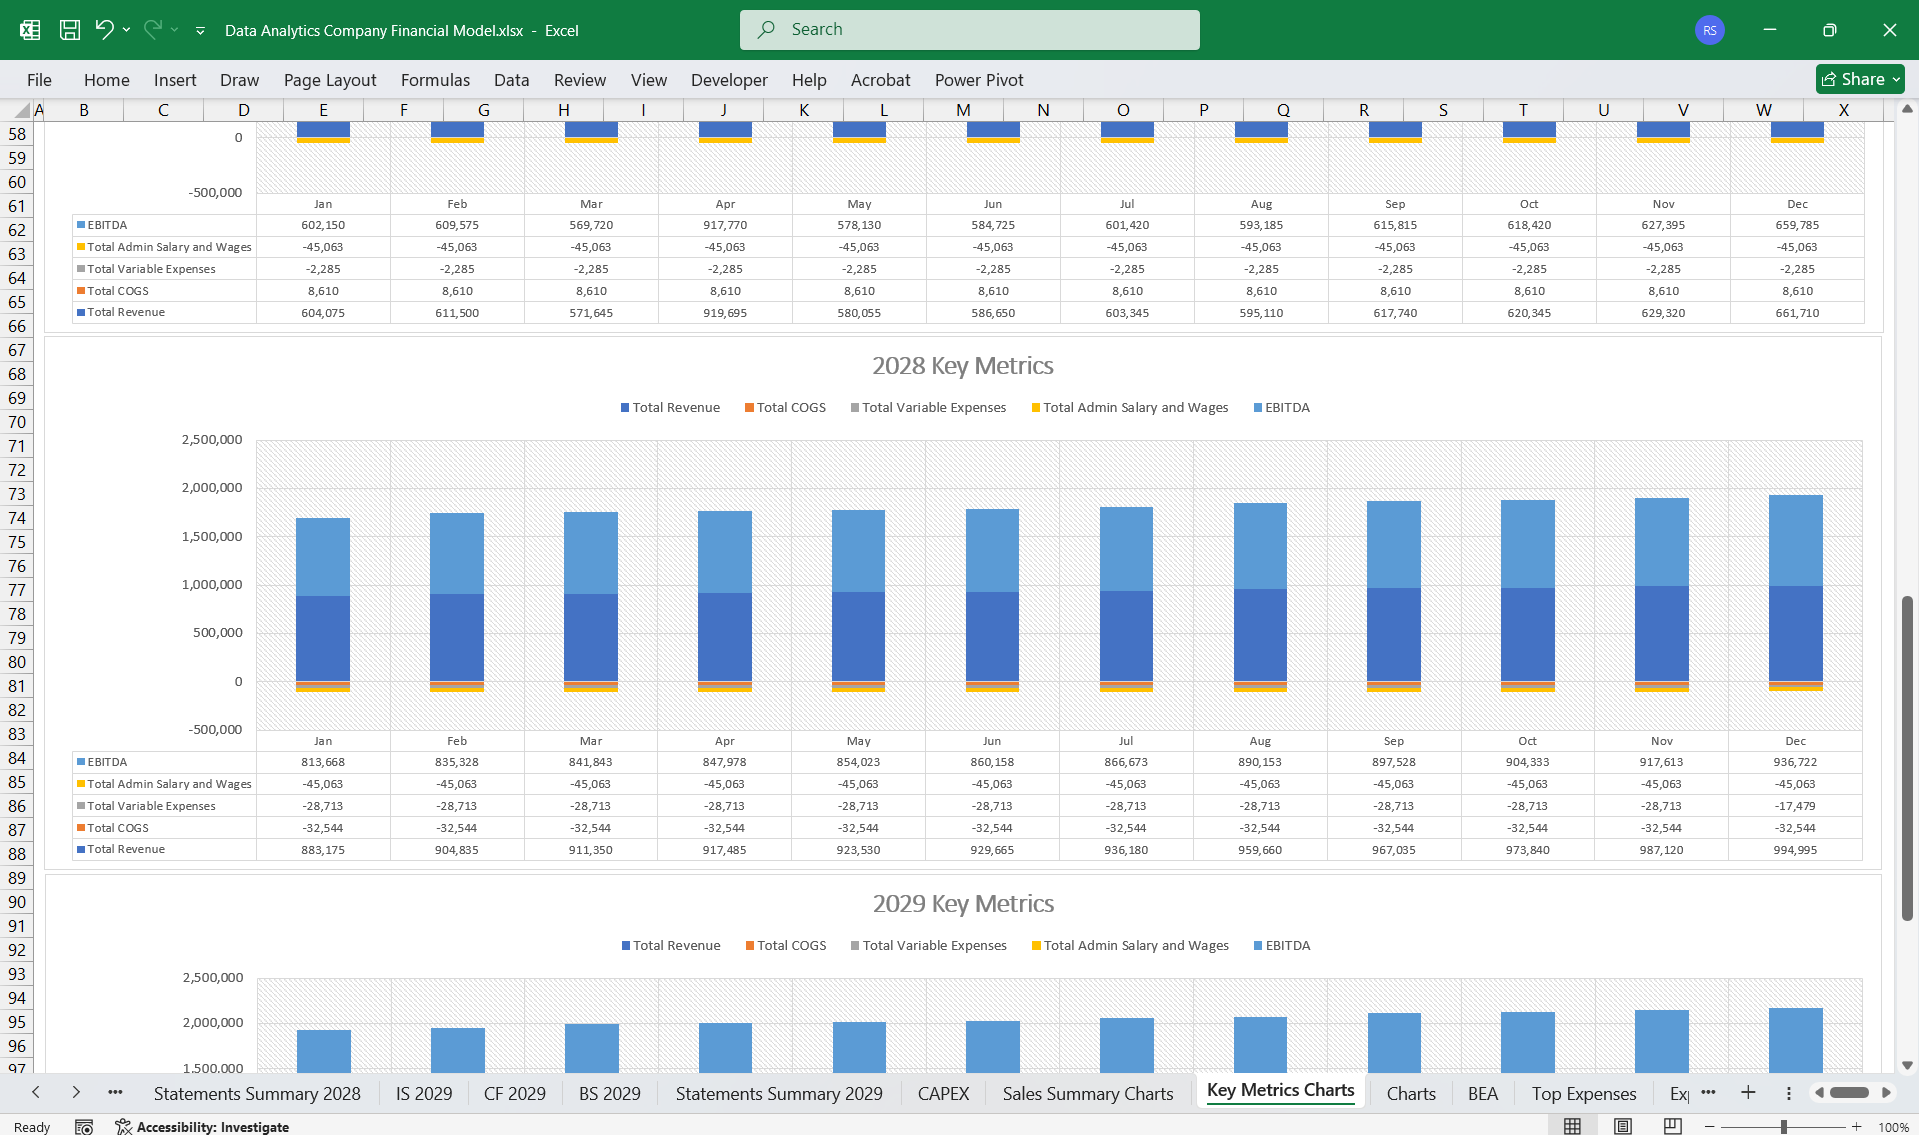
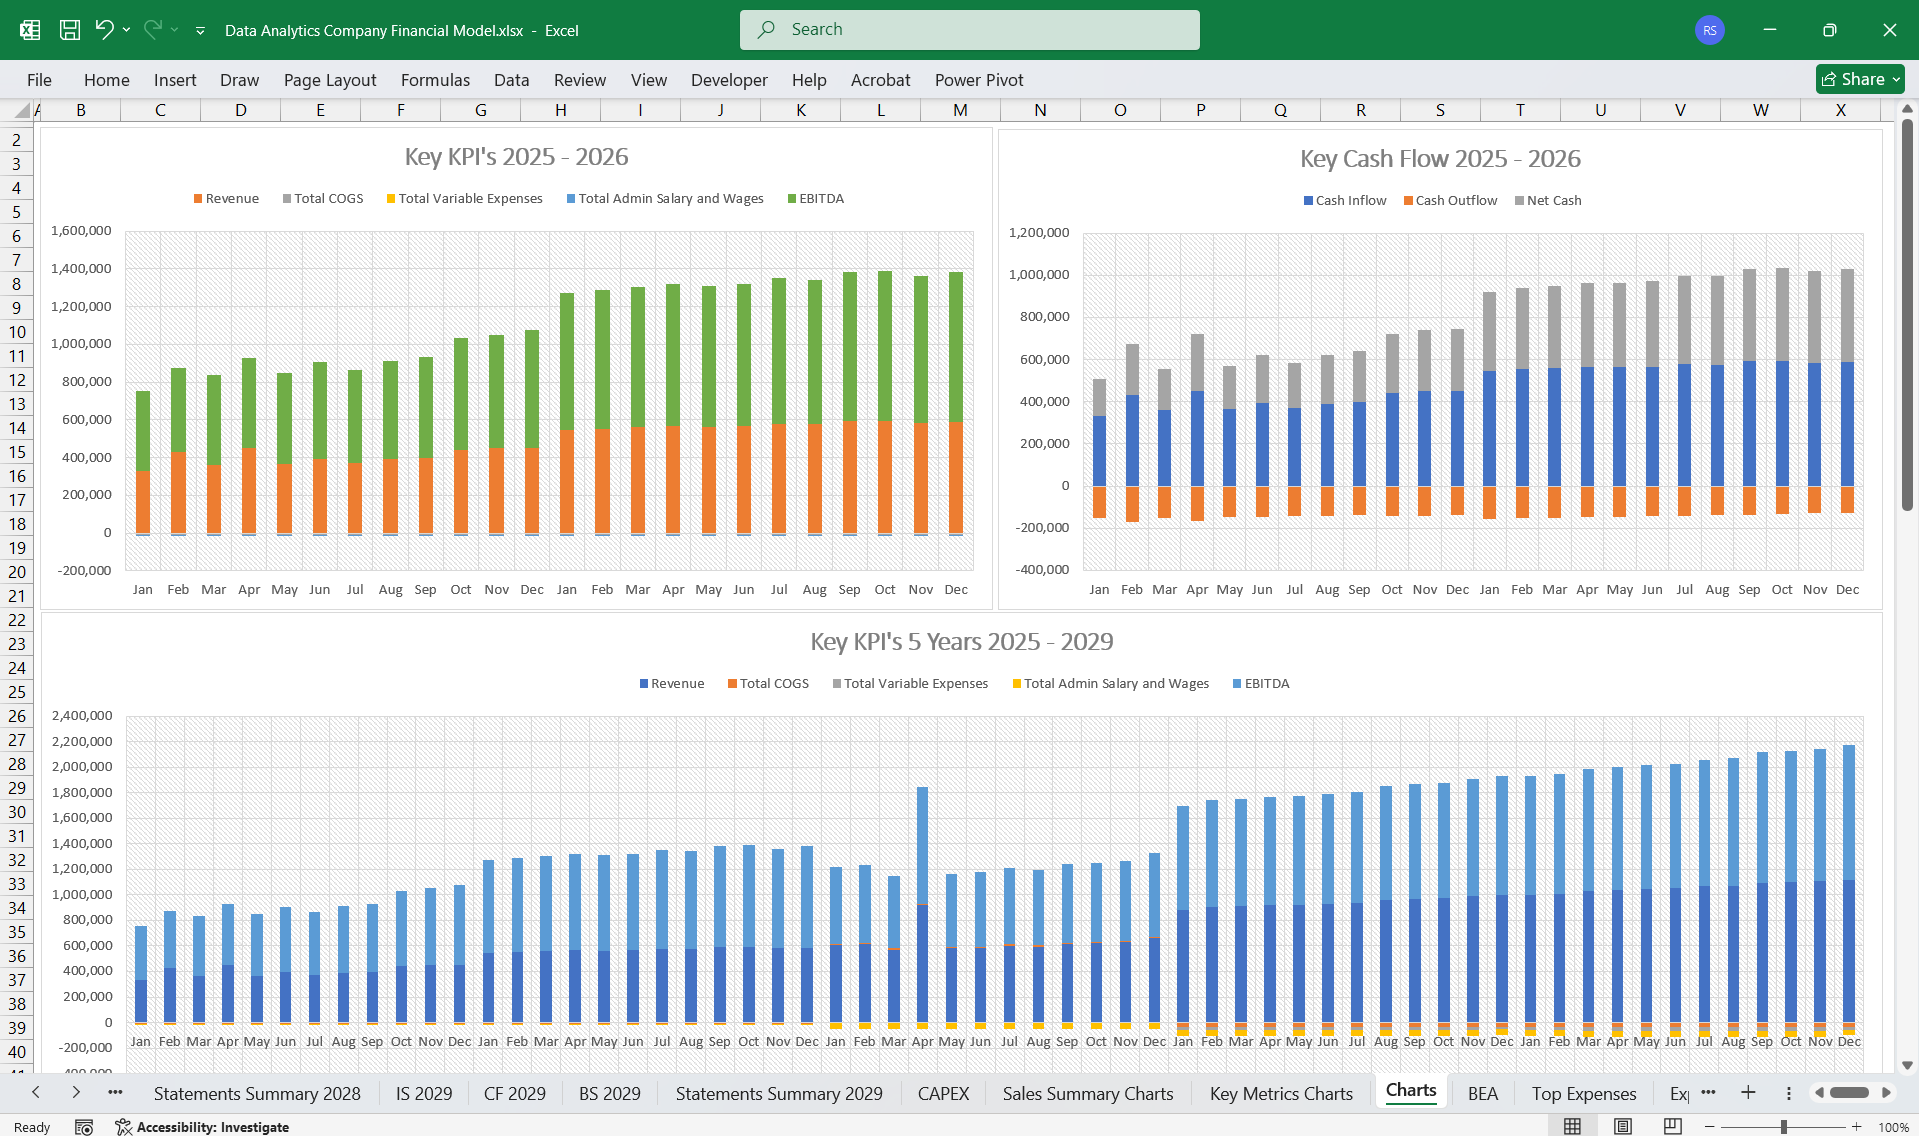
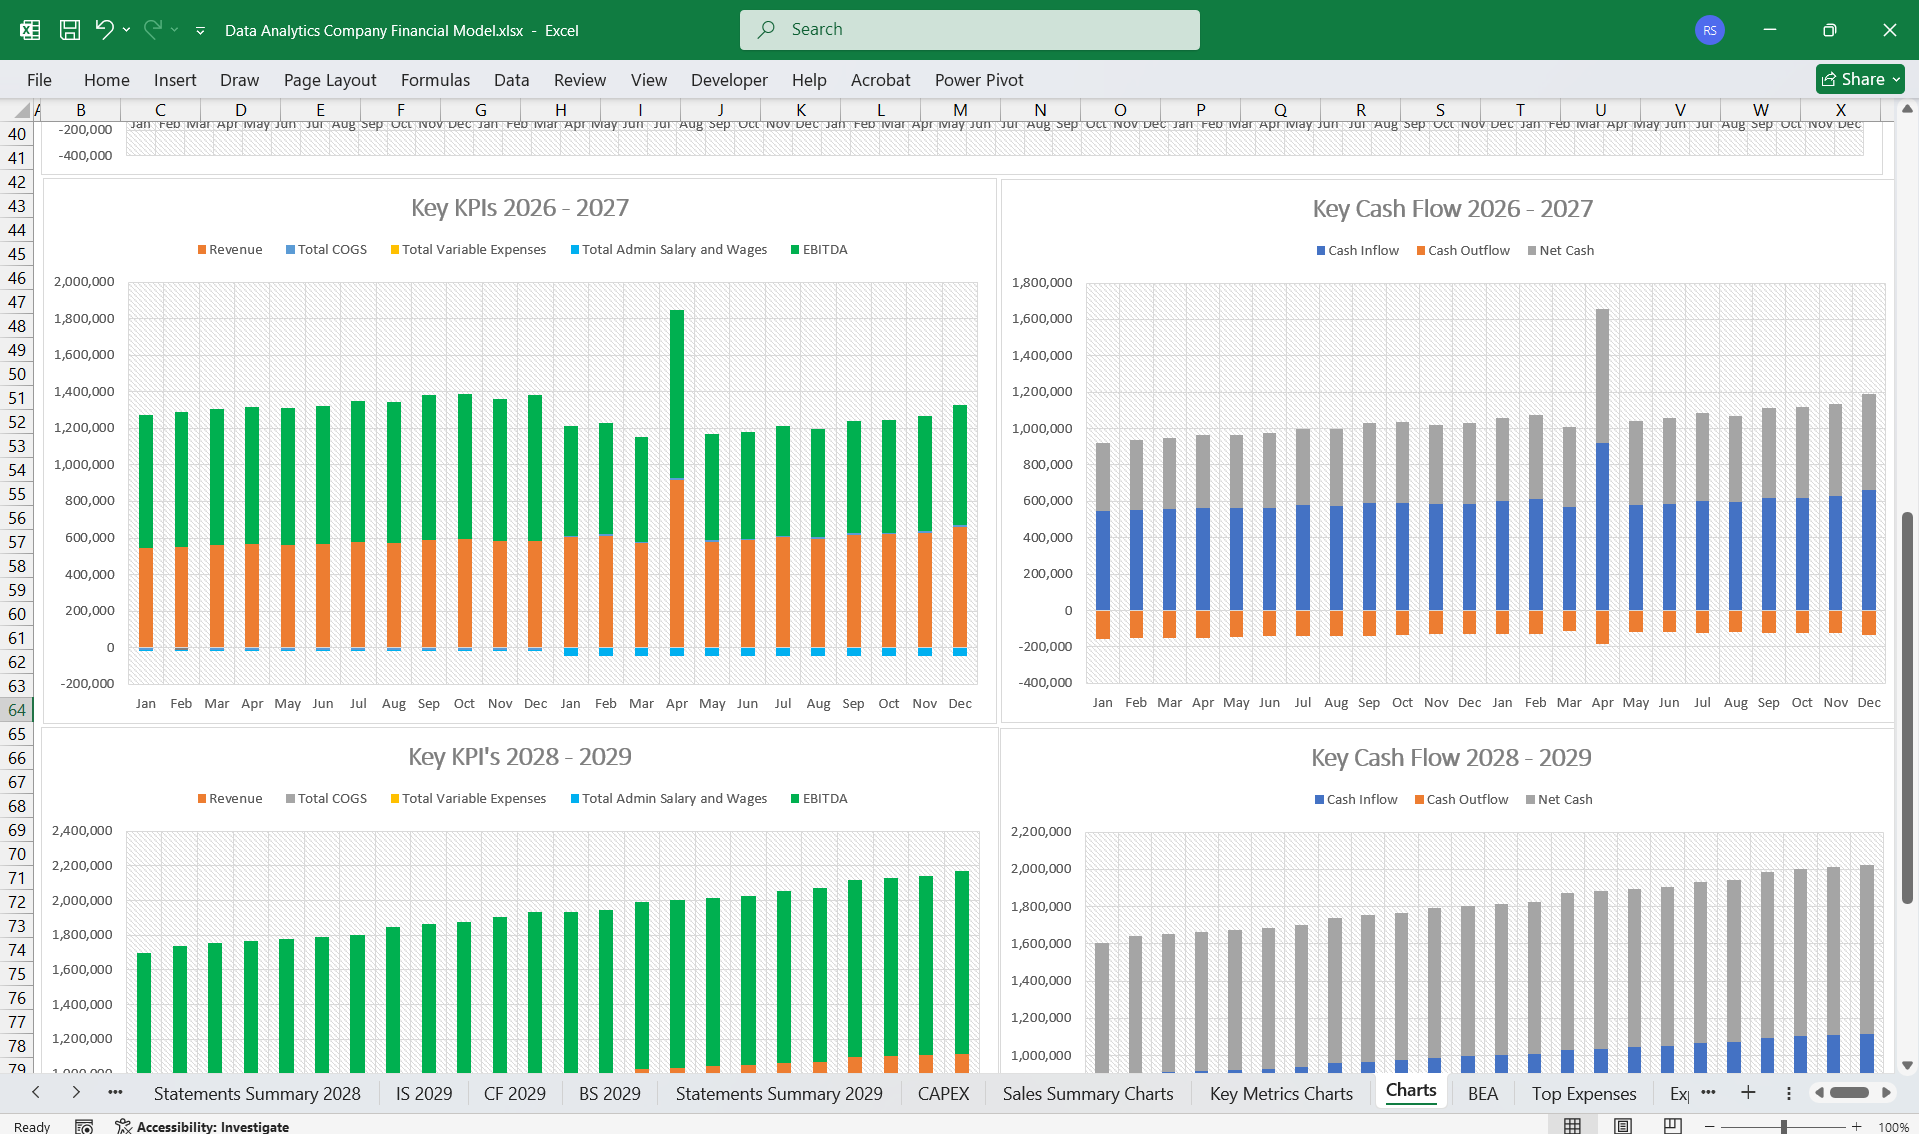
This 3-statement financial model for data analytics companies is a comprehensive tool used to forecast a company's future financial performance.
 by AllFinancialModels
AllFinancialModels offer a curated selection of high-quality yet financial model templates designed to support a wide range of business needs.Follow
data analyticsdatasoftwareexcelfinancial modelfinancedata managementanalytics spreadsheetfinance model
Description
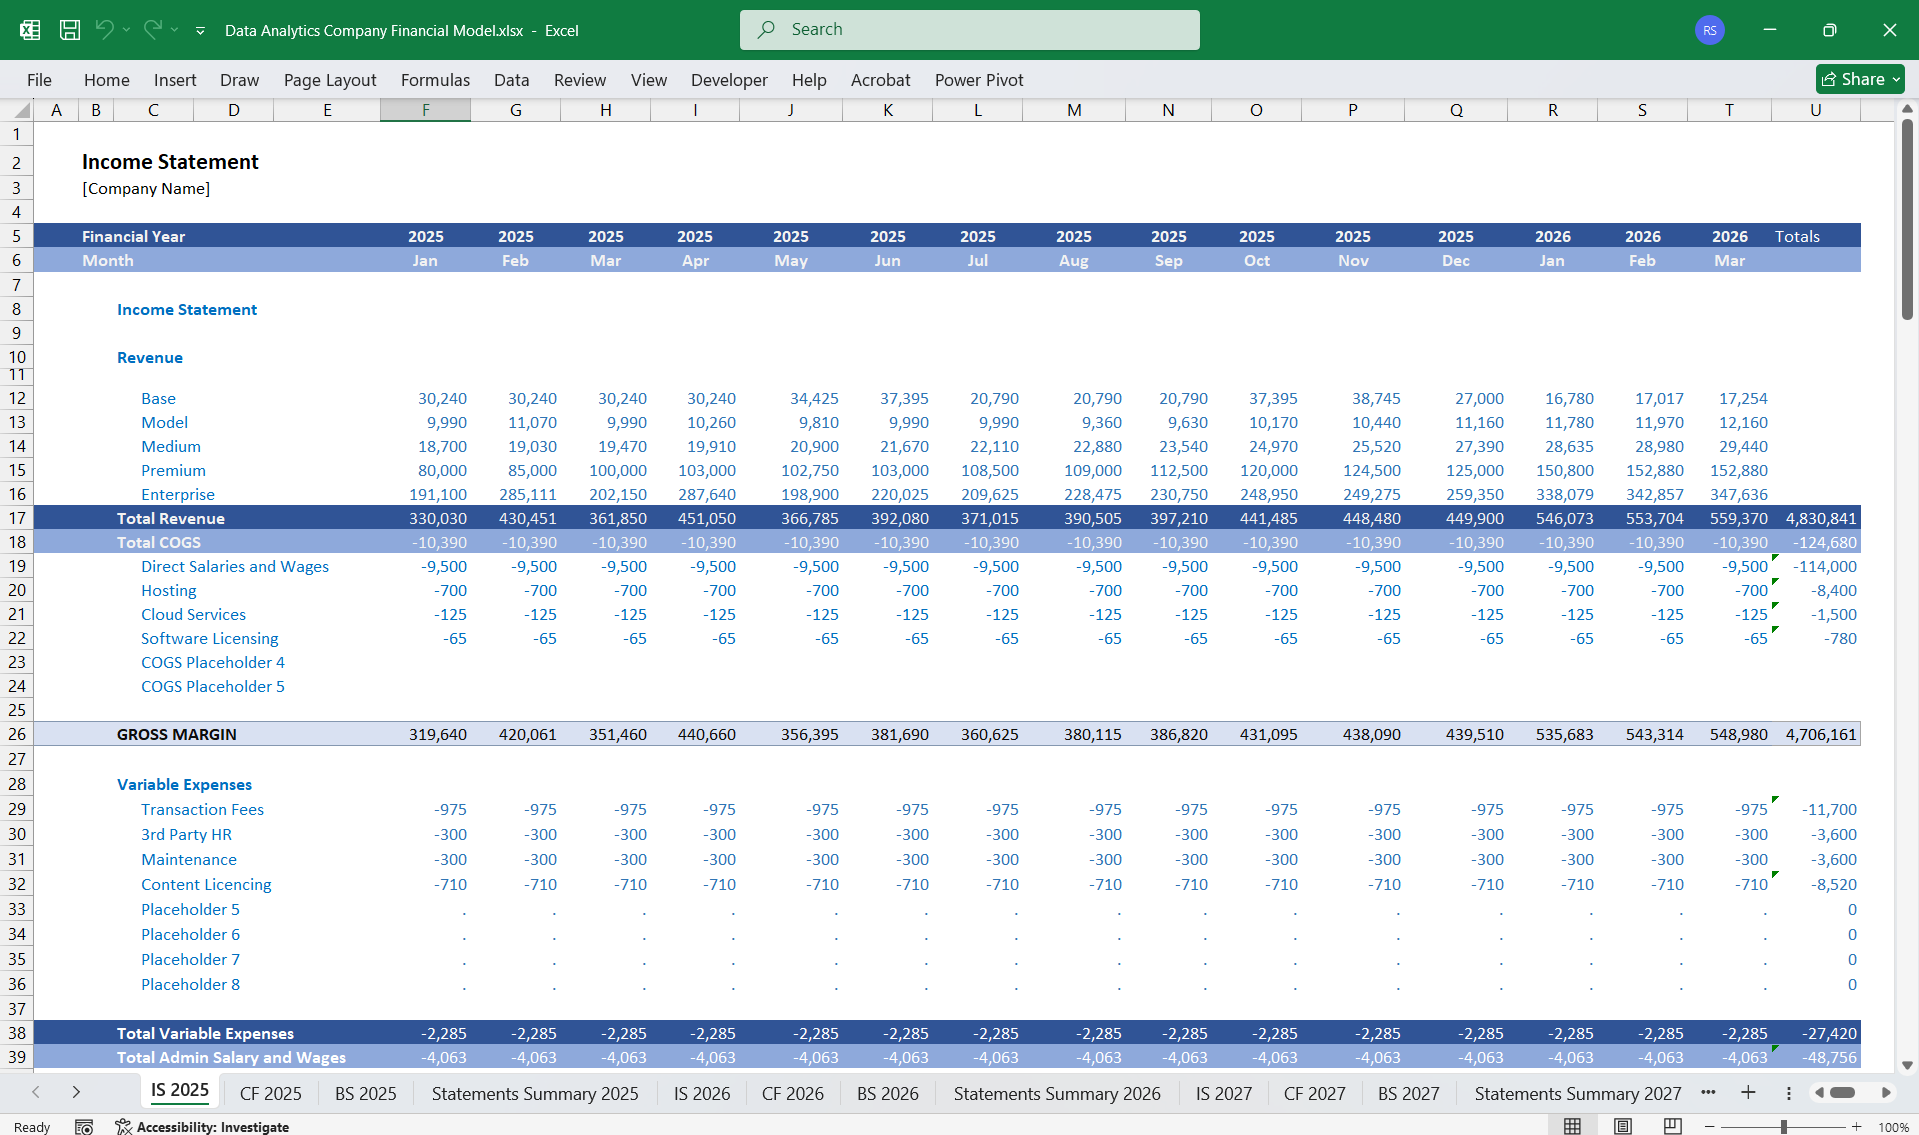
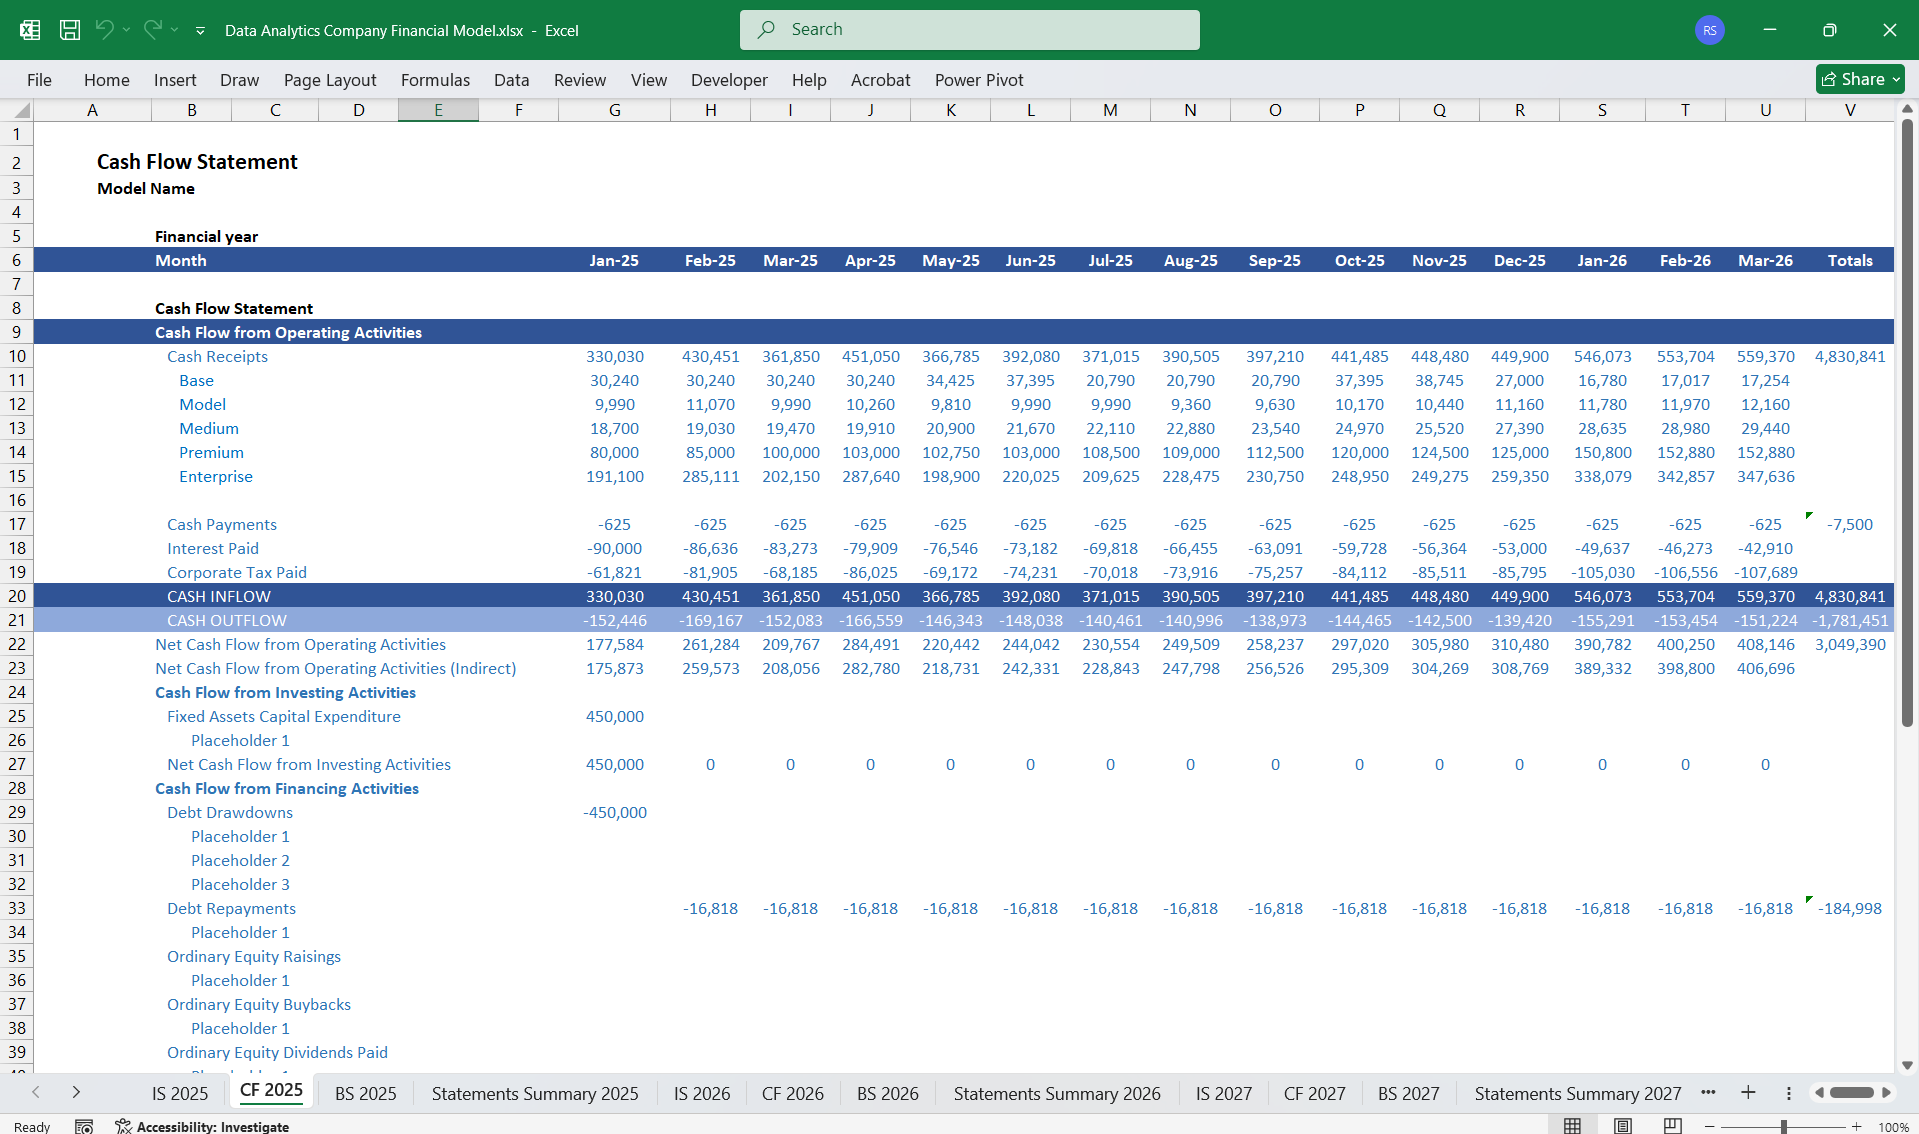
Here is a financial model for a data analytics company, segmented into three key areas: the Income Statement, Cash Flow Statement, and Balance Sheet. Each section focuses on the components typically important for data-driven, project-based companies.
For a subscription-based version, please search our other models.
1. Income Statement (Profit and Loss Statement)Revenues
Here is a financial model for a data analytics company, segmented into three key areas: the Income Statement, Cash Flow Statement, and Balance Sheet. Each section focuses on the components typically important for data-driven, project-based companies.
For a subscription-based version, please search our other models.
1. Income Statement (Profit and Loss Statement)Revenues
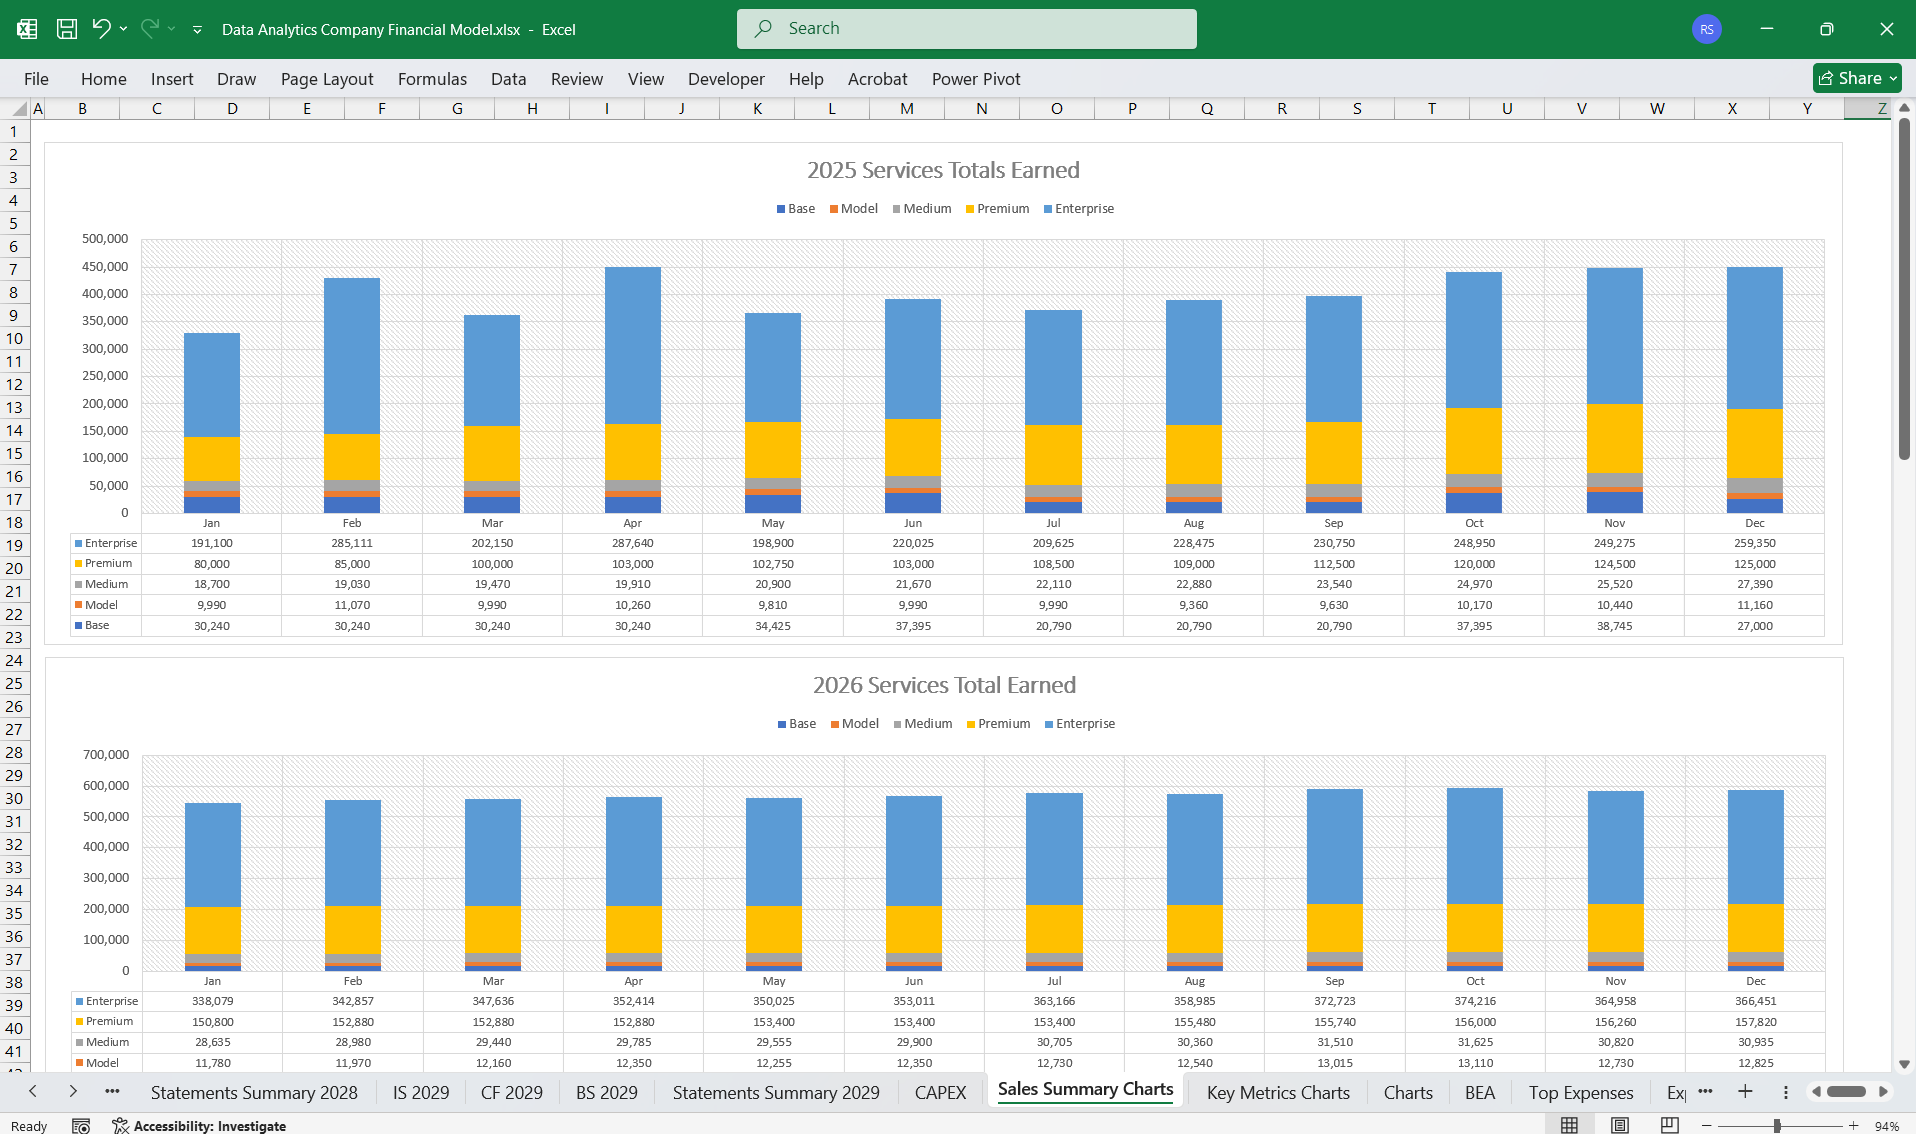
- Subscription Revenue: Recurring revenue from customers subscribed to data analytics tools or dashboards.
- Service Revenue: Non-recurring income from consulting, custom data analysis, or training.
- Data Licensing Revenue: Selling proprietary data sets or access to unique analytics models.
- Partnership Revenue: Earnings from joint ventures, co-licensing products, or affiliate programs.
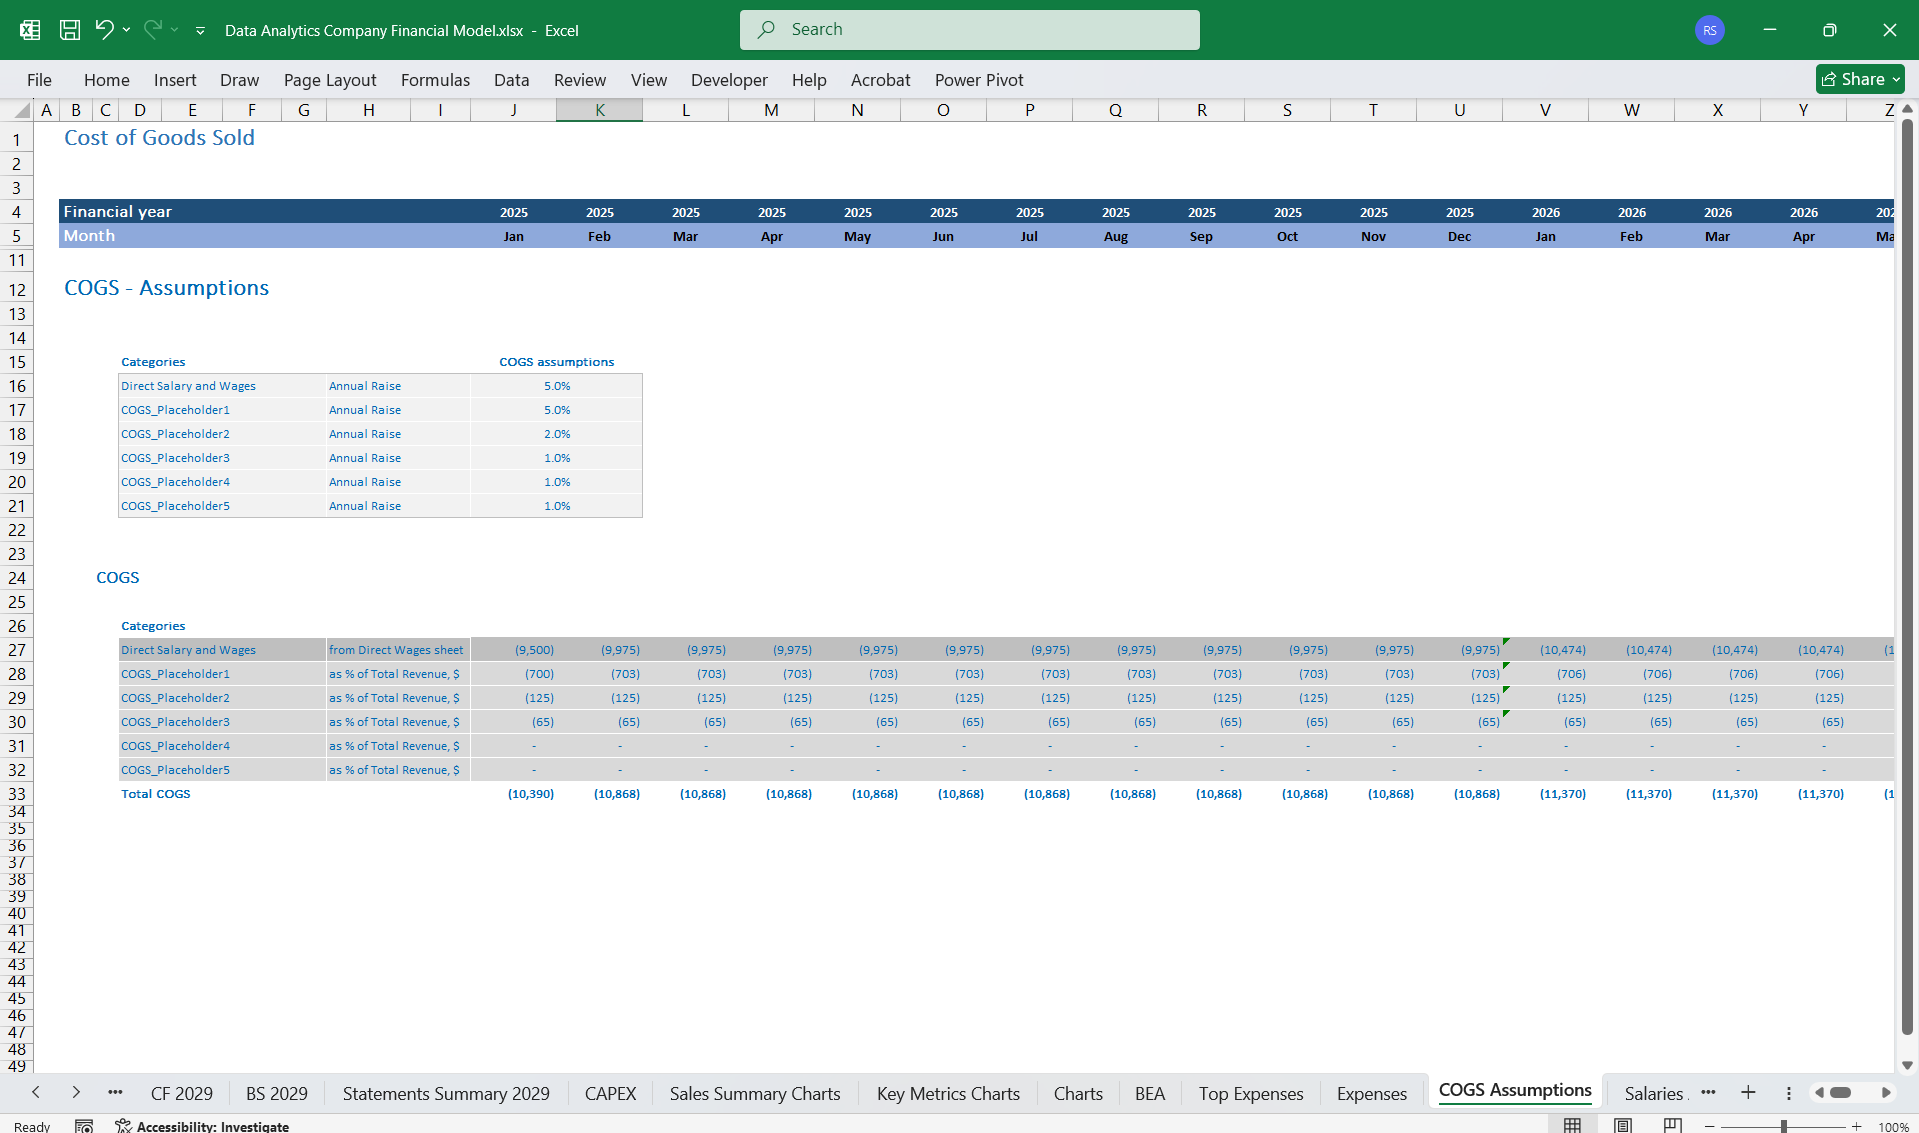
- Hosting Costs: Expenses for cloud services and infrastructure hosting analytics tools.
- Data Acquisition Costs: Cost of acquiring raw data from third-party vendors or providers.
- Labor Costs: Salaries and benefits of data engineers, scientists, and analysts directly involved in delivering services.
- Tool Licenses: Fees for using proprietary algorithms or tools not developed in-house.
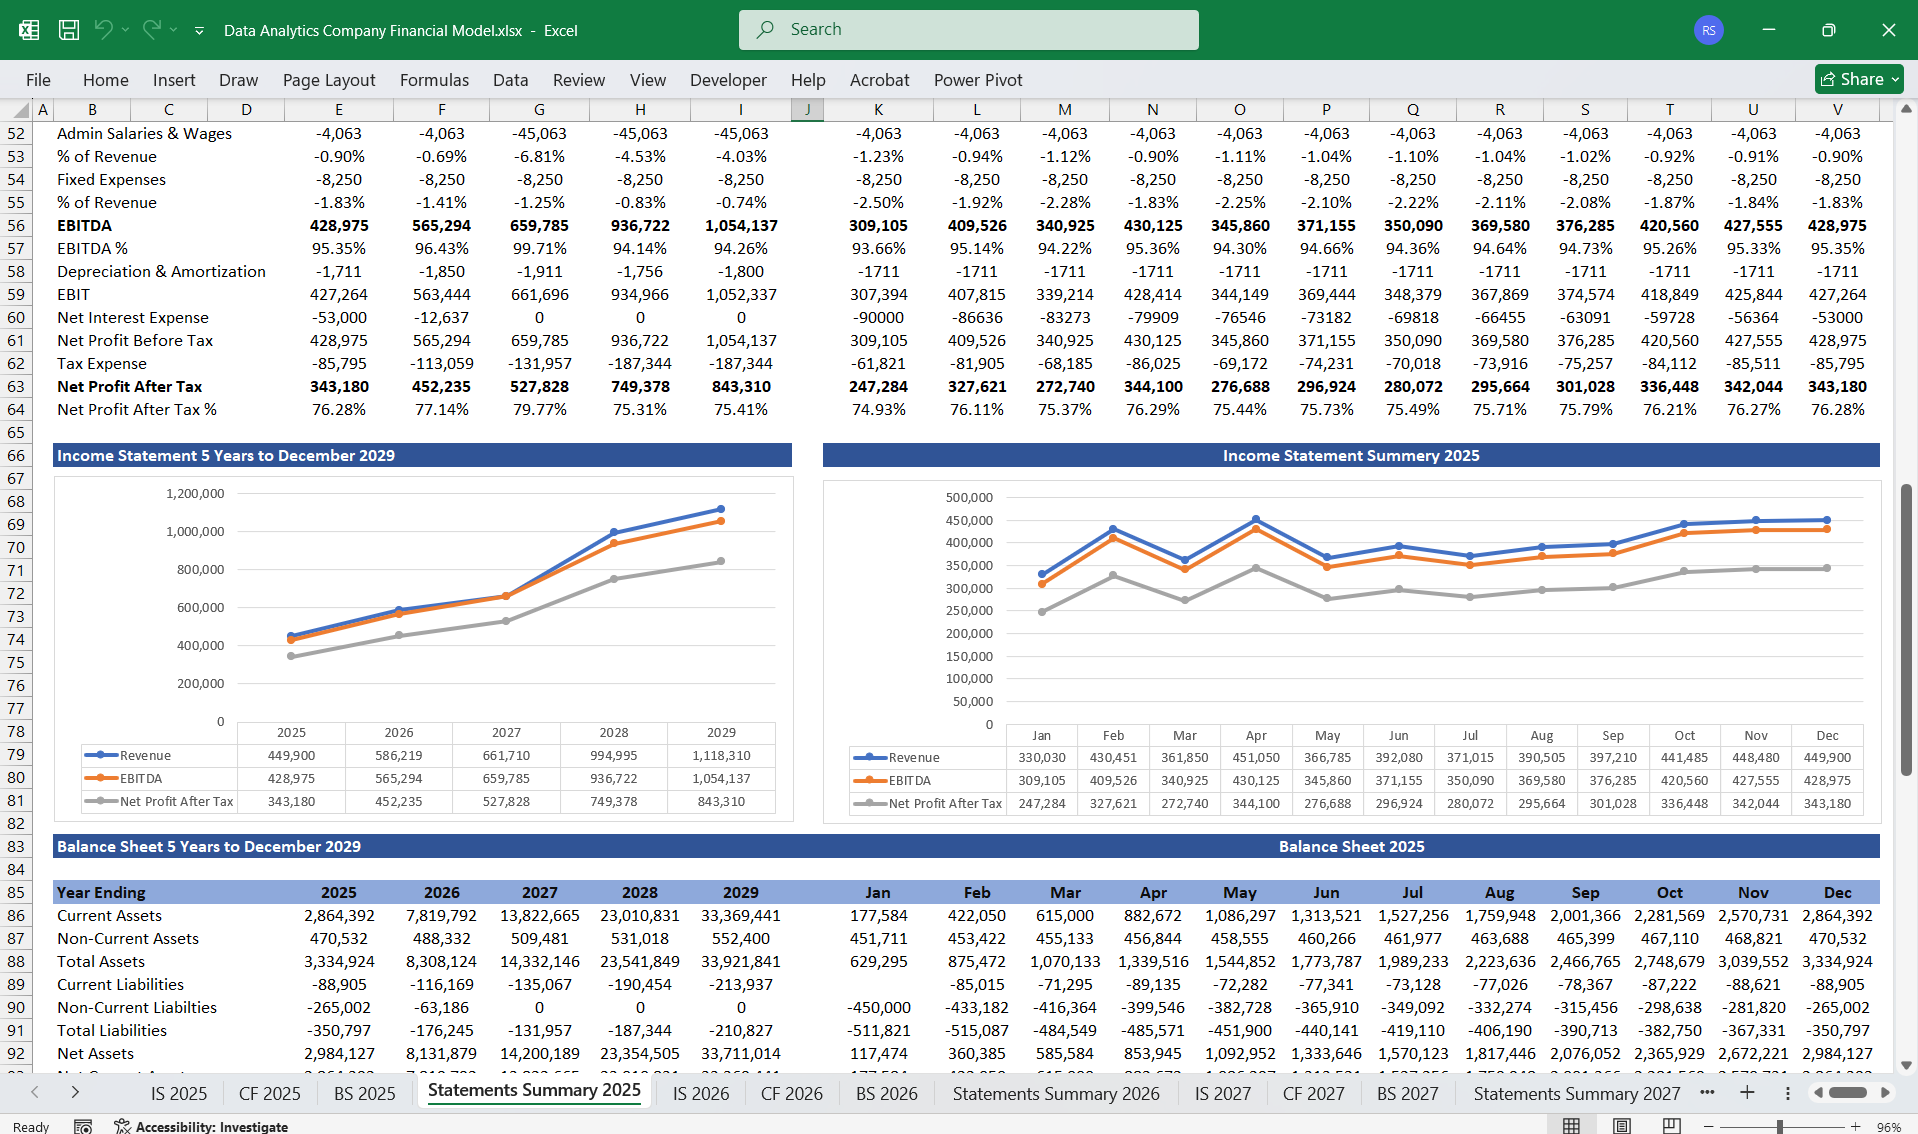
- Gross profit = Revenues - COGS. This will highlight profitability on core operations.
- Sales and Marketing Expenses:
- Advertising campaigns, client acquisition costs, webinars, and sponsorships.
- Salaries of sales and business development teams.
- Research and Development (R&D):
- Investment in new analytics features, platform enhancements, and developing AI/ML models.
- General and Administrative (G&A):
- Salaries of administrative staff, rent, and utilities for office space, insurance, etc.
- Depreciation and Amortization:
- Write-downs for software and physical assets.
- Operating Income = Gross Profit - Operating Expenses.
- Interest Income/Expenses: From cash reserves or outstanding debts.
- Gains or Losses: From currency fluctuations or selling non-core assets.
- Net Income = Operating Income + Other Income/Expenses - Taxes.
- Highlights profitability after all costs and taxes.
- Net Income Adjustments: Adjust net income for non-cash items (e.g., depreciation and amortization).
- Changes in Working Capital:
- Accounts Receivable: Changes due to client payments.
- Accounts Payable: Vendor payments for data acquisition and hosting services.
- Deferred Revenue: Prepaid subscription amounts yet to be recognized as revenue.
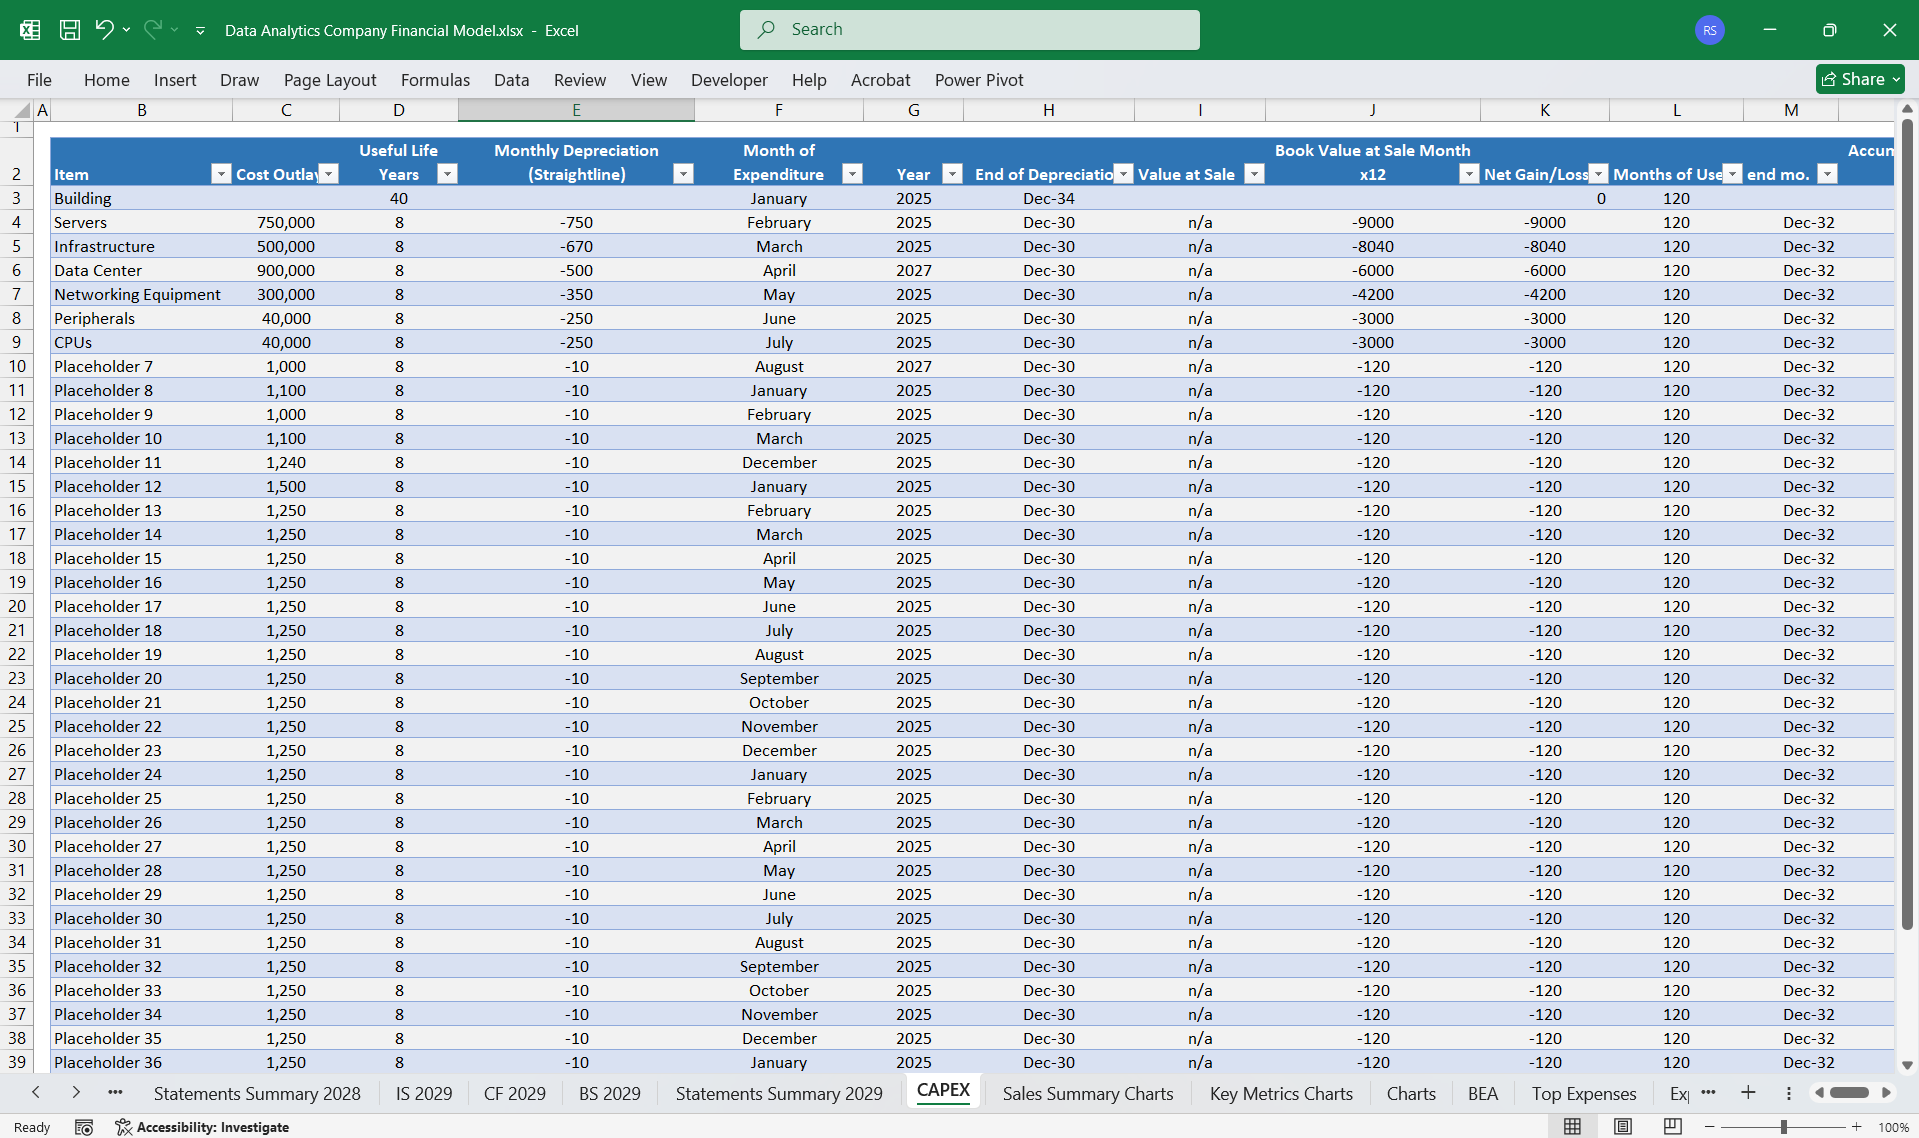
- Capital Expenditures (CapEx): Investment in servers, office infrastructure, and tech development.
- Software Development: Capitalized expenses for internally developed platforms/tools.
- Acquisitions: Purchasing proprietary datasets, companies, or technology to expand capabilities.
- Equity Financing: Issuing equity or convertible notes to raise cash.
- Debt Management: Loans taken or repaid.
- Dividend Payments: If the company distributes a portion of its profits to shareholders.
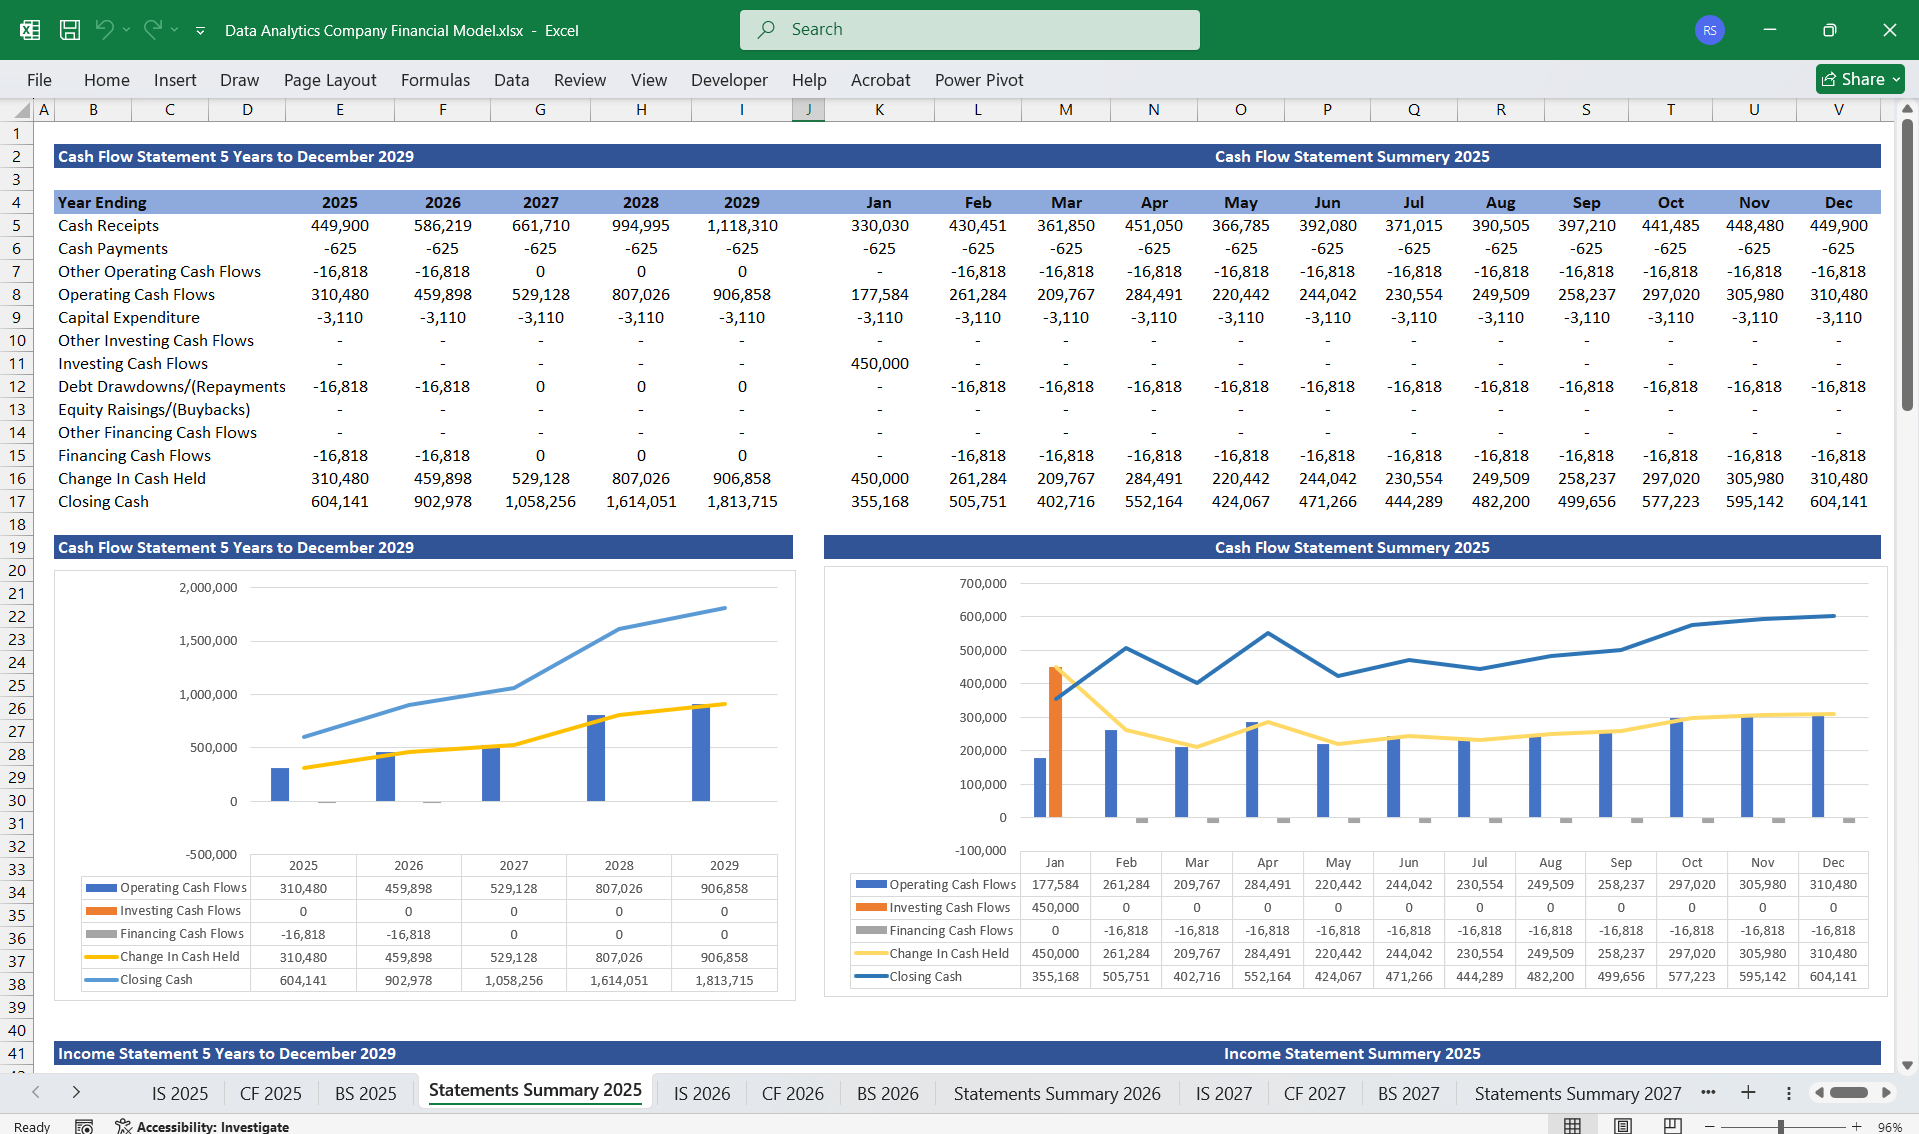
- Aggregate of cash inflows/outflows from Operating, Investing, and Financing activities.
- Reconcile total cash flow with starting cash to derive the closing cash balance.
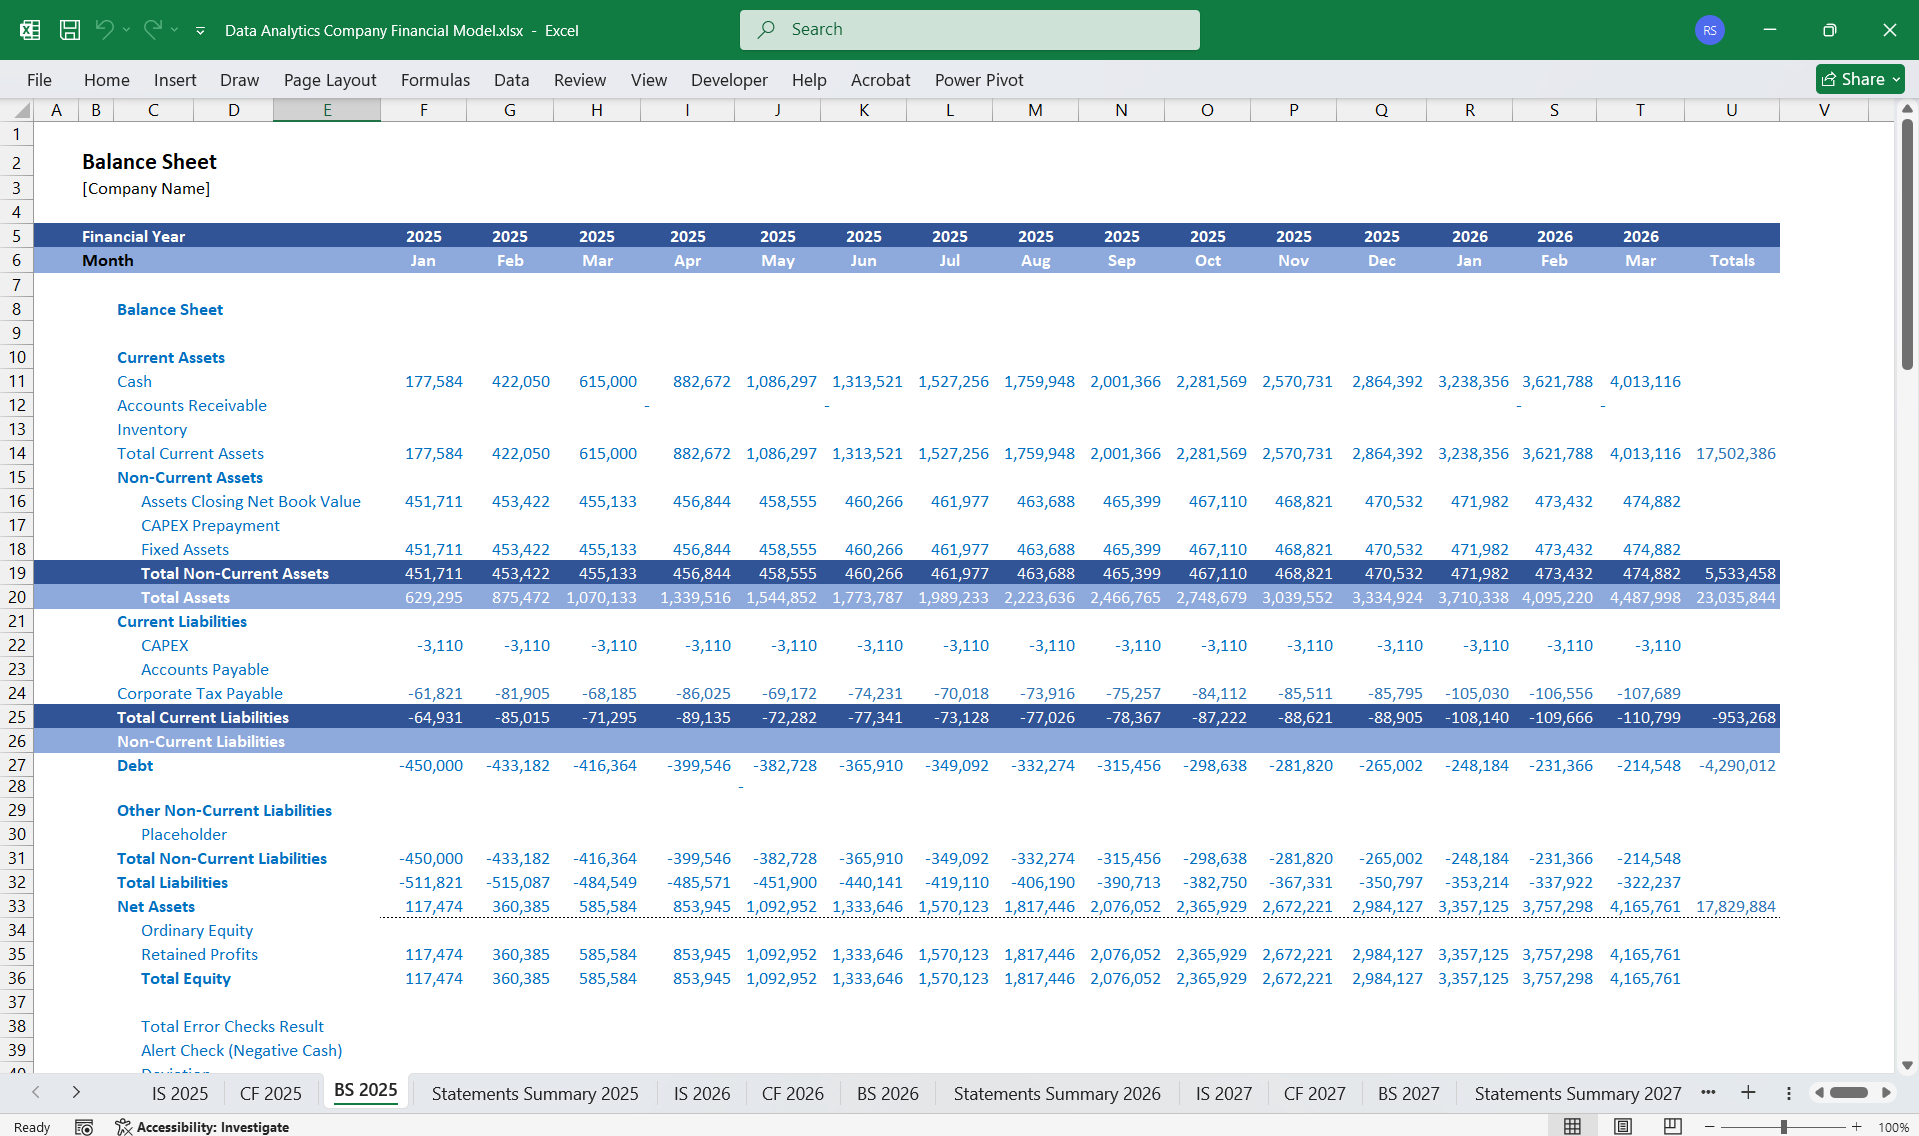
- Current Assets:
- Cash and Cash Equivalents: Cash reserves and easily liquidated investments.
- Accounts Receivable: Invoices billed for projects or subscriptions.
- Prepaid Expenses: Costs paid upfront (e.g., cloud service contracts, marketing retainers).
- Non-Current Assets:
- Intangible Assets: Proprietary algorithms, developed analytics platforms, data rights.
- Property, Plant, and Equipment (PP&E): Servers, office spaces, and equipment.
- Goodwill: Value from acquisitions or strategic partnerships.
- Current Liabilities:
- Accounts Payable: Payments due to vendors (data suppliers, hosting providers, etc.).
- Deferred Revenue: Subscription fees received in advance.
- Short-term Debt: Any loan or credit facility due within a year.
- Long-Term Liabilities:
- Long-term Debt: Loans, bonds, or financing arrangements beyond a year.
- Lease Obligations: For cloud storage or office leases.
- Deferred Tax Liabilities: Taxes owed due to timing differences in revenue recognition.
- Common Stock: Issued stock value.
- Retained Earnings: Accumulated profits reinvested into the company.
- Shareholder Equity: Residual claim on assets after liabilities are satisfied.
- Debt-to-Equity Ratio: To gauge leverage.
- Current Ratio: Current Assets / Current Liabilities, to assess short-term liquidity.
- Quick Ratio: (Cash + Accounts Receivable) / Current Liabilities, for immediate solvency.
- Growth rate of users and subscriptions.
- Average Revenue per User (ARPU).
- Cost growth rates for personnel, infrastructure, and R&D.
- Retention rates and churn rates for subscription clients.
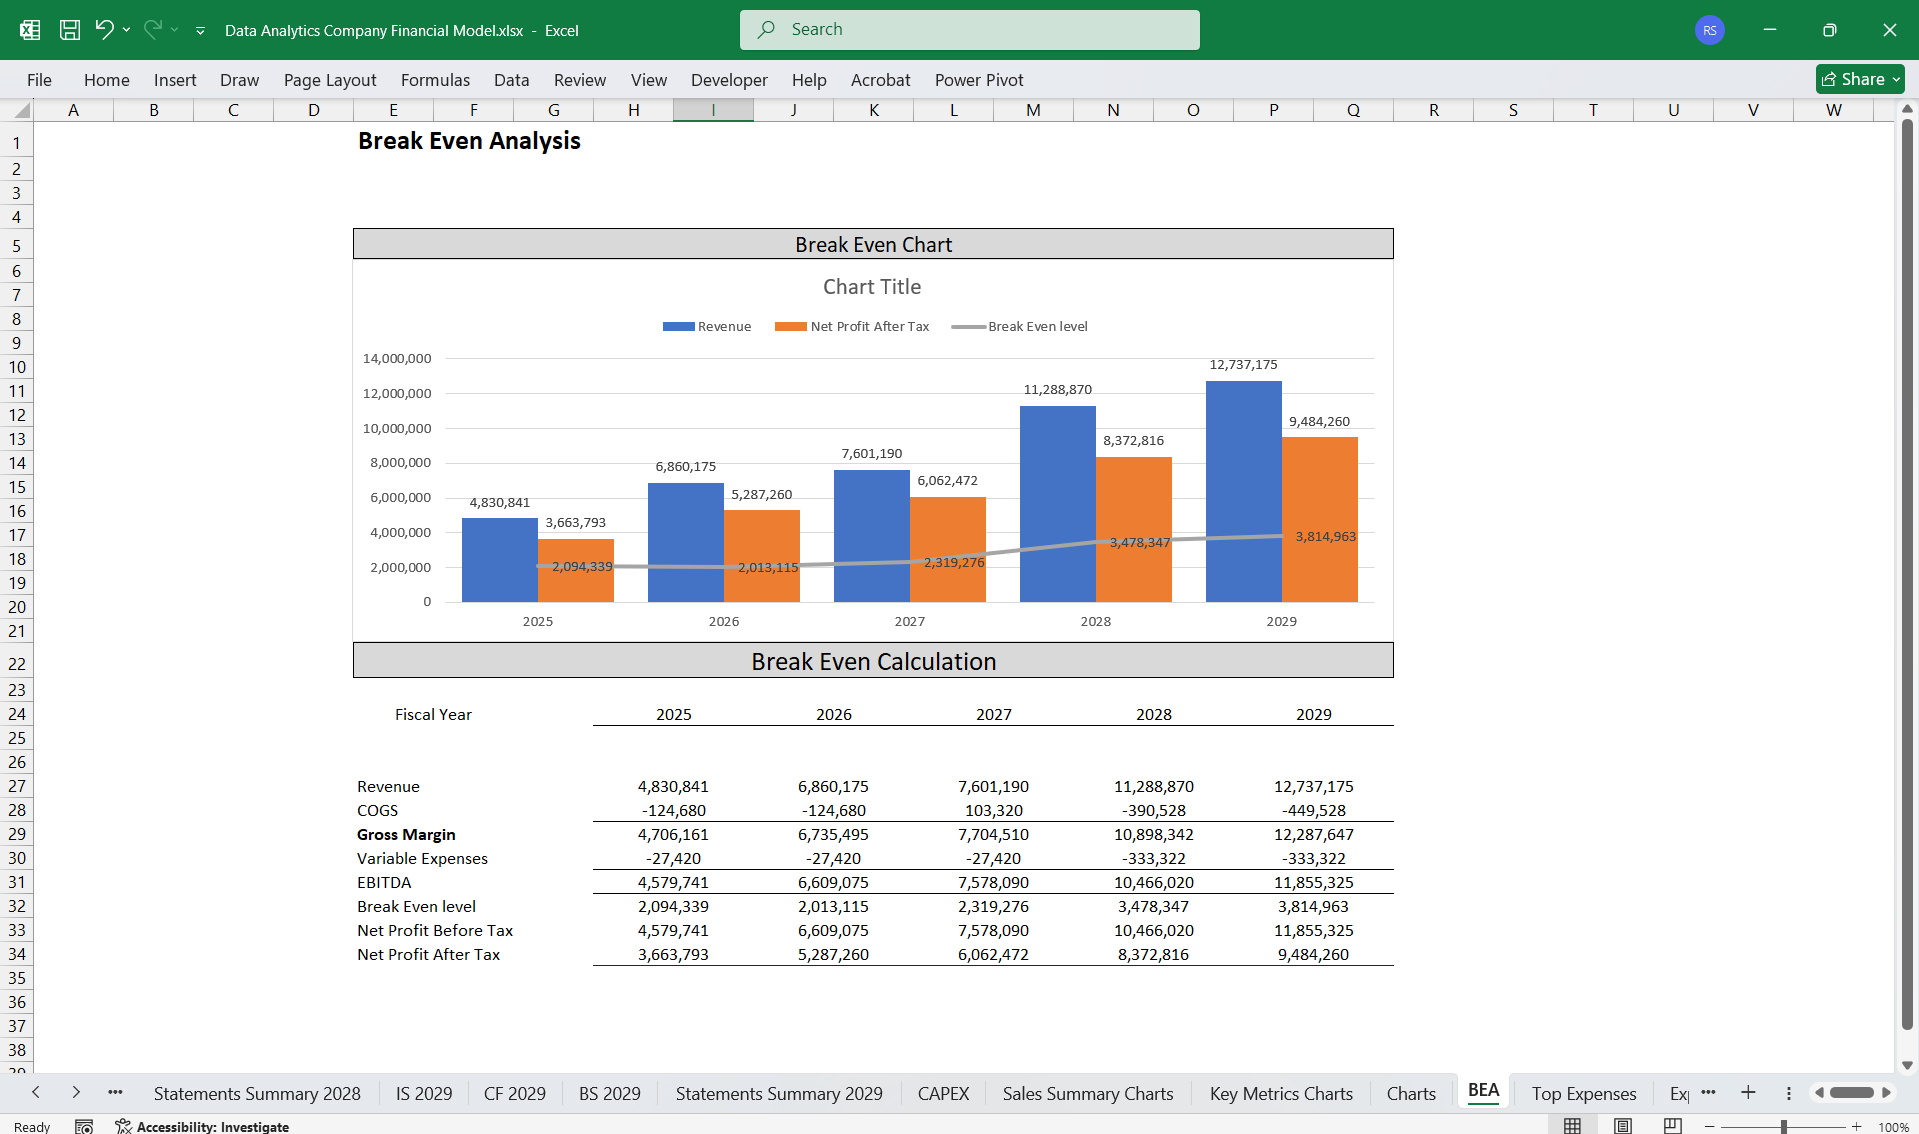
- Three to Five-Year Forecasts: Include anticipated revenue, operating expenses, and cash flow assumptions.
- Scenario Analysis: Best, worst, and base-case projections to test business model resilience.
- Customer Lifetime Value (CLV): Total revenue from an average customer over their subscription period.
- Churn Rate: Percentage of customers leaving in a given period.
- Gross Margin: Gross Profit / Revenue.
- Burn Rate: Monthly negative cash flow during growth phases.
This Best Practice includes
1 Excel Financial Model
Further information
Provides thorough oversight, tracking, and reporting of Data Analytics finances, including updates on budget utilisation and projections.
