Agentic‑AI Revenue & Cost Model: Token‑Driven P&L & Cap Table
Originally published: 29/07/2025 21:02
Publication number: ELQ-43781-1
View all versions & Certificate
certified

Agentic‑AI Revenue & Cost Model: Token‑Driven P&L & Cap Table

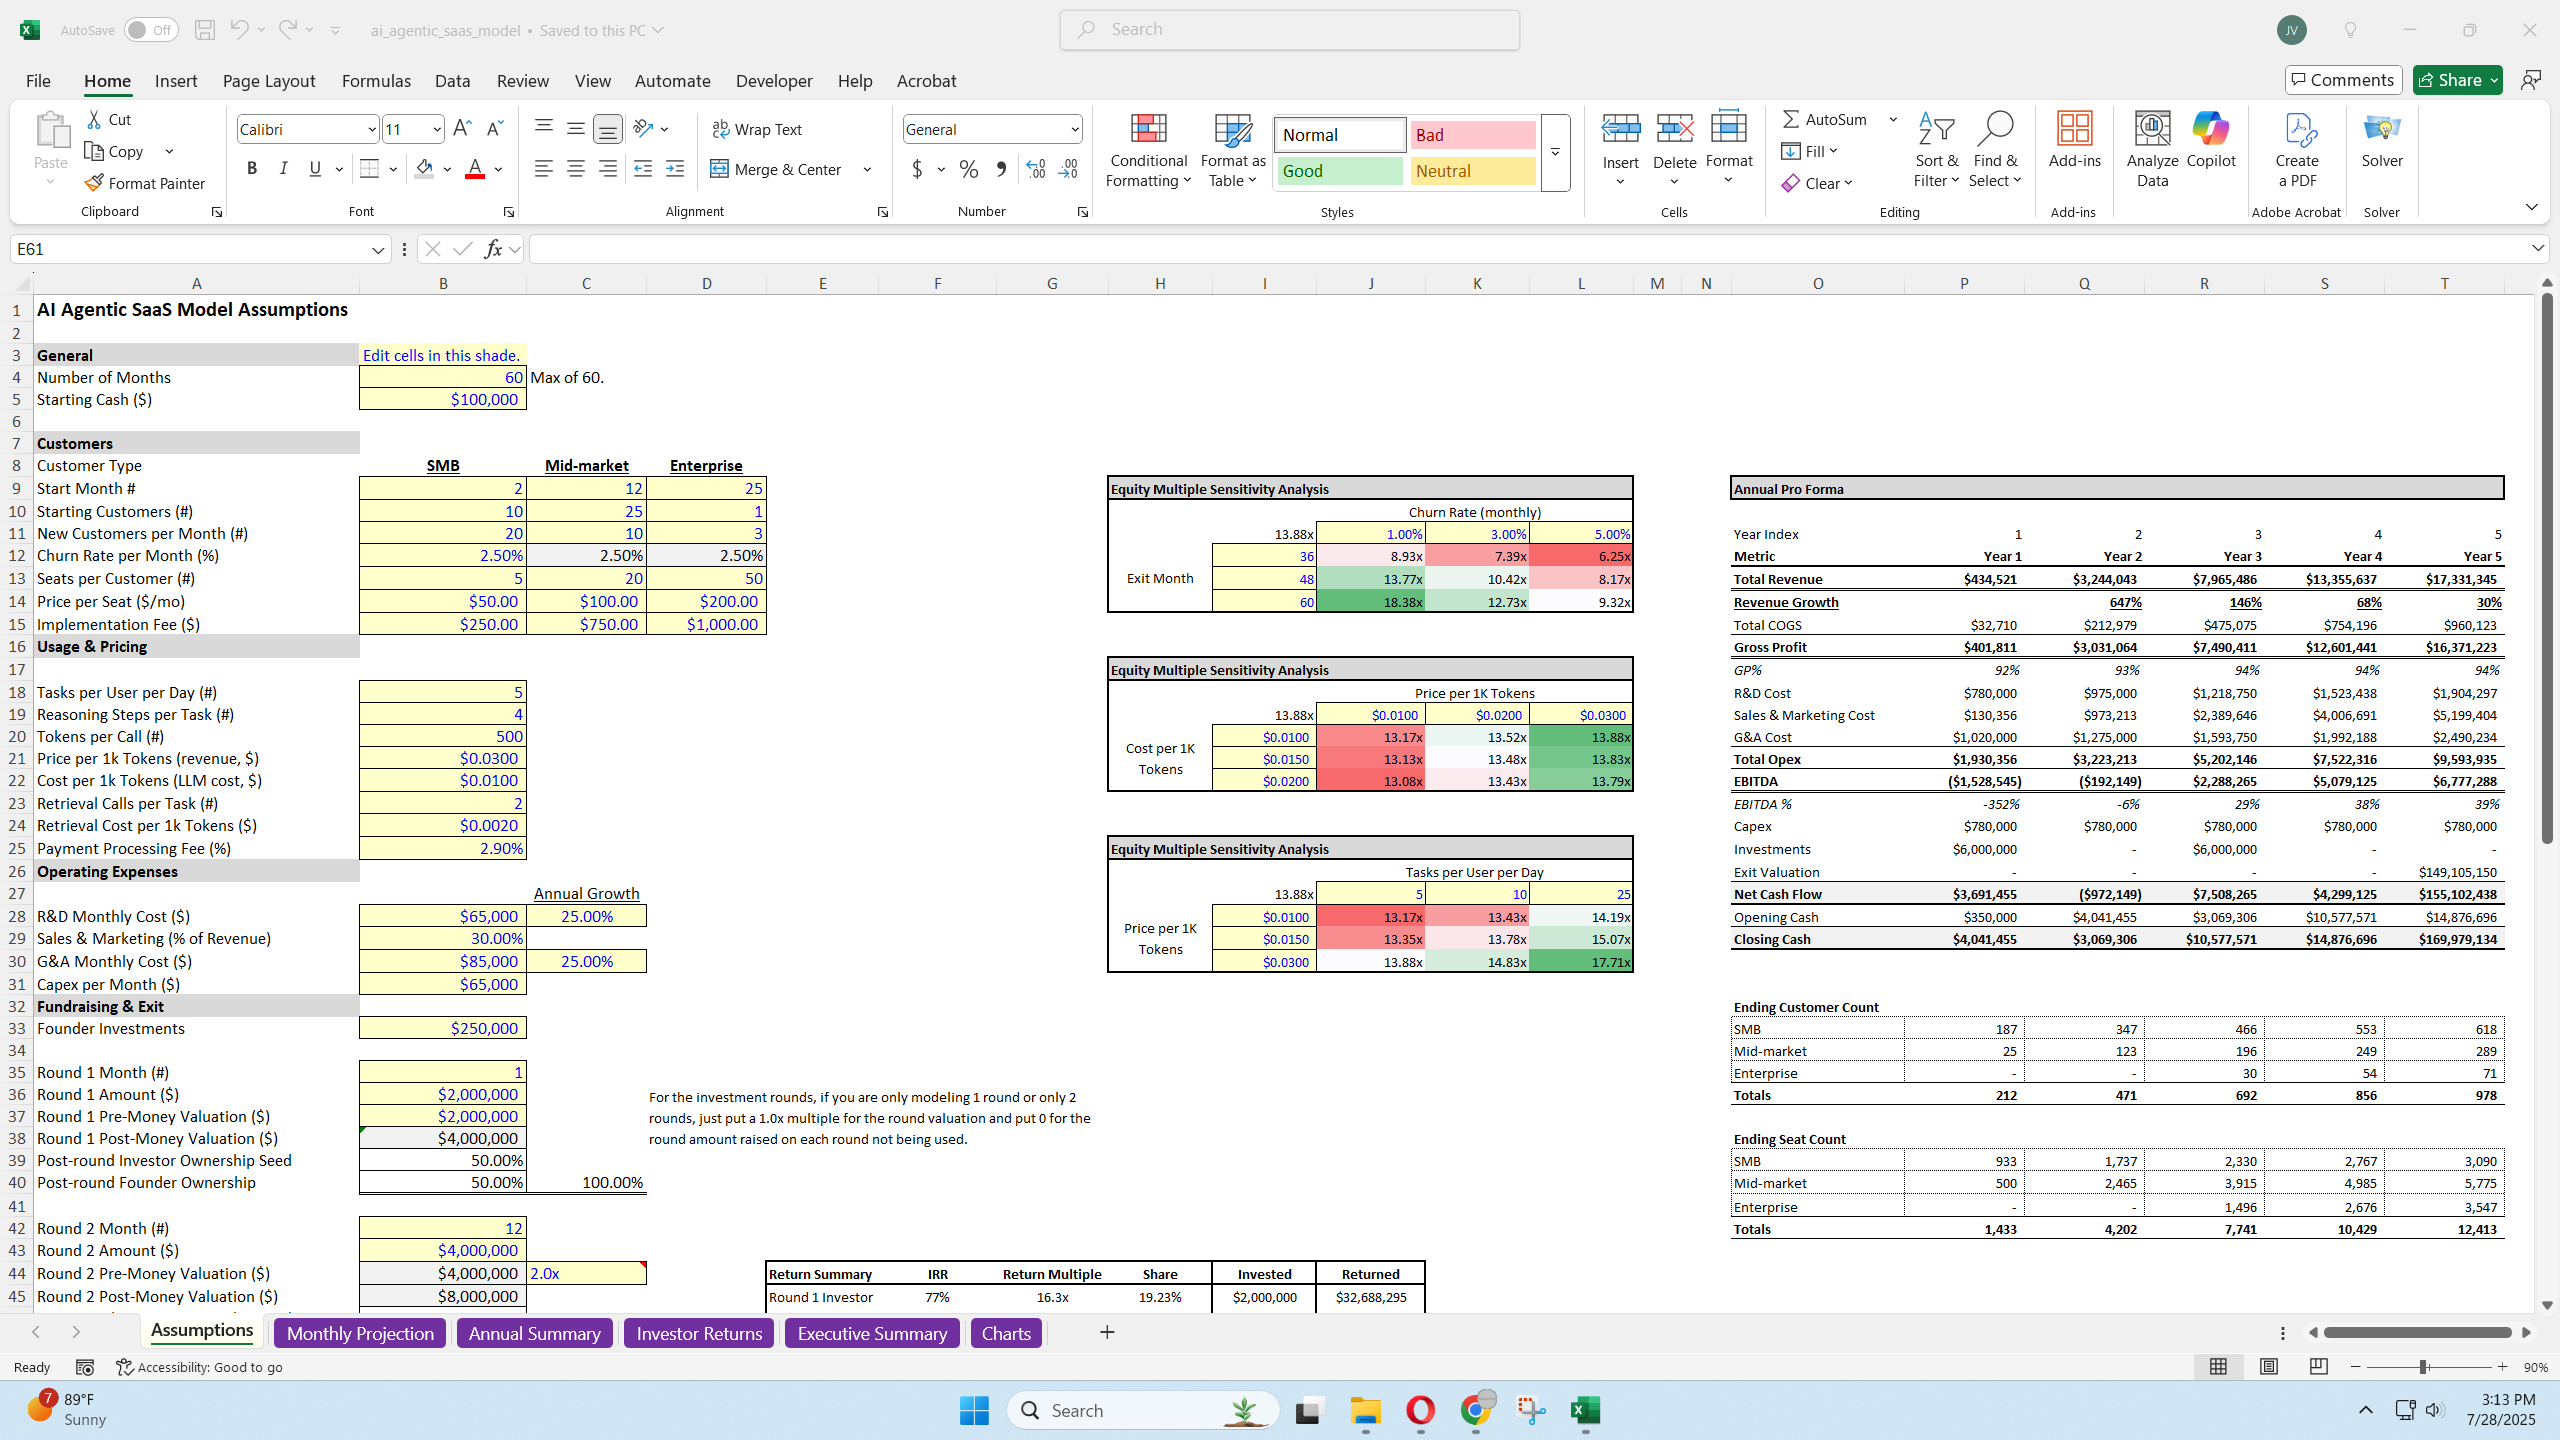
Plan out all your agentic-AI SaaS business assumptions on a single tab with this user-friendly model. It was designed for speed and quick analysis.

Description

Agentic‑AI Financial Model – Quick Overview

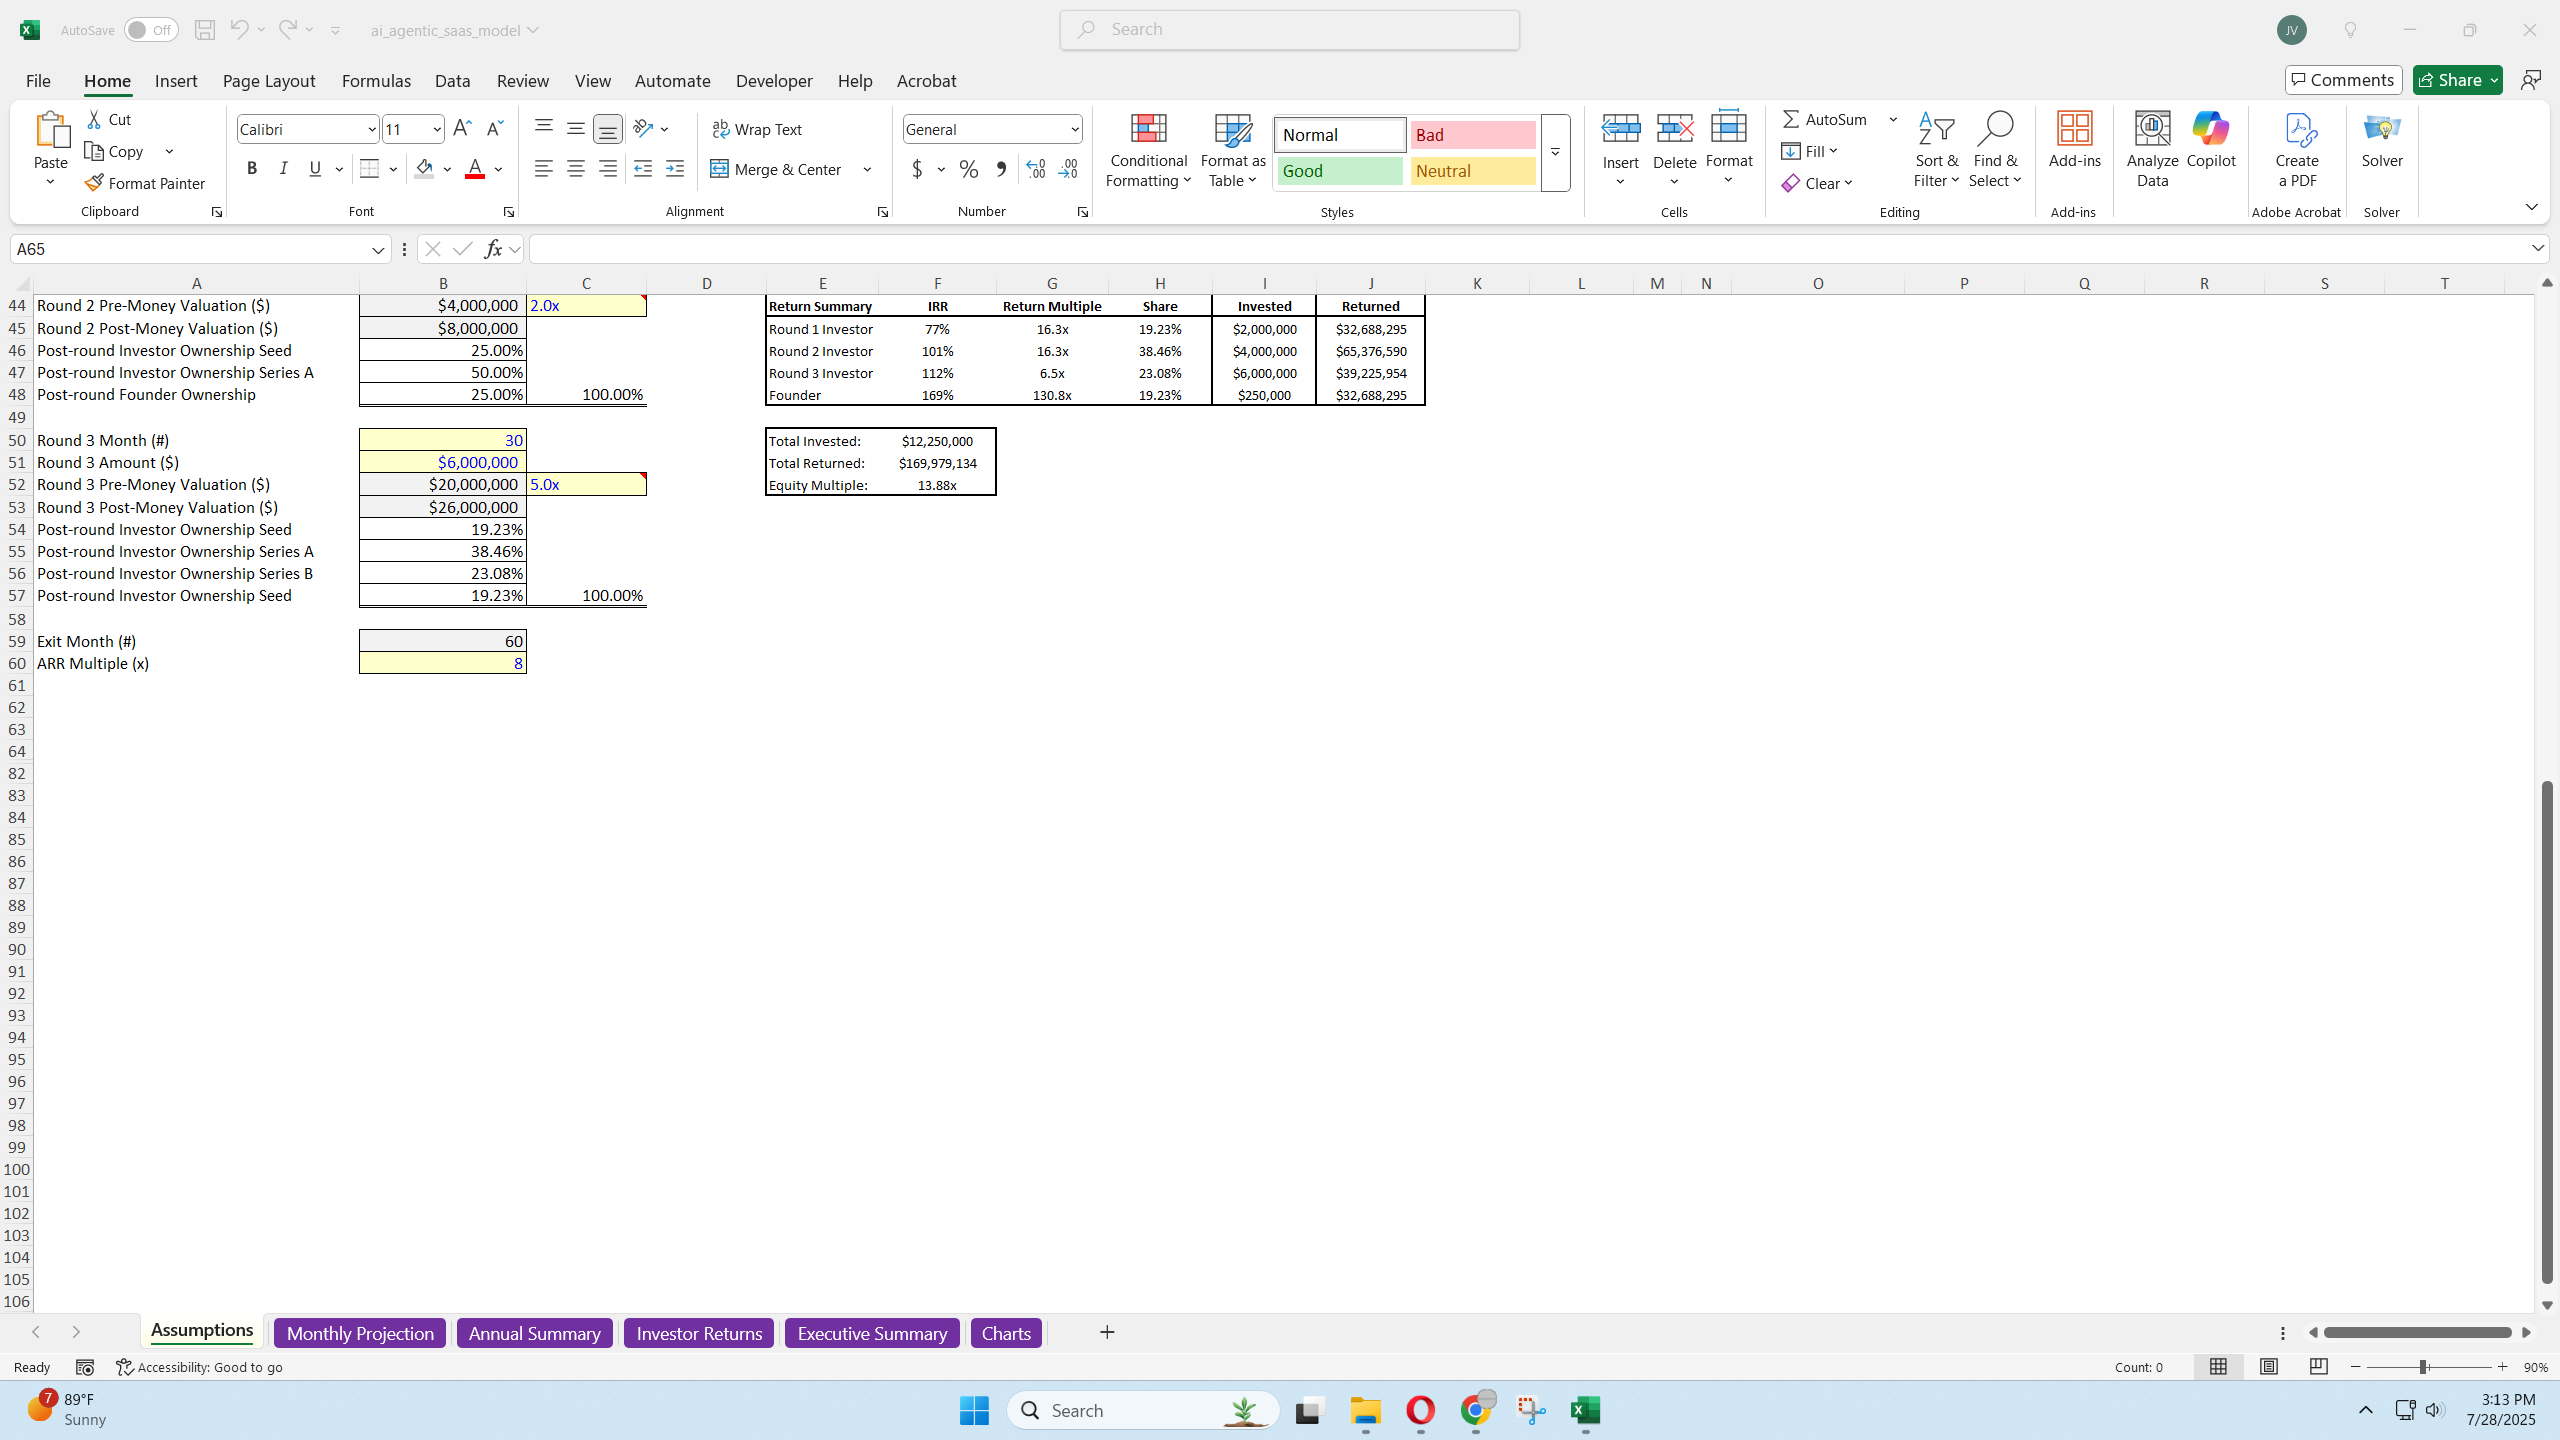
The template is designed for founders and analysts who want maximum insight with minimum friction. All the business levers—customer growth, pricing, usage intensity, cost per token, and fundraising terms—sit on one clearly labeled Assumptions tab, and the key return metrics (IRR, MoIC, payback) update in real time directly beside those inputs.  
Why it’s useful

  • Single‑input philosophy: one sheet controls the entire model, reducing error risk.

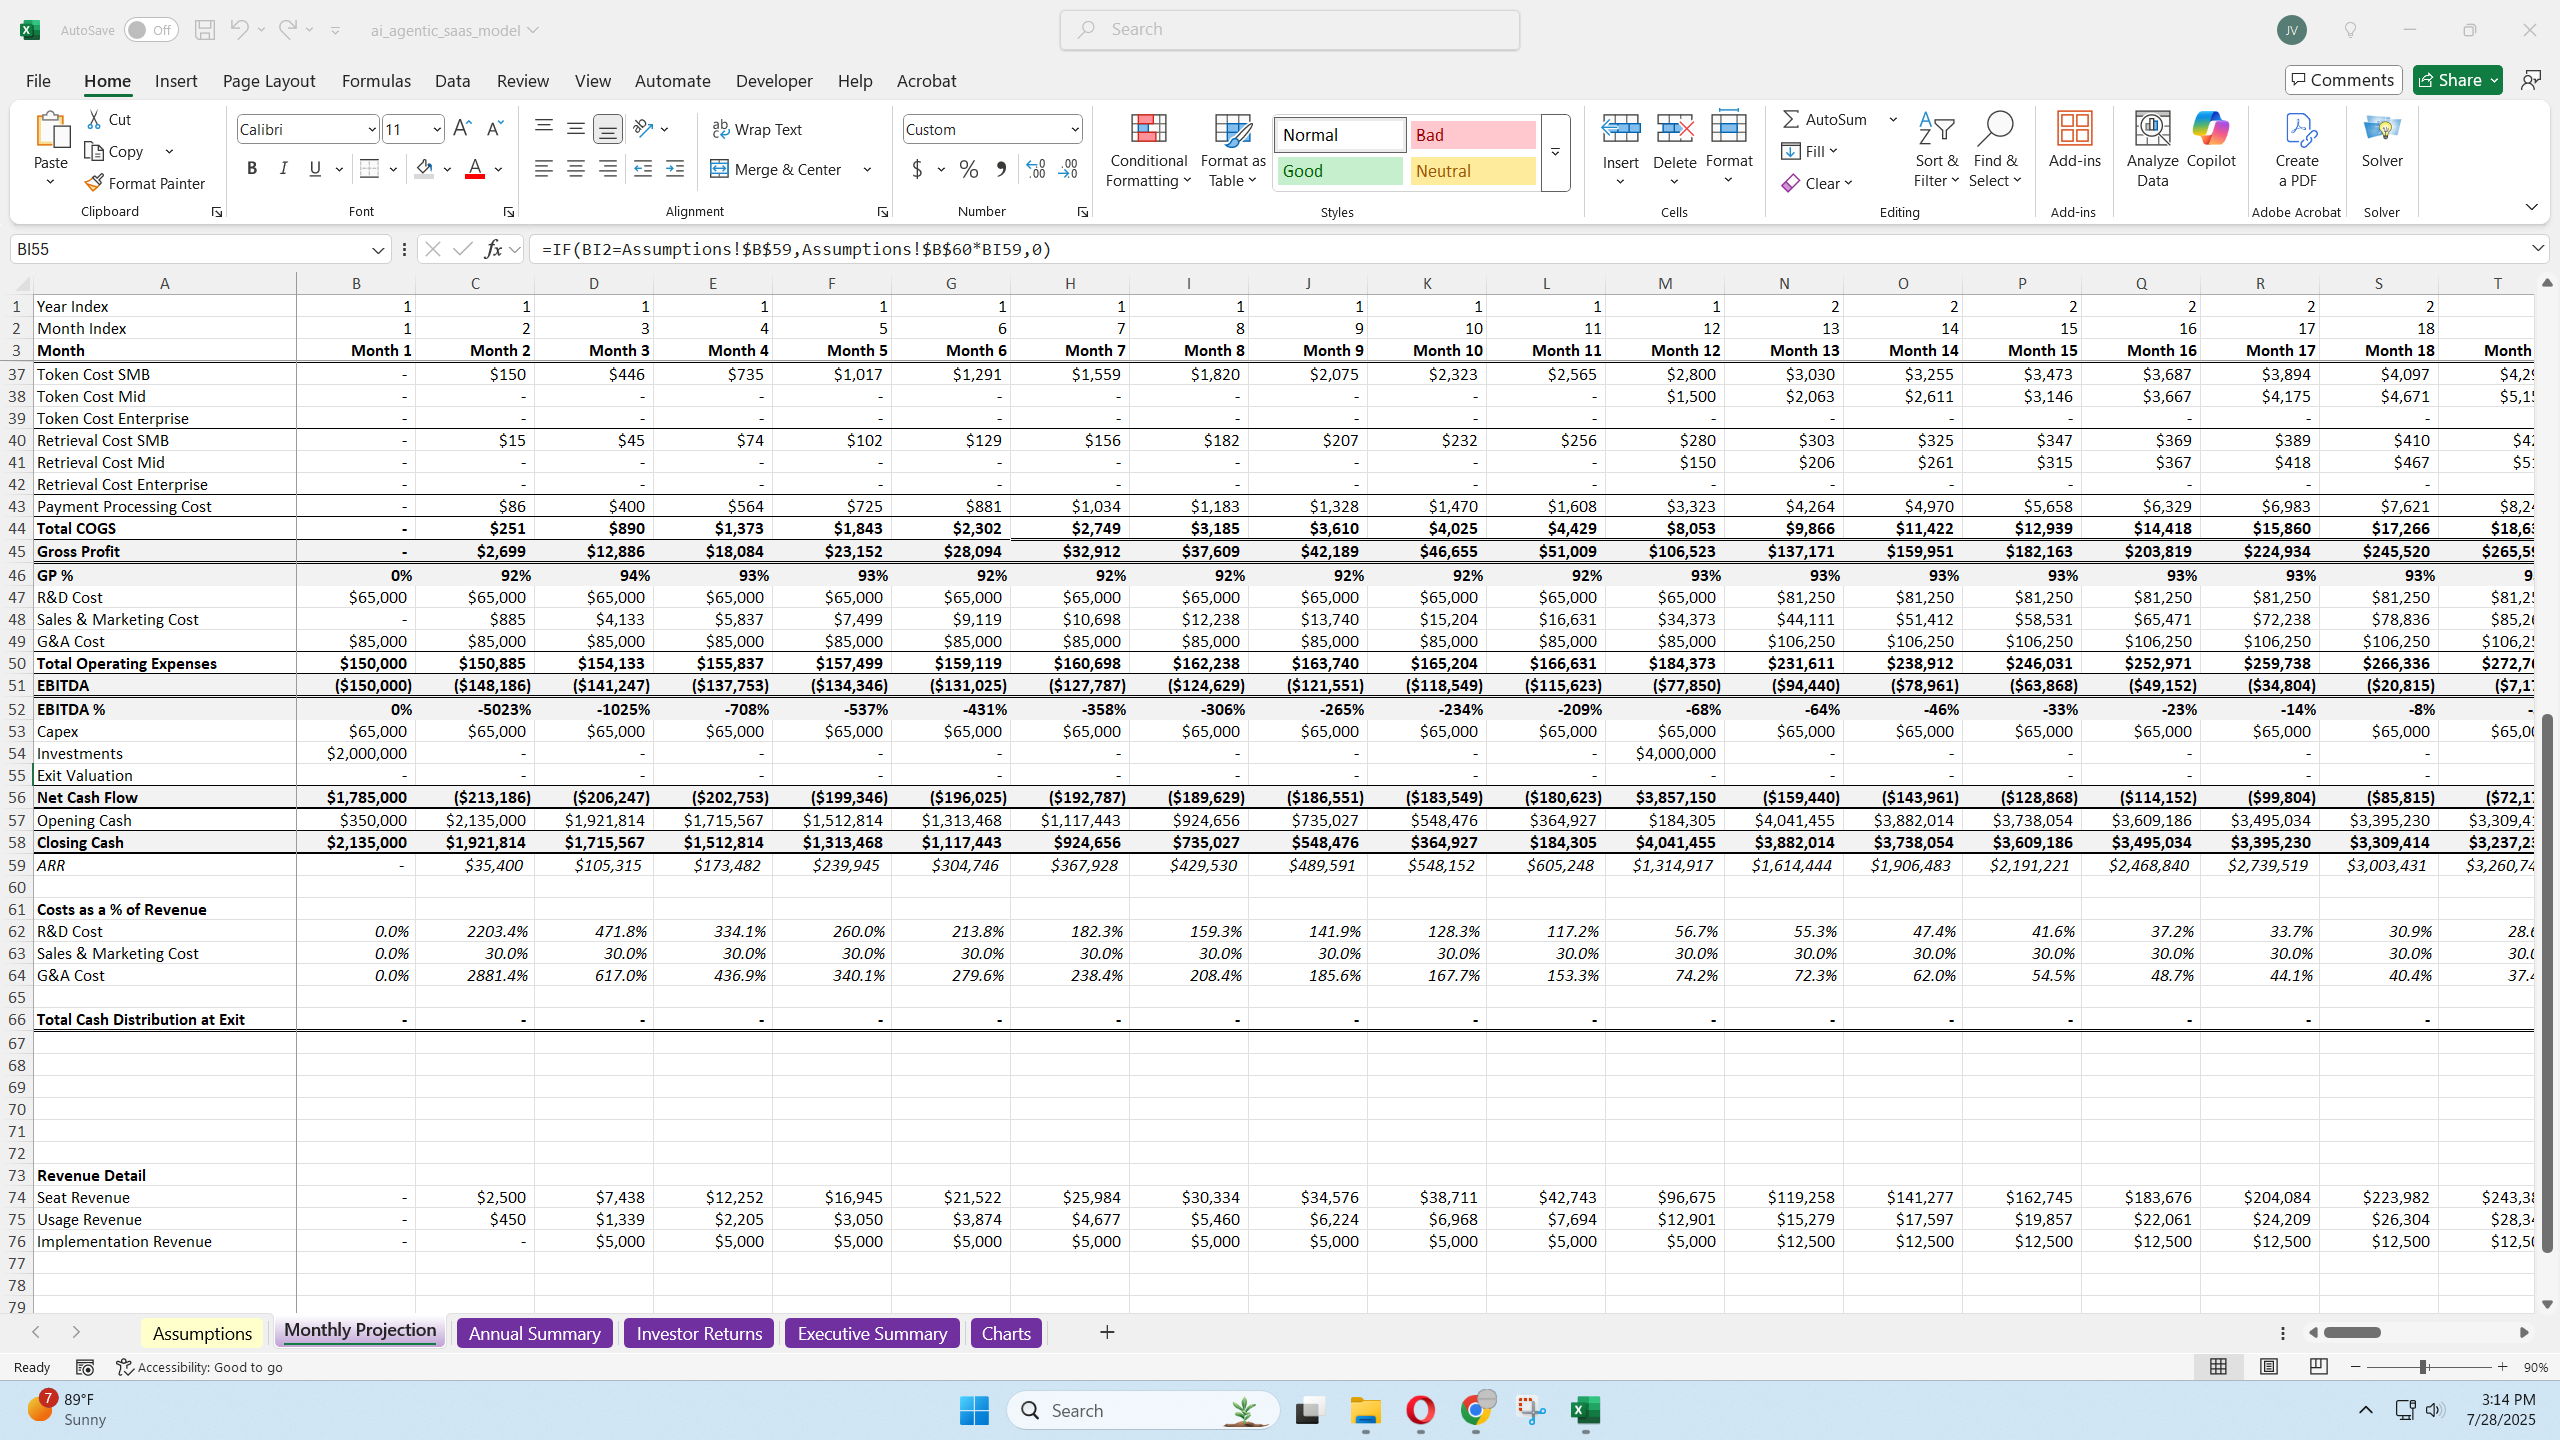
  • Instant feedback loop: tweak a number, immediately see cash flow, runway, and investor IRR change.

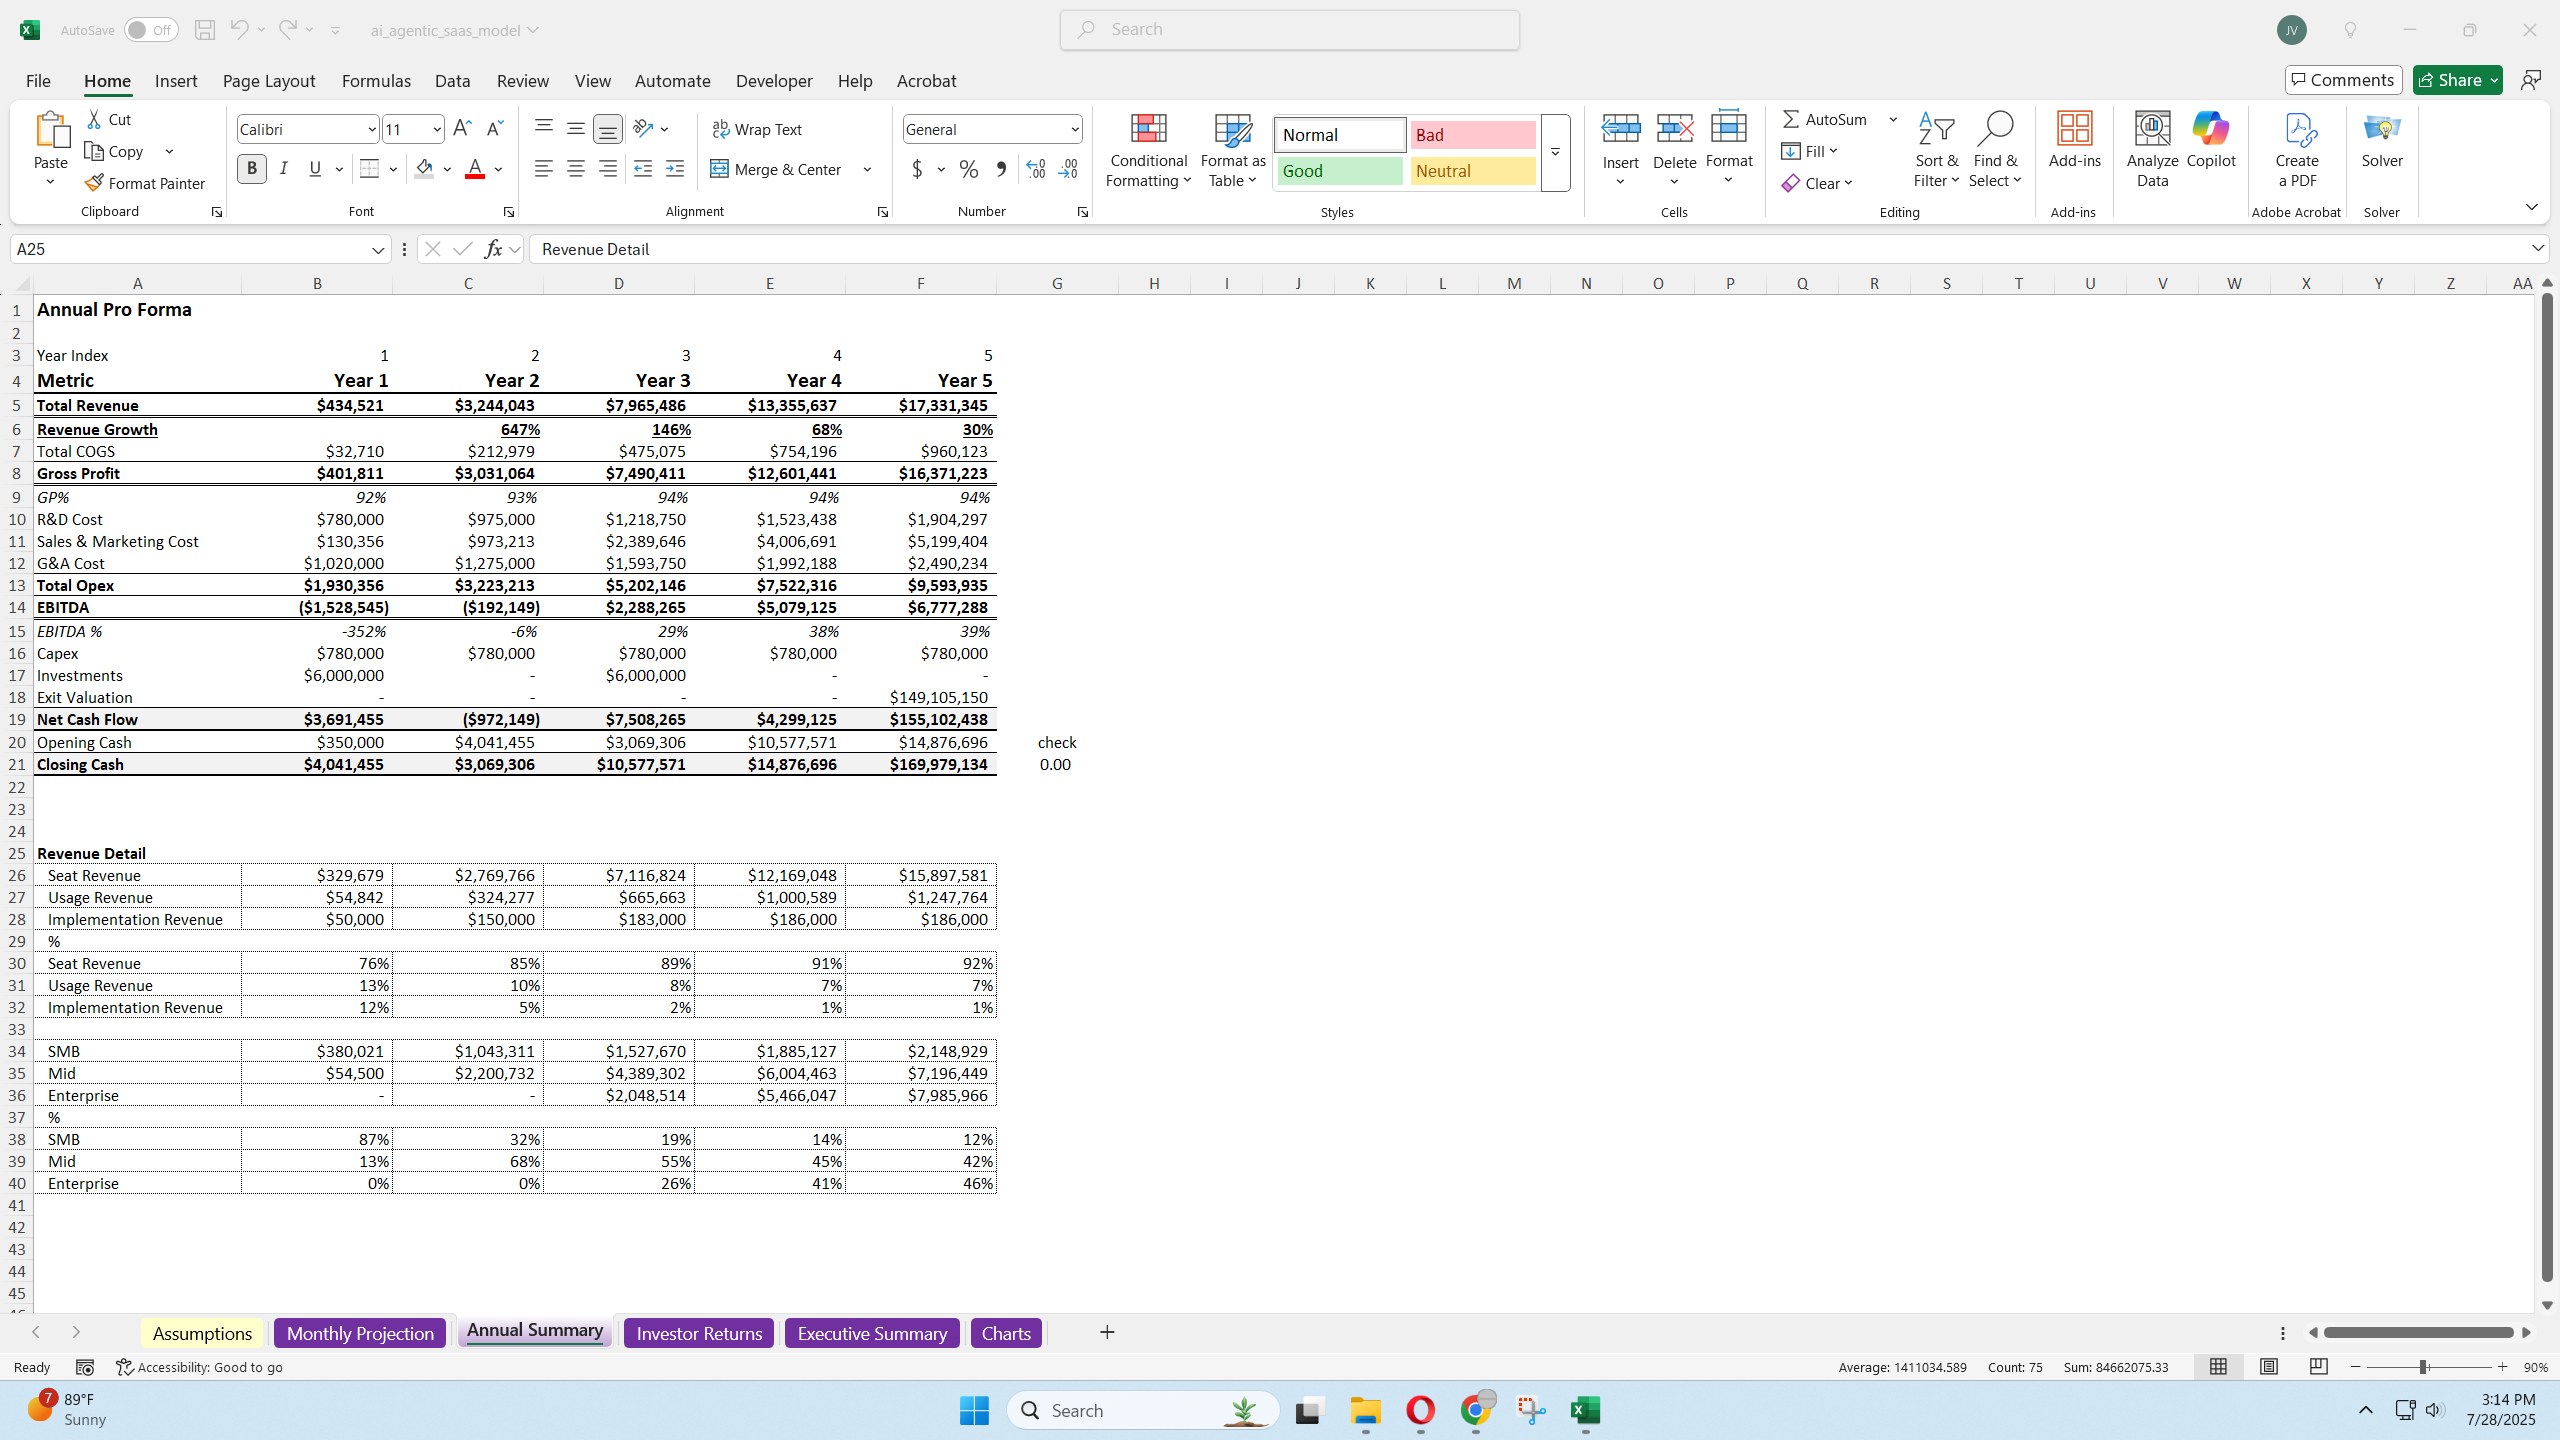
  • Five‑year horizon (60 months): long enough to capture scale economics, short enough to stay credible.

What’s under the hood
  • Revenue architecture:

    • 3 customer tiers (e.g., SMB, Mid‑Market, Enterprise)

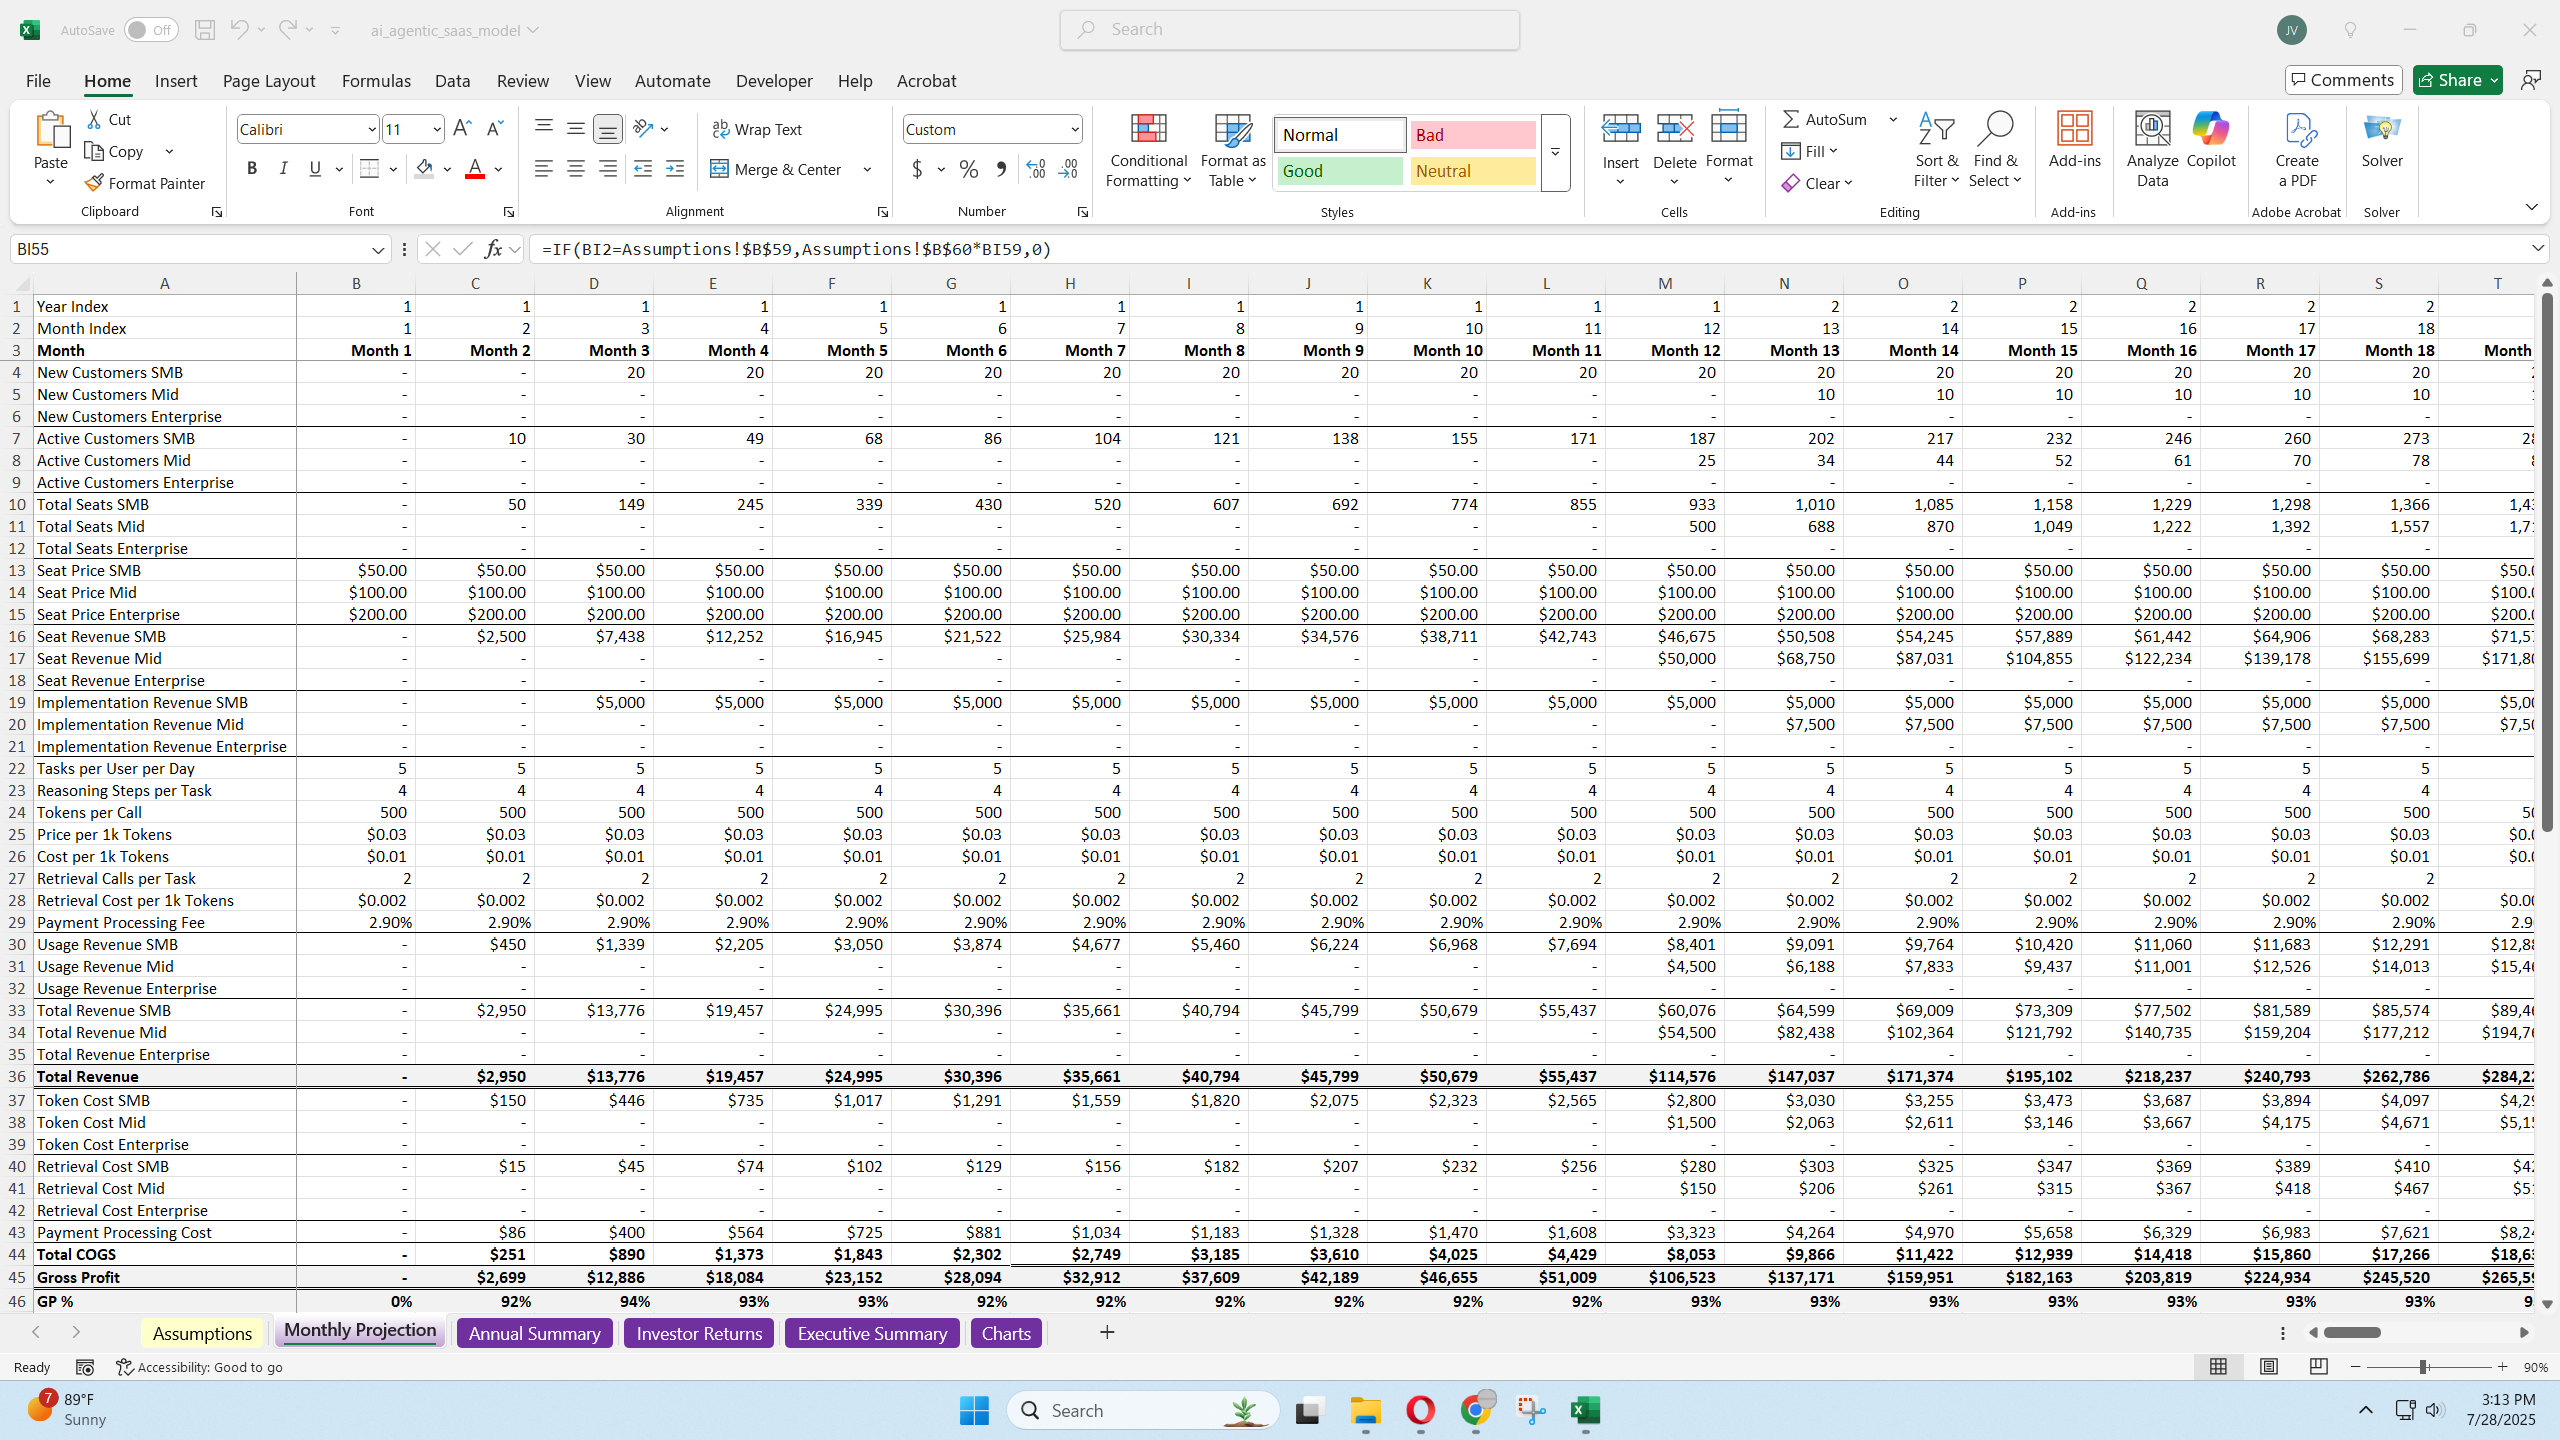
    • 3 revenue streams — seat subscription, usage (tokens/calls), one‑time setup/implementation

  • Usage engine: seats → tasks/day → reasoning steps/task → tokens → revenue & COGS.

  • Fundraising module: up to five priced rounds with option‑pool refresh and exit waterfalls.

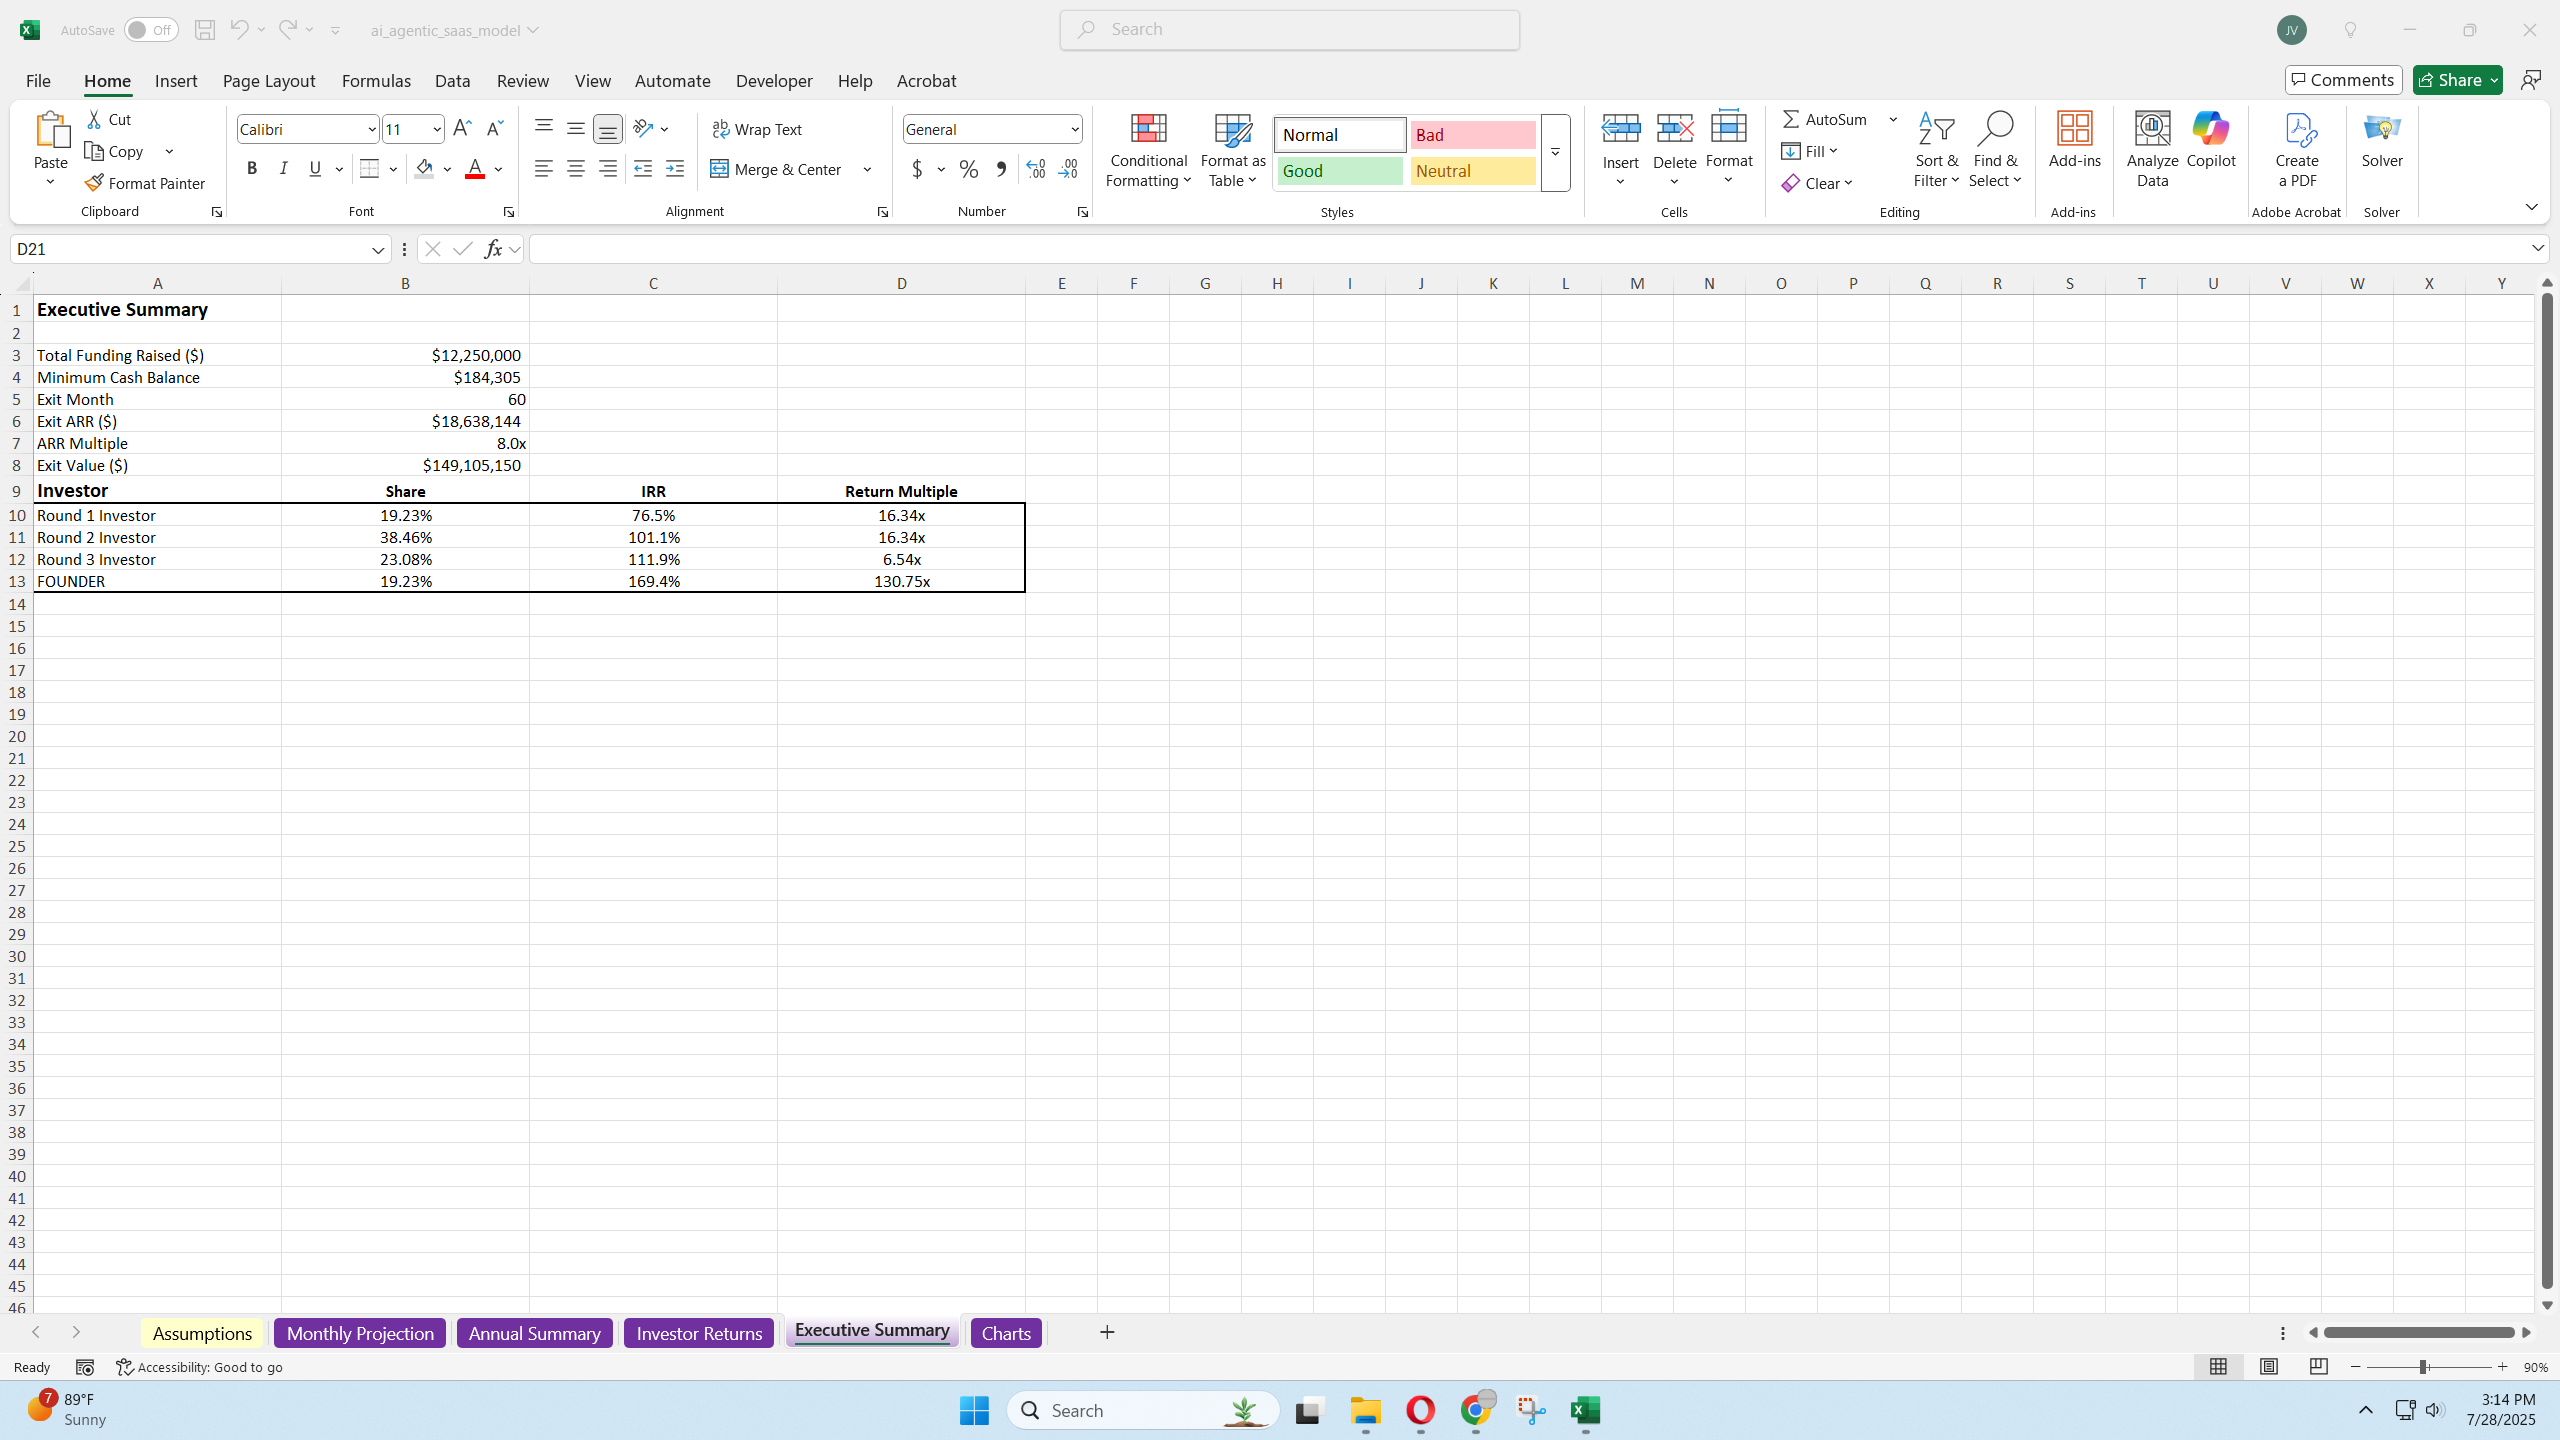
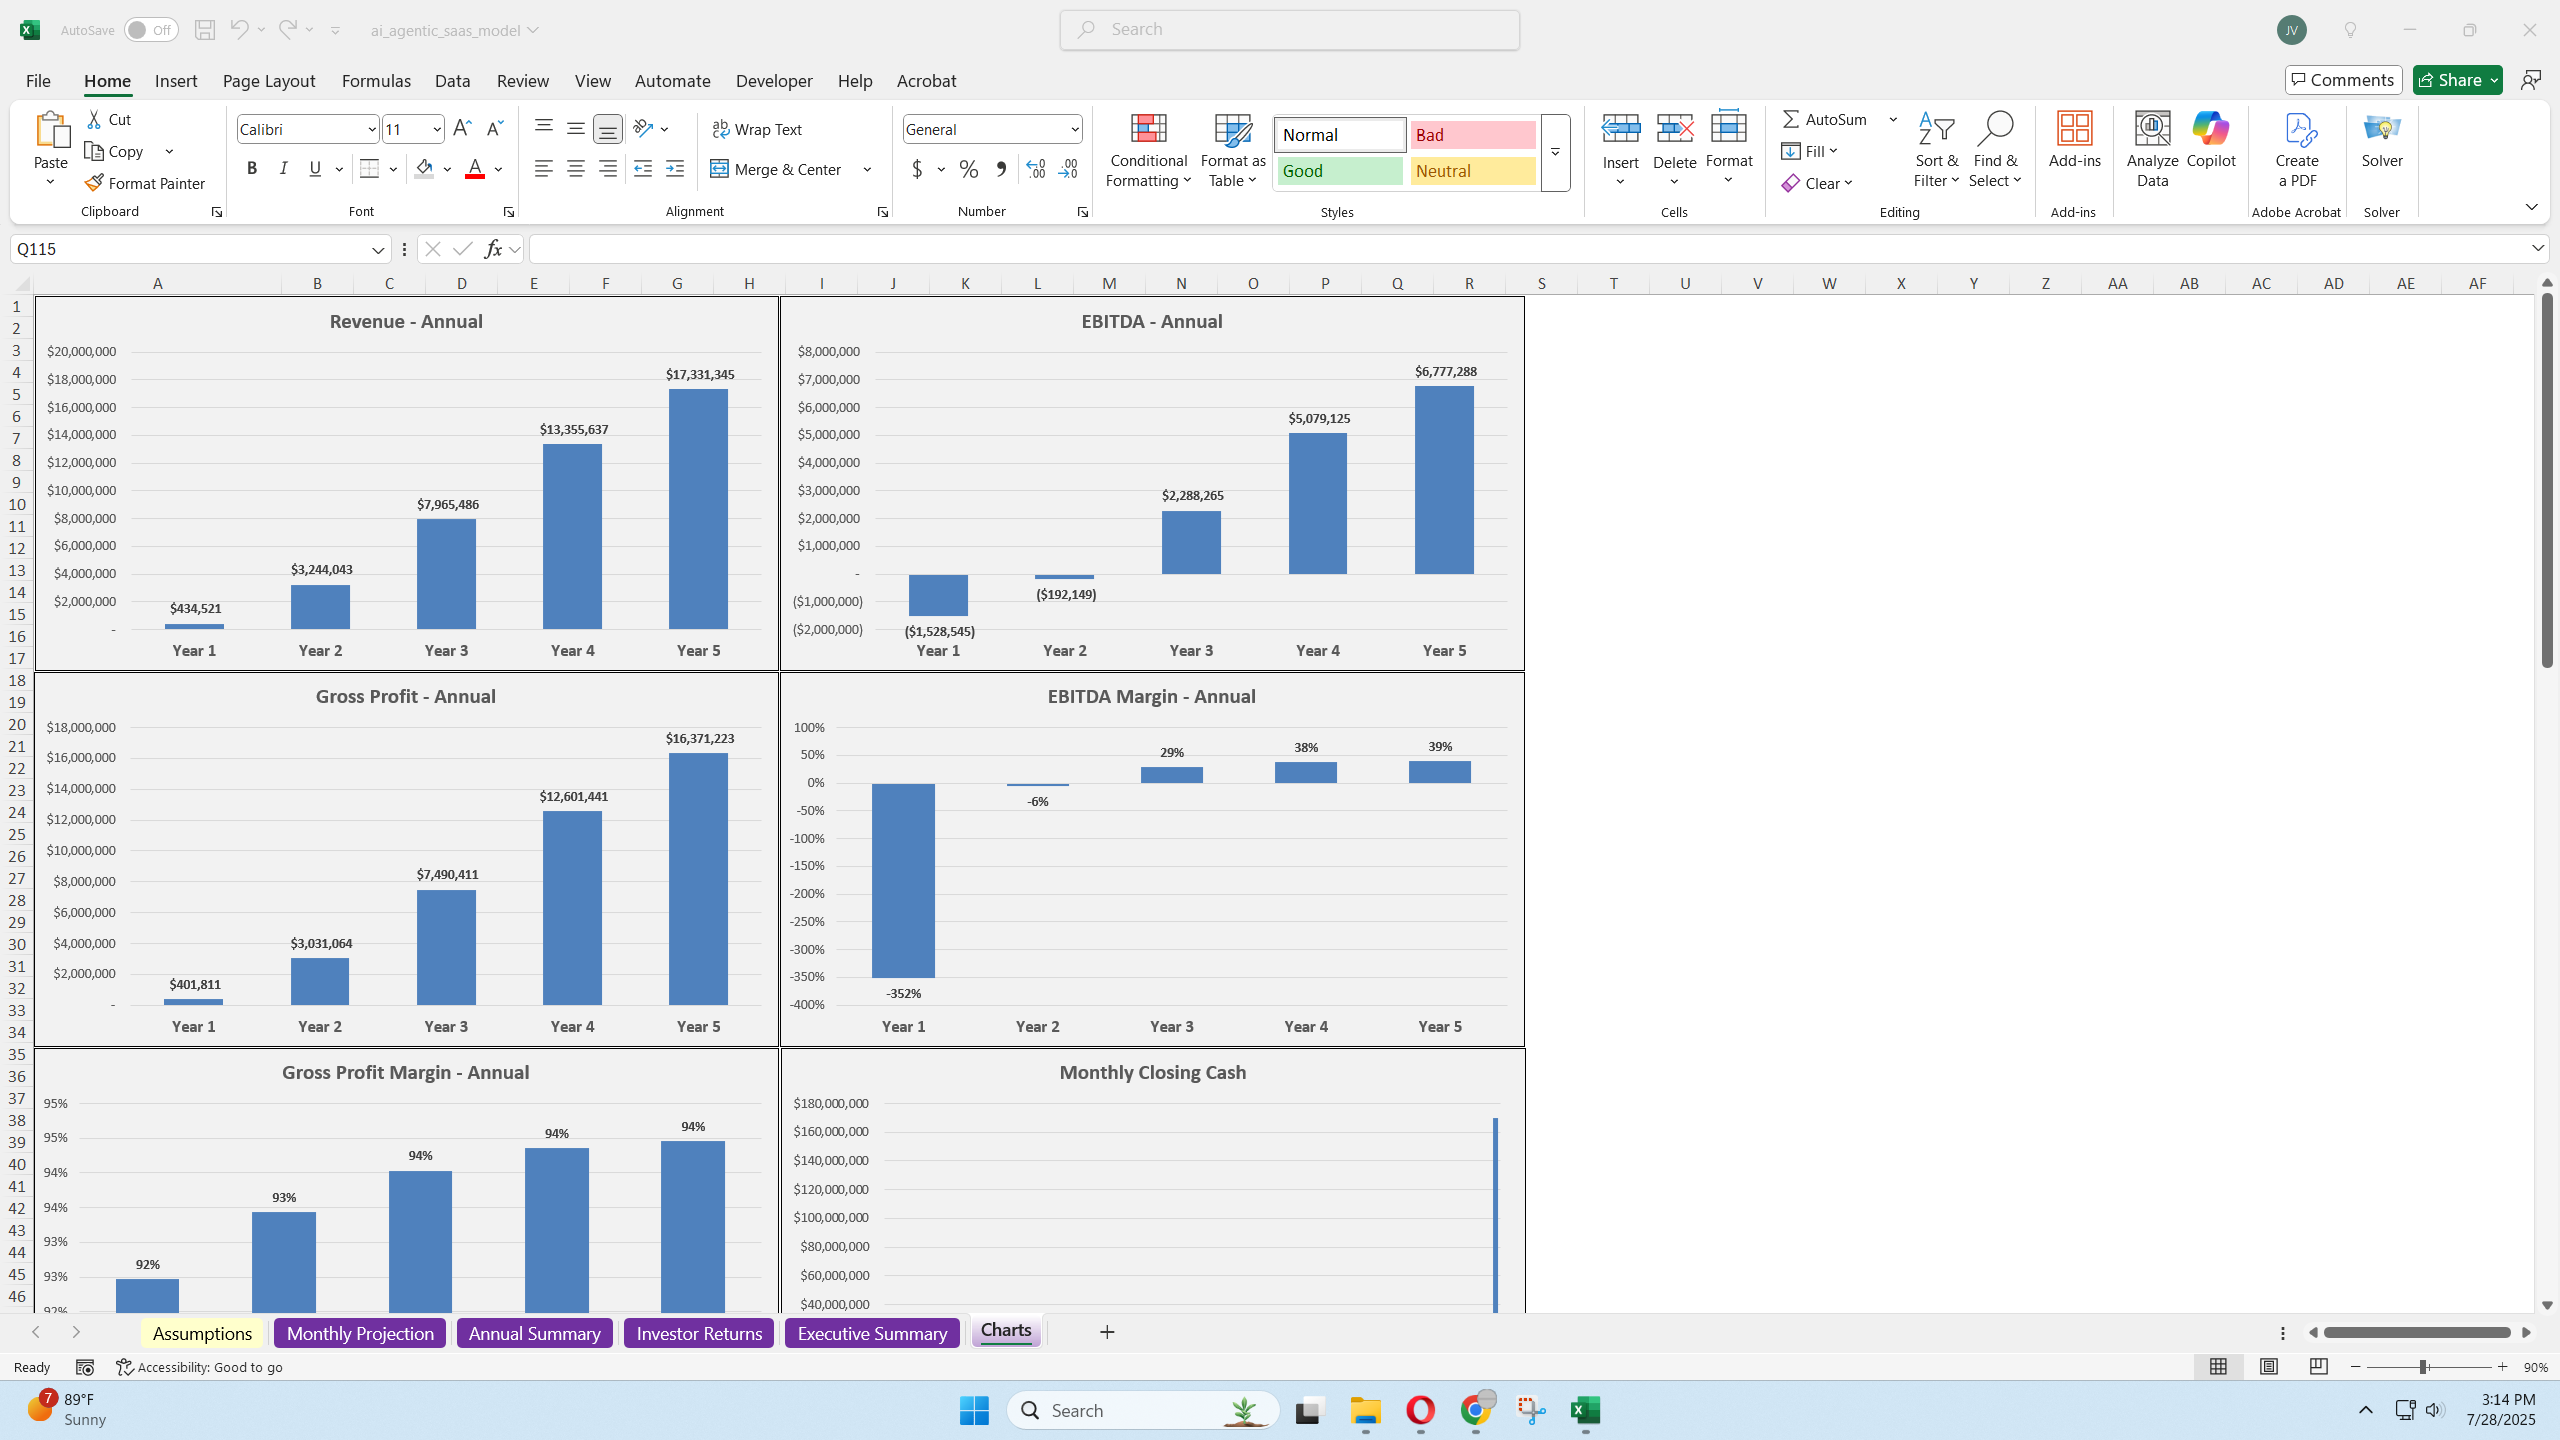
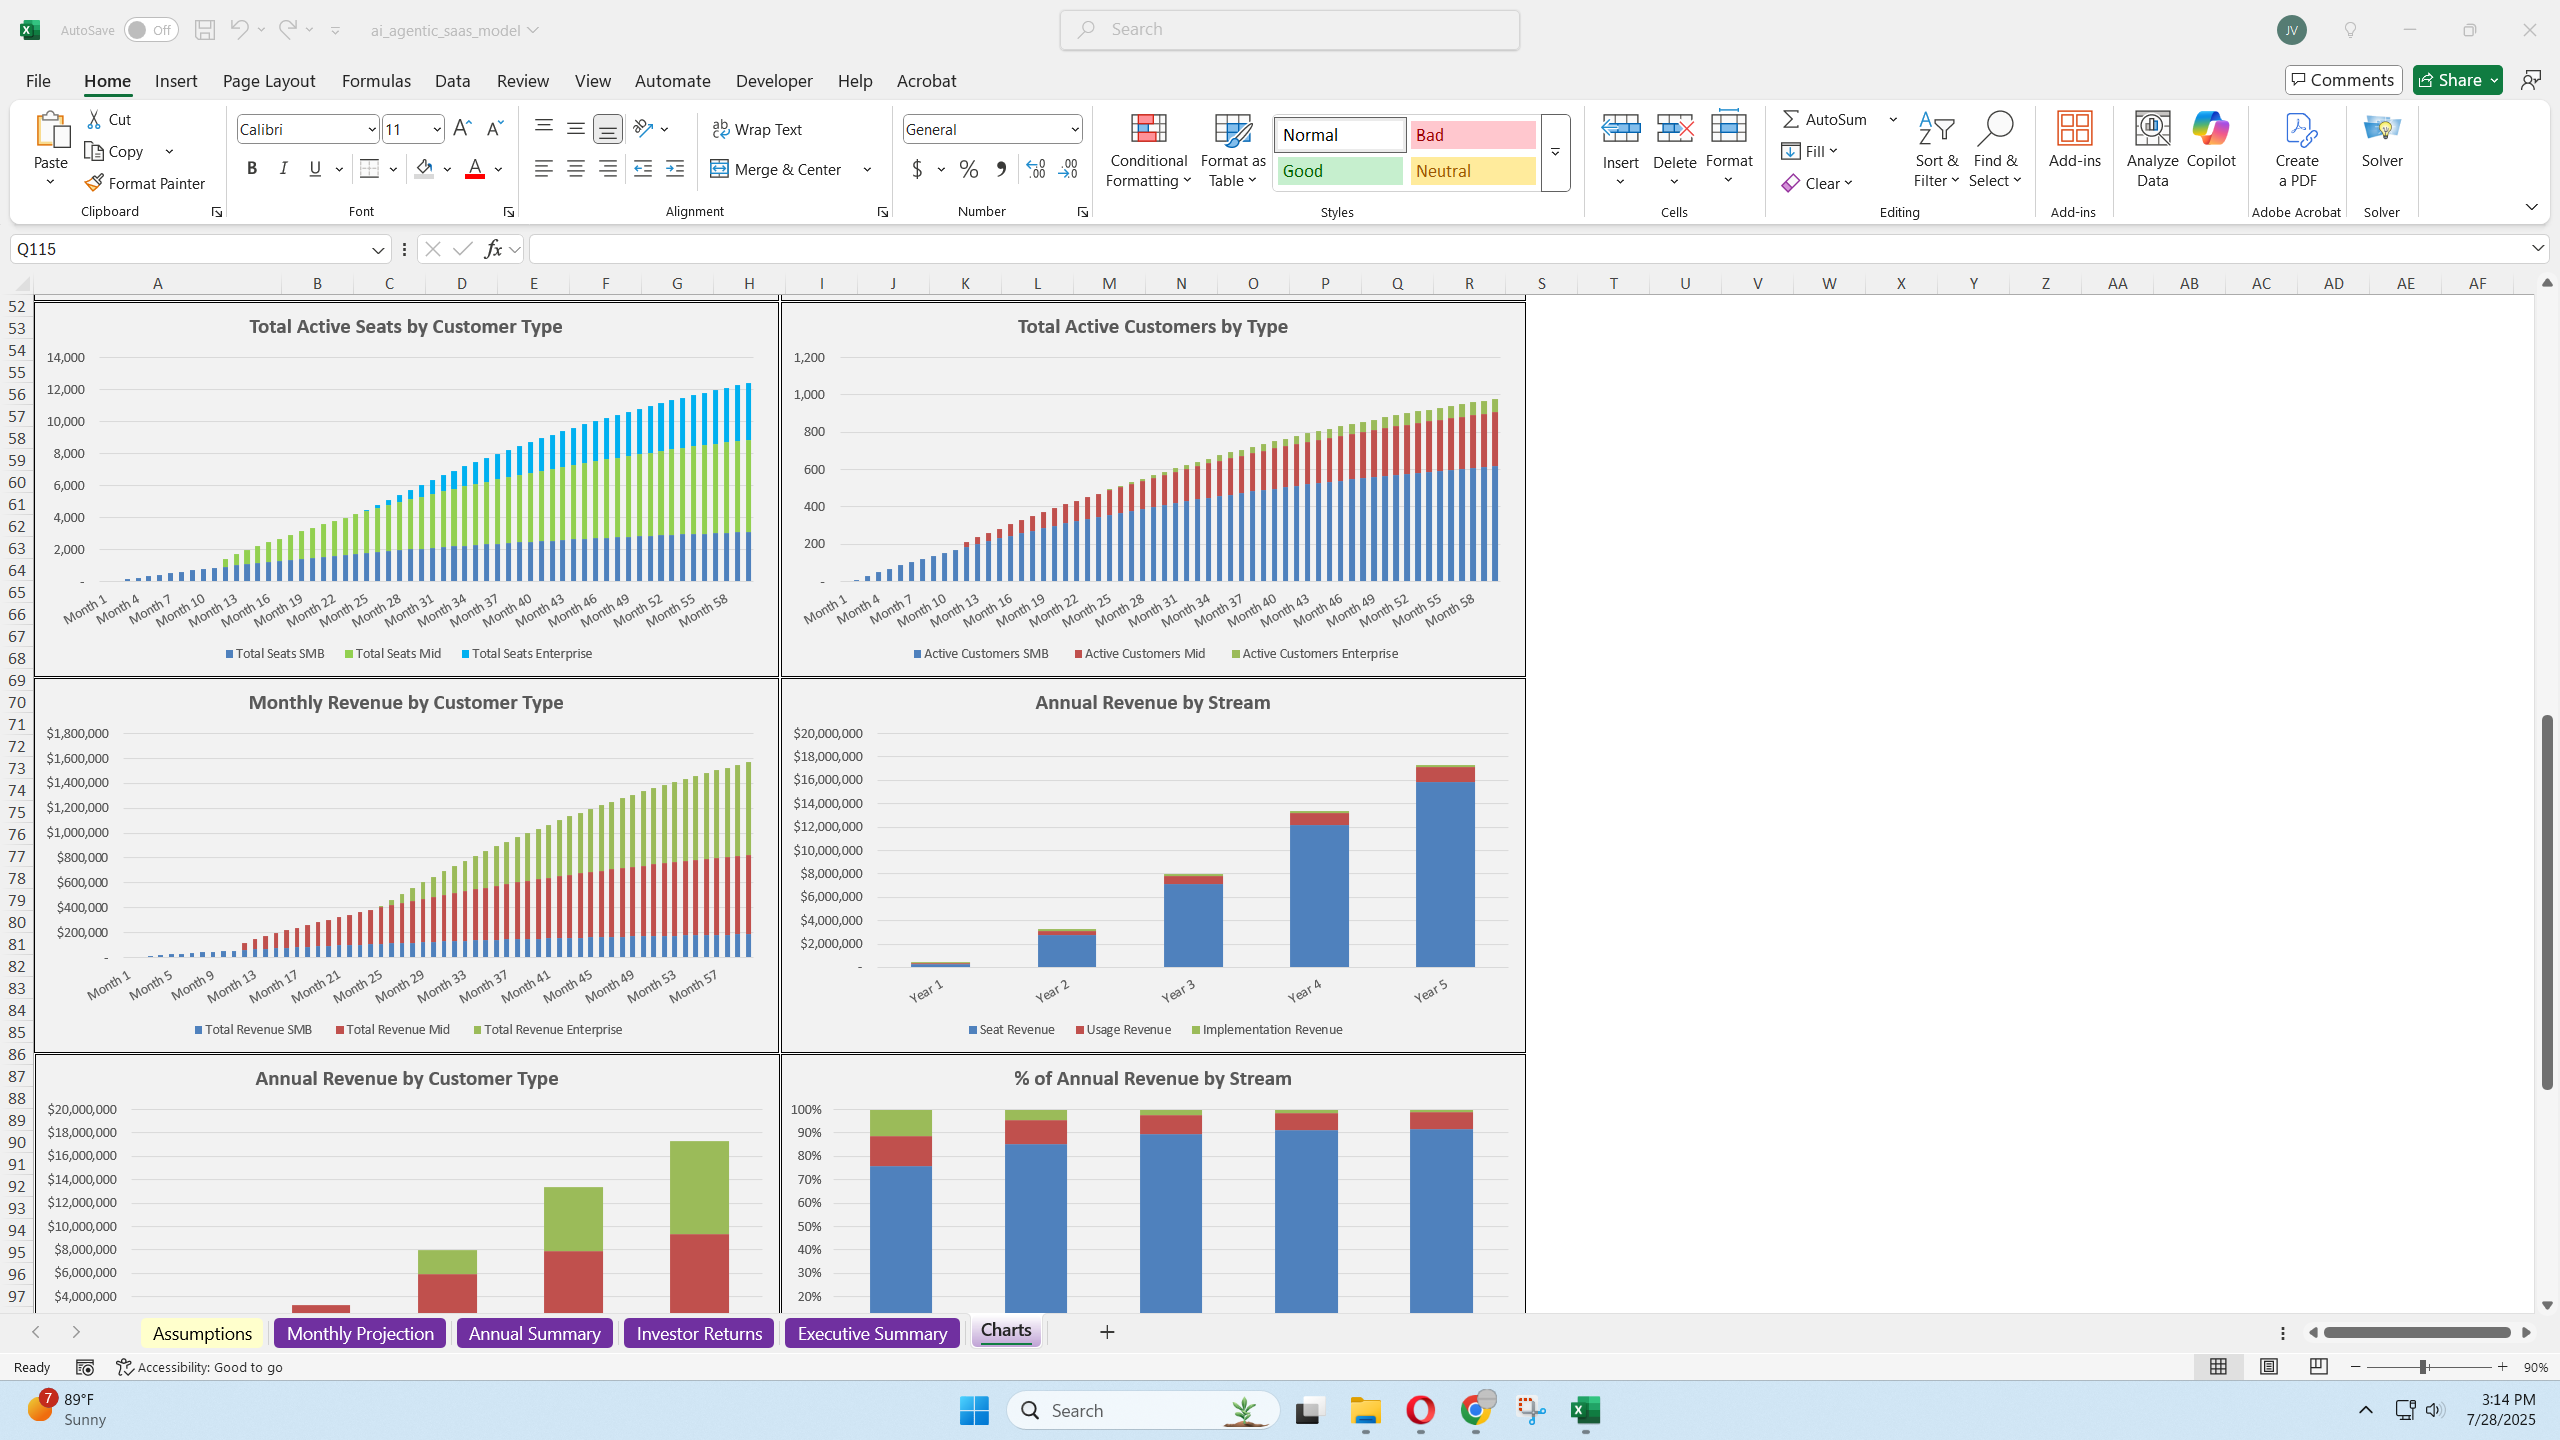
  • 13 dynamic charts: ARR build, margin trends, cash balance, cap‑table evolution, and more.

Typical workflow
  1. Enter assumptions (blue cells) for growth, pricing, usage, costs, and fundraising.

  2. Review Monthly Detail to confirm unit economics and burn/runway.

  3. Check Investor Returns to understand dilution and exit values.

  4. Export charts directly into pitch decks or board updates.

Key benefits at a glance
  • High‑leverage inputs, low break‑risk

  • Seat, usage, and implementation revenue—toggle any stream on/off

  • Pre‑wired sensitivity tables for rapid “what‑if” analysis

  • Clear separation between inputs, calculations, and outputs—easy to extend safely

Use this model to stress‑test pricing, map cash needs, and show stakeholders exactly how an AI‑native business can scale over five years—without wading through a maze of formulas.

This Best Practice includes
1 Excel model, 1 overview video

Acquire business license for $40.00

Add to cart

Add to bookmarks

Discuss

Further information

Plan and test your startup assumptions on a single tab, including sensitivity analysis and more.

Token-based AI SaaS businesses.


0.0 / 5 (0 votes)

please wait...