
Last version published: 26/08/2025 16:28
Publication number: ELQ-11659-2
View all versions & Certificate

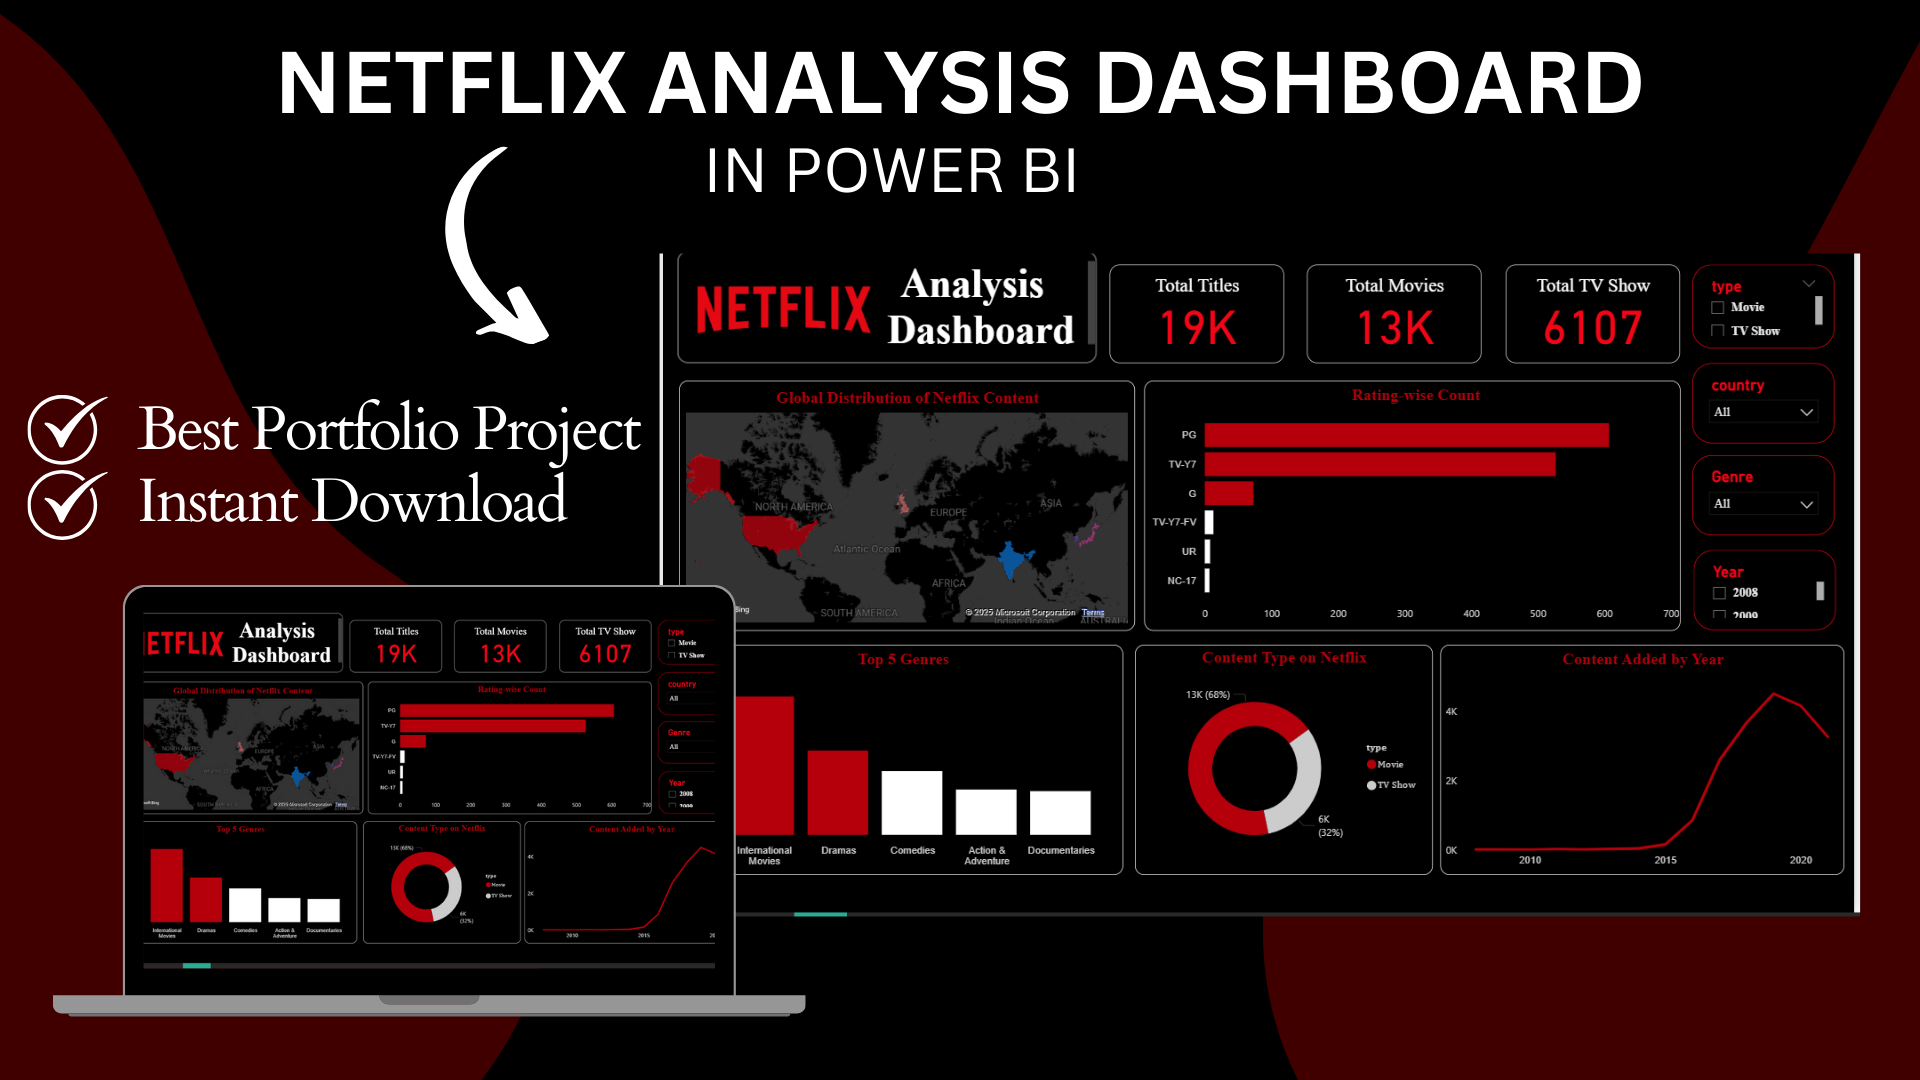
Netflix Dashboard in Power BI | Analyze Movies & TV Shows
Interactive Power BI dashboard built with the Netflix dataset. Explore movies, TV shows, genres, release years, and ratings with dynamic visuals.
Data Analyst | Excel, Power BI, Python, SQL Expert | Turning Data into Decisions | Business AnalystFollow
Further information
Provide a ready-to-use Power BI dashboard for Netflix dataset analysis.
Help beginners and data analysts practice data visualization skills using real-world data.
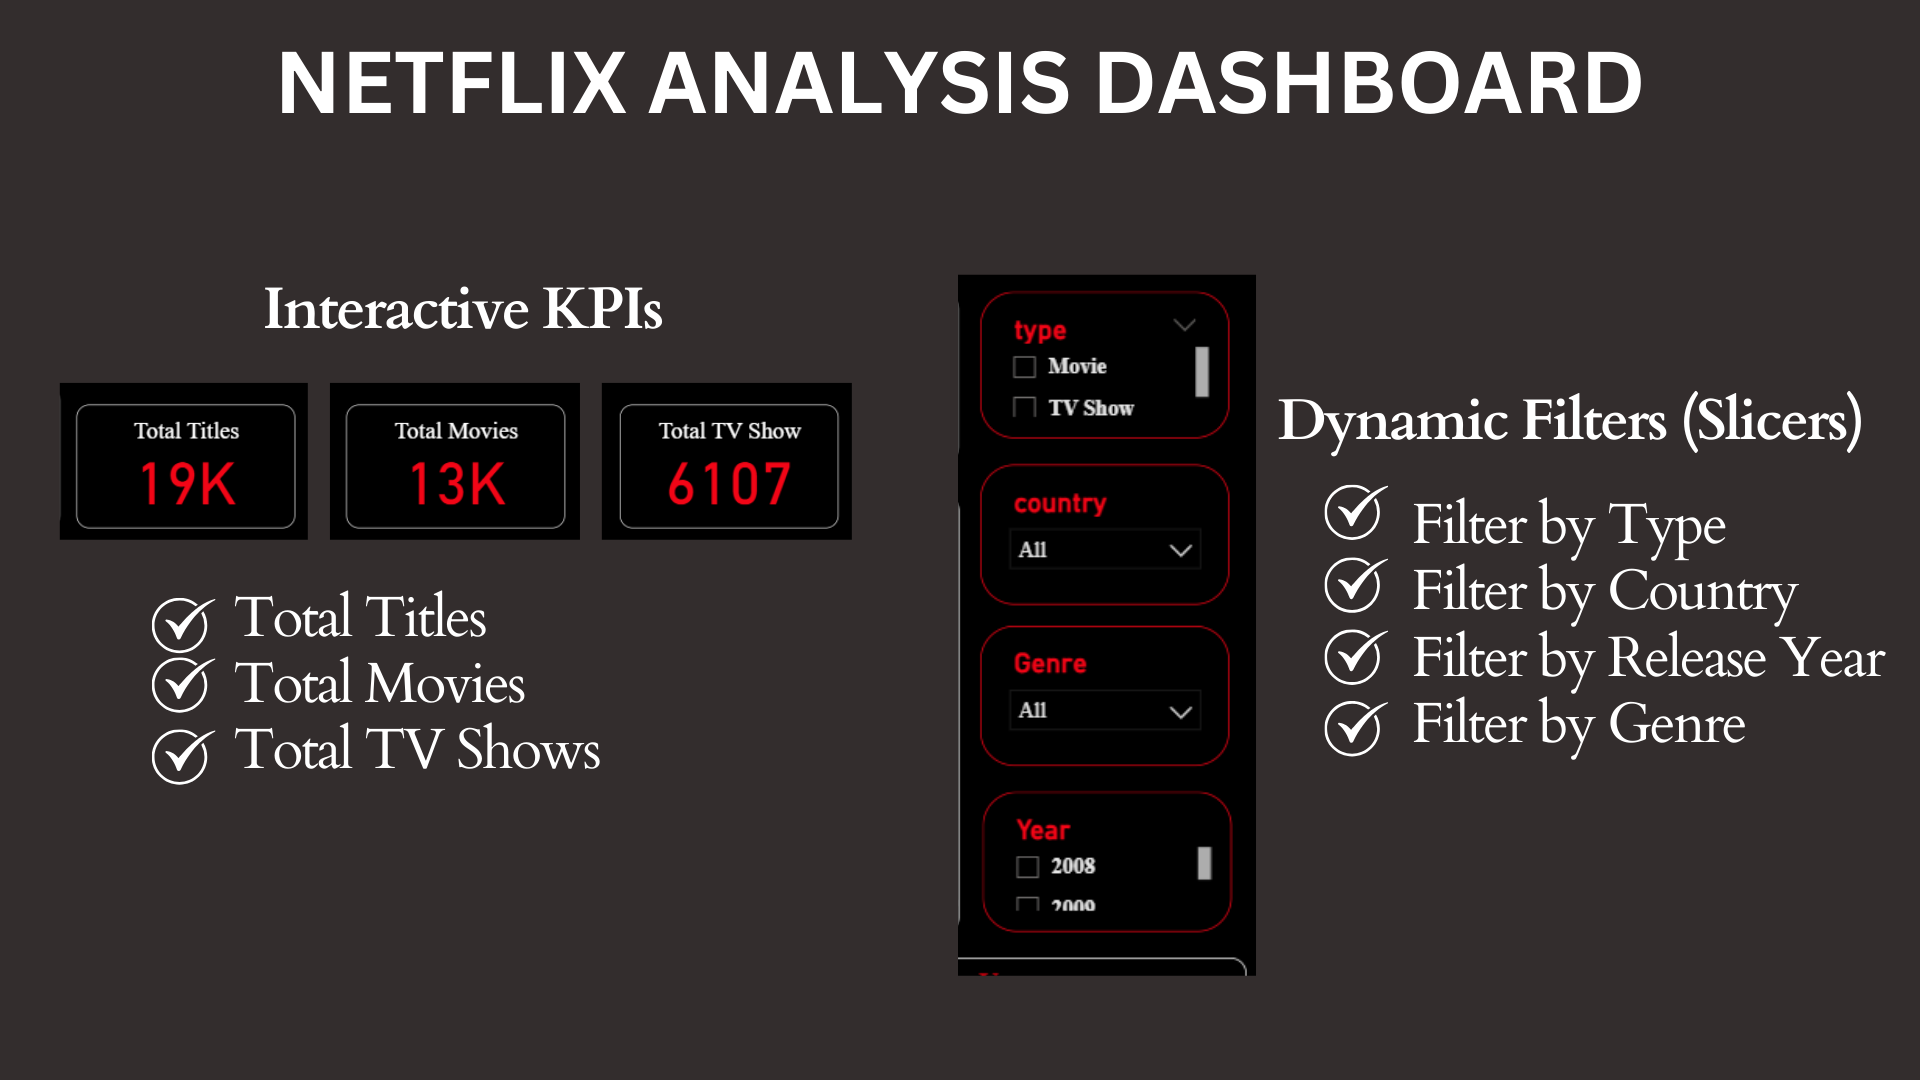
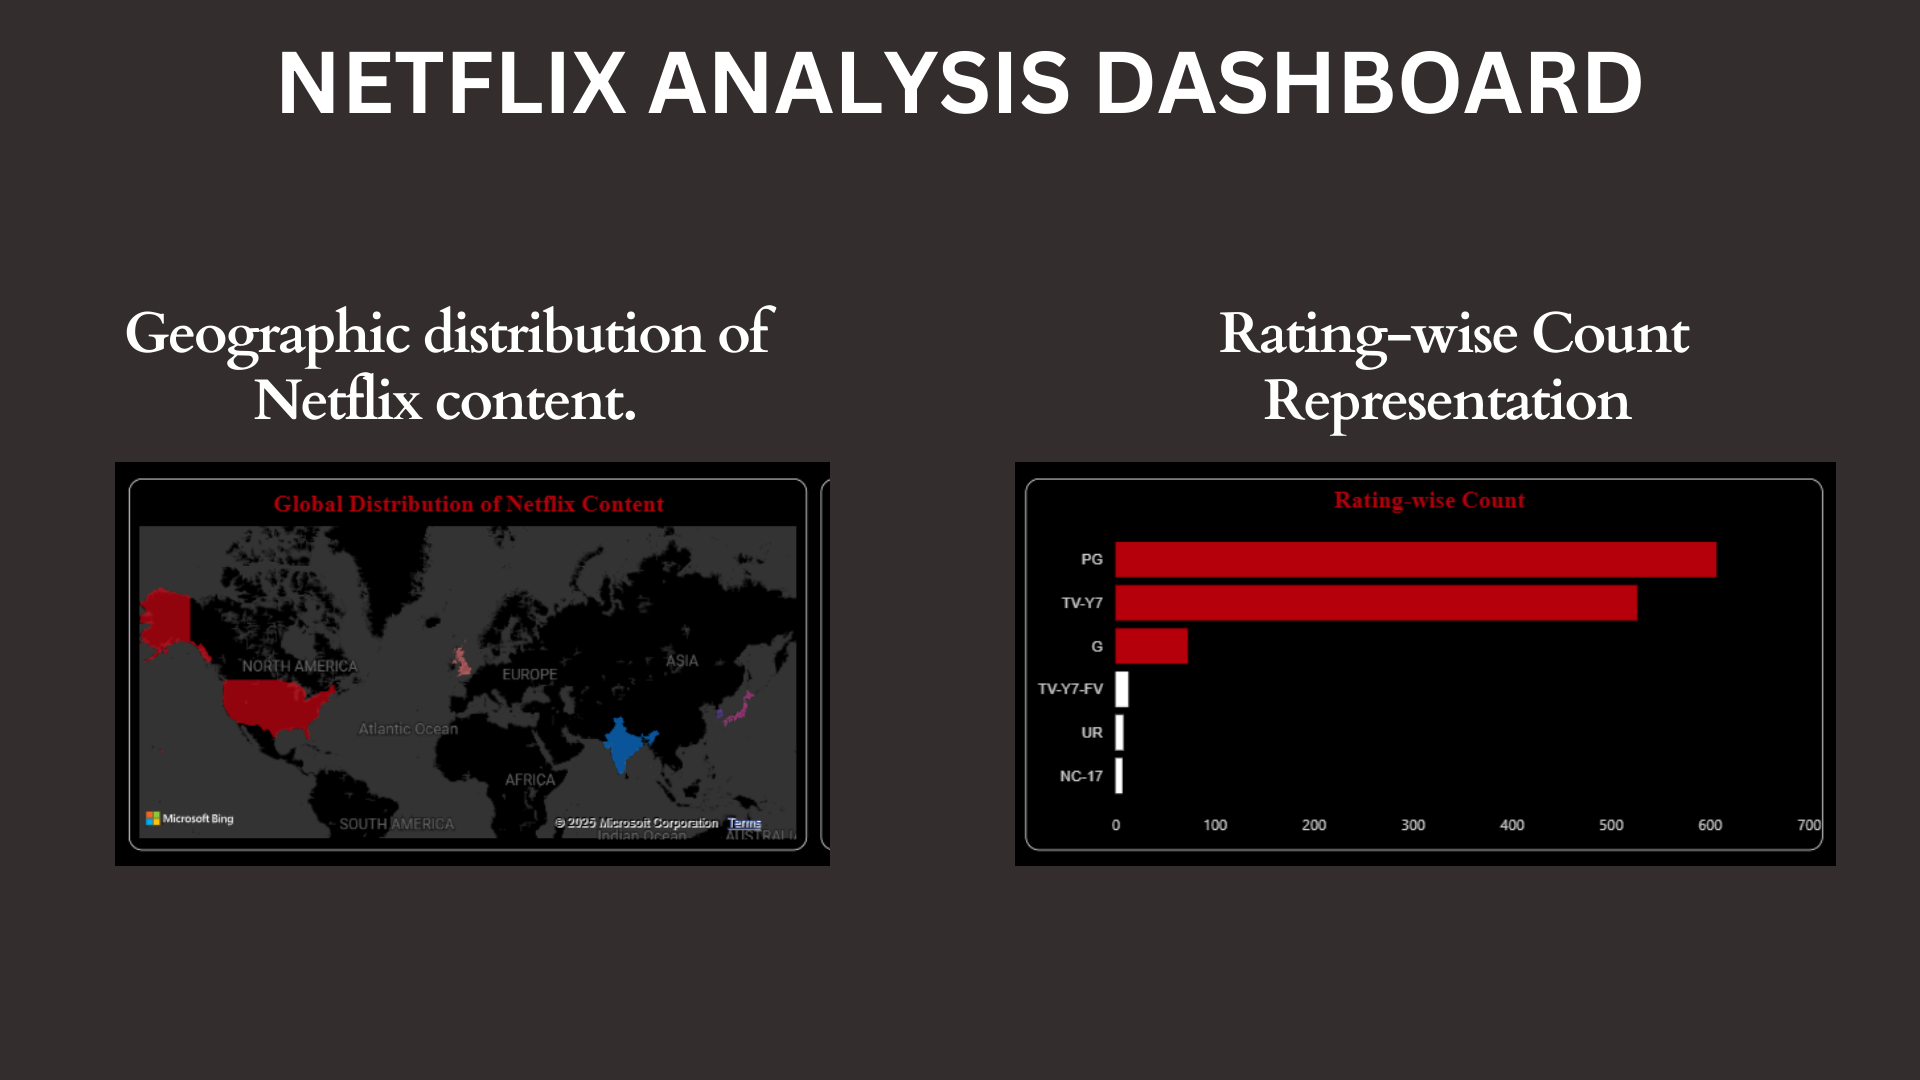
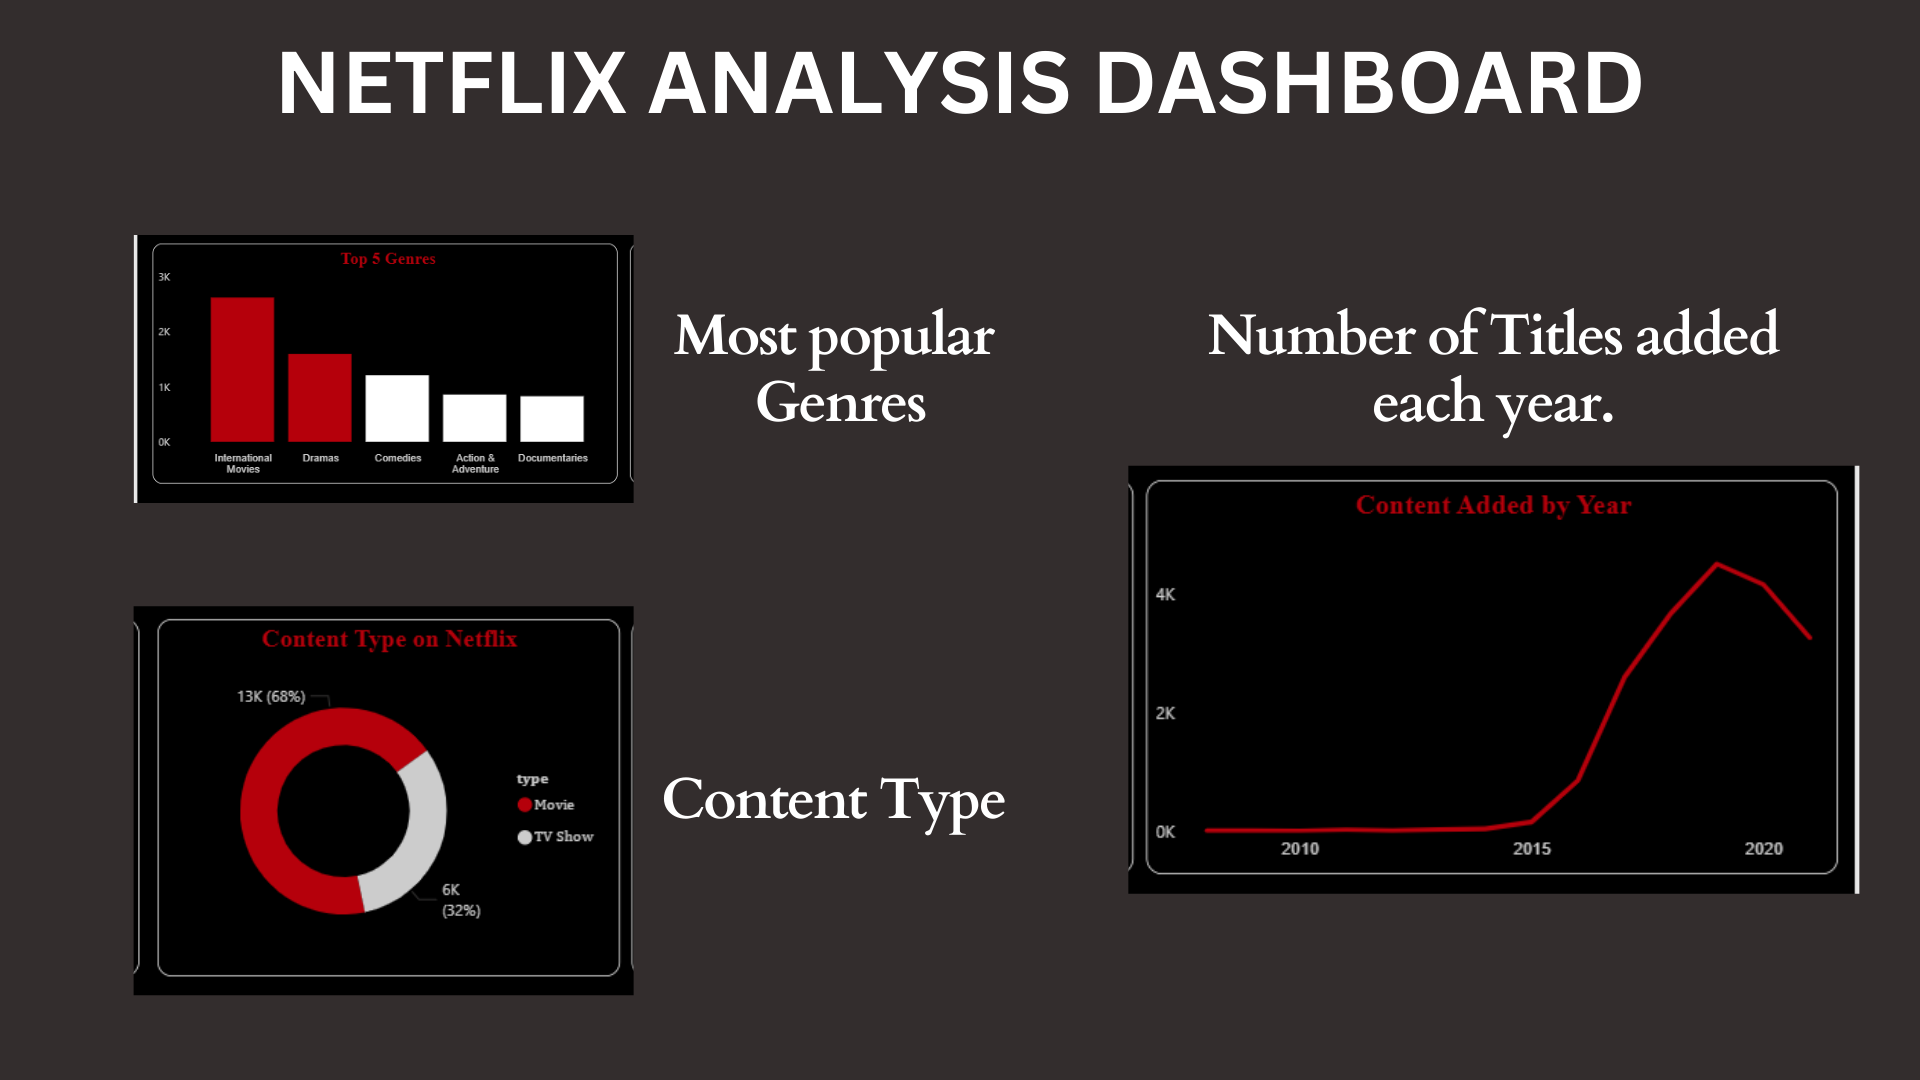
Showcase important KPIs like number of movies, TV shows, ratings, release years, and country distribution.
Enable learners to customize and replicate dashboards for their own datasets.
Support portfolio building for students and professionals in Data Analytics / Business Intelligence.
Users who are learning Power BI and need a structured example.
Data analysts who want a Netflix dataset dashboard to practice or showcase.
Beginners who are preparing their portfolio projects.
Trainers/teachers who want to demonstrate Power BI dashboards in class.
Users who do not have access to Power BI Desktop.
People expecting live Netflix API connection (this is based on a static dataset).
Advanced professionals who need highly complex analytics (predictive modeling, ML, etc.) instead of visualization.
